


Abstract
A long-standing problem in environmental DNA has been the inability to compute across large number of datasets. Here we introduce an open-source software framework that can store a large number of environmental DNA datasets, as well as provide a platform for analysis, in an easily customizable way. We show the utility of such an approach by analyzing over 1400 arthropod metabarcode datasets. This article introduces a new software framework, met, which utilizes large numbers of metabarcode datasets to draw conclusions about patterns of diversity at large spatial scales. Given more accurate estimations on the distribution of variance in metabarcode datasets, this software framework could facilitate novel analyses that are outside the scope of currently available similar platforms.
Database URLhttps://osf.io/spb8v/
Introduction
We are approaching the 10-year anniversary of ‘Conservation in a Cup of Water’ (10), a journal article in Molecular Ecology and something of a landmark in Environmental DNA (eDNA, a subtype of metabarcode data) describing the use of a fairly new technology at the time, eDNA, which the paper showed could be used to determine biodiversity at a relatively low cost. It is now a cliché to say that we have seen explosive growth in the number of available environmental DNA datasets for analysis; however, this deluge of data requires new methods to analyze it. eDNA analysis, as with much bioinformatics analysis, has not kept up in a way that allows for the comparison of thousands or tens of thousands of samples. Similarly, computational and methodological technology in the field of ecology has been trying to compare samples across large swaths of area and environment (15, 13). However, the goal of true meta-analysis, loosely defined as combining data from different experiments, has as of yet been out of reach or at the very least extremely time-consuming (18). The framework presented here, met, attempts to make a first pass at achieving Big Data eDNA sample computation as well as showing the benefit to ecological research of doing so. In order to achieve this target, we introduce ‘met’, an acronym for metabarcode, metagenomic, metagenetic enrichment toolkit. The ‘met’ in met stands in for three words starting in ‘met’, with the e and t standing for enrichment and toolkit, respectively. met is a software framework, utilizing databasing, web frameworks and just-in-time compiling, which starts to make an arbitrarily large number of sample comparisons possible. Principally, met stores eDNA data and allows for thousands of pairwise comparisons of samples or the search of a specific gene through thousands of samples.
eDNA relies on metabarcoding. Like gene barcoding, metabarcoding selects for a gene, but instead the selection is across species (6). The metabarcoding in question should be conserved enough to be in an entire taxonomic group of interest, but different enough in all relevant taxa to tell them apart (6). In effect, this means that a ‘single cup of water’ can determine the diversity of species in an area. Being a relatively low-cost method of sampling diversity, a not unexpected use of the technology has been to determine the total amount of diversity of organisms on our planet (examples of large sampling projects: (8, 14, 16)). More often, eDNA is used to determine the representative diversity of a given sample of an environment (examples of such projects: (5, 1)). There have been a few efforts to do this and perhaps the most notable effort has been Knight et al. 2012’s sampling of the English Channel, which claimed 60% representative diversity of the Atlantic Ocean in a single sampling of the channel (3).
Meta-analysis in eDNA is difficult due to the lack of standardization across experiments. Differences in preparation of samples and in sequencing can cause slight changes in comparisons of data between different experiments. There are a few ways to tackle this problem: either the field or application of eDNA could enforce more stringent controls on data production (12), the field could change acceptable reporting standards for metadata (19) or, as met does, strike a balance between the two: require some standardization through data format requirements, while utilizing alignment methods which allow for some effects caused from differences in data analysis methods (11). To address the challenges of cross-dataset comparison and to increase the speed of analysis, we created met as a framework around which to build other analysis solutions. Consisting of three main software repositories, all published Open Source under the Mozilla Public License Version 2.0 (see supplemental project page), the framework is designed to be portable to different compute scenarios. All three components are scalable and continuously integrated as docker containers. As a result of met’s design, it can simultaneously compare numerous metabarcoded datasets. met achieves this capability through database compression, reorganized database schema, scaling and a multi-threaded web API layer. met can compare thousands of samples from different experiments in a single analysis. eDNA presents a unique set of challenges in Computational Biology. The fact that eDNA relies on a single gene means that modern alignment algorithms can be bemusingly eschewed for older DNA alignment strategies, which in specific cases, may be faster than modern alignment. Specifically, this means that Levenshtein distance can be used (9, 2). Those familiar with alignment strategies will at once notice the similarities between Levenshtein distance and usual alignment strategies—both have cost functions to differentiate between strings, here referring to both text and DNA, and both are used to compare similar but slightly different strings. Genome-level alignment necessarily requires comparing many wholly different strings and generally comes with a storage strategy that makes strings easier to compare, for instance suffix trees (i.e. (17, 7)) or de Bruijn graphs (4). These data structures are not a cheap computational operation to initialize and generally require expensive computational operations to update the data structure given new strings. If, however, comparing many very similar strings, especially around kingdom metabarcoding cutoffs (e.g. a 450 bp reference sequence might be considered the same species at 97% identity or 14 bp differences), searching for a similar sequence would be faster than an alignment if a cutoff was used in Levenshtein (i.e. after so many differences move on to the next string). This assumes that the sequences are in the same orientation. Since met is making comparisons against similar sequences, Levenshtein can be used and would be faster than a bag of words comparison of k-mers, as both operations would require the complete comparison of all sequences for the detection of small differences. Considering that the met use case is to find the most similar sequences, the property of stopping comparison after too many differences in Levenshtein is more desirable.
Methods
To demonstrate some of the notable features of met, we explore Cytochrome C Oxidase I (COX1) arthropod eDNA samples accessible through the National Center for Biotechnology Information’s Sequence Read Archive (SRA). The SRA is part of the International Nucleotide Sequence Database Collaboration that includes data from the European Bioinformatics Institute and DNA Data Bank of Japan. We downloaded relevant datasets en masse to determine global arthropod Amplicon Sequence Variant (ASV) diversity (for more on the query used, see Supplementary data). We loaded 1405 datasets into met to calculate world-wide aquatic COX1 diversity. ASVs are composed of each unique barcode variant found in a sample. This set was pared down manually from an initial 5900 COX1 samples by filtering for only aquatic arthropod samples. To demonstrate the utility of met, we compared all samples by calculating the total diversity of ASVs (see: Figure 1, Panel C) and the cumulative increase of ASVs across samples (see: Figure 1, Panel B). We also mapped the 515 samples that had latitude and longitude information (see: Figure 1, Panel A). Using met, the data retrieval and functions to generate these plots took only a matter of seconds.
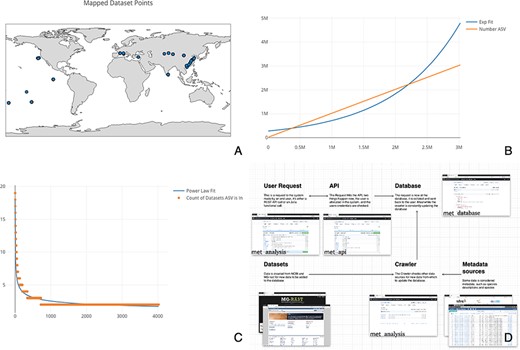
(A) Map of the 515 samples with latitude and longitude data. Samples tended to tightly cluster around locations, correlating with particular biodiversity assay experiments. (B) Number of sequences found per ASV, sorted by the number of ASVs found. If each ASV was counted across all datasets, it would necessitate an n2 operation of all sequences compared to all other sequences. Most analysis software have some solution to this all-on-all problem. met overcomes this difficulty by storing ASVs in a separate table so that this operation becomes a ‘n’ operation of grouping and counting the ASV’s associated datasets. The inferred ASV diversity followed an exponential function, with a substantially long tail. (C) Cumulative plot of any particular ASV found across samples. The plot is reverse sorted by count of samples in which the ASV is found. Although it may not look like it to the eye, no single sequence was found in over 20 datasets. (D) A diagram of met’s different pieces: met-api is composed of three major components: met-analysis, met-api and met-db. met-analysis is the main point of entry for the framework. Data gathered by crawlers would be inserted via met-analysis, and data for further downstream computation would come out of met-analysis. met-api is the only entry point for met-db, and met-db contains all information an analysis project may be interested in.
met is written in Perl, Julia and PostgreSQL PL/pgSQL (PostgreSQL Procedure Language SQL [Structured Query Language]). met-db is written as an optimized PostgreSQL schema restoring external datasets. A decreased emphasis on database views and an increased emphasis on efficient database functions written in PL/pgSQL means that the data storage backend is compressed due to the benefits of a database. Writing in this layered approach ensures that met components (e.g. Data Storage in PostgreSQL, API as a pass-through layer and analysis in the API client) are organized as separate entities. This organization method ensures not only the sequestration of code, but that computational resources are easily partitioned and allocated. The upshot of this structure is that an organization could host a met-db and met-api install and utilize grid computing for met-analysis. The implementation of met for this project was deployed on Amazon Web Services Relational Database Service on a db.r4.2xlarge instance. The component met-api, written in Perl using the Dancer framework, was deployed via docker containers to a t3.large instance. The component met-analysis, written in Julia, was run on the Notre Dame Center for Research Computing servers using minimal memory.
Conclusions
met is designed to allow for comprehensive analysis of metabarcoded datasets, either in pair-wise comparison of datasets or for the search of specific taxa. This functionality allows for the location of any unique sequence in all previously published metabarcode data. met is adaptable for commonly used microbiome barcodes (i.e. 16S and 18S) and eDNA barcodes (i.e. Internal transcribed spacer (ITS), Cyclooxygenase 1 (COX-1), and Mitochondrially Encoded NADH:Ubiquinone Oxidoreductase Core Subunit 2 (ND2)). Furthermore, multiple genes can be utilized in the same instance of met, meaning that nonspecific shotgun metagenome approaches could be utilized with met. met’s scaling ability is achieved through a scaling web server pool, as well as possible database sharding. met works via met-analysis interacting with met-api and in turn, met-api interacts with met-db (see: Figure 1, Panel D).
While the specific results from our example generating ASV abundance curves from geographically disparate locations are largely confirmatory, met itself has proven to be an efficient tool for analysis. When the ‘Conservation in a Cup of Water’ paper was first published, the authors were thinking about how biodiversity could be determined in a particular spot, at a relatively low cost. The next logical extension is to take advantage of the power gained by combining data from multiple experiments in this rapidly expanding field in new and interesting ways to increase data utility. This analysis is a way to increase data utility and combine metabarcode experiments. In met we have a way to computationally process large number of samples and we can compare them quickly and come back with useful output, demonstrating that met is a powerful tool for metabarcoding researchers going forward.
Acknowledgement
The authors would like to thank Prof. Micheal E. Pfrender, Natalie Meyers and Dr Matthew Sisk at the University of Notre Dame as well as Daniel A. Molik for his implementation advice.
Funding
This work was completed at the University of Notre Dame, Navari Family Center for Digital Scholarship, with resources from the University of Notre Dame Professional Development Zahm Research Travel Grant Fund, Amazon Web Services Cloud Credits for Research, and Oracle for Research (CPQ 214706).
Conflict of interest.
None declared.
Data availability
All codes are published under the Mozilla Public License ver 2.0 on the met project page: doi.org/10.17605/OSF.IO/SPB8V.
