


Abstract
Compositional bias (i.e. a skew in the composition of a biological sequence towards a subset of residue types) can occur at a wide variety of scales, from compositional biases of whole genomes, down to short regions in individual protein and gene–DNA sequences that are compositionally biased (CB regions). Such CB regions are made from a subset of residue types that are strewn along the length of the region in an irregular way. Here, we have developed the database server LPS-annotate, for the analysis of such CB regions, and protein disorder in protein sequences. The algorithm defines compositional bias through a thorough search for lowest-probability subsequences (LPSs) (i.e., the least likely sequence regions in terms of composition). Users can (i) initially annotate CB regions in input protein or nucleotide sequences of interest, and then (ii) query a database of greater than 1 500 000 pre-calculated protein-CB regions, for investigation of further functional hypotheses and inferences, about the specific CB regions that were discovered, and their protein disorder propensities. We demonstrate how a user can search for CB regions of similar compositional bias and protein disorder, with a worked example. We show that our annotations substantially augment the CB-region annotations that already exist in the UniProt database, with more comprehensive annotation of more complex CB regions. Our analysis indicates tens of thousands of CB regions that do not comprise globular domains or transmembrane domains, and that do not have a propensity to protein disorder, indicating a large cohort of protein-CB regions of biophysically uncharacterized types. This server and database is a conceptually novel addition to the workbench of tools now available to molecular biologists to generate hypotheses and inferences about the proteins that they are investigating. It can be accessed at http://libaio.biol.mcgill.ca/lps-annotate.html.
Database URL:http://libaio.biol.mcgill.ca/lps-annotate.html
Introduction
Development of tools for automated biological-sequence annotation is imperative, particularly since now greater than 1500 complete genomes have been sequenced and assembled. One important problem is the comprehensive annotation of compositionally biased (CB) regions in biological sequences. CB regions are sequence stretches with a large fraction of a small subset of residue types. If the CB regions are biased for multiple amino-acid residue types that are strewn along the sequence in an irregular way, the boundaries of these regions can be difficult to define. A well-known CB case arises in the yeast prions, which tend to contain CB regions made from glutamine and asparagine residue types (1). Other examples include the arginine-/serine-rich regions in some RNA-binding proteins (2), and the proline-rich domain of the transcriptional-complex protein Ssdp1, which is responsible for transactivation and is found in other diverse contexts (3).
A specific type of CB region is the ‘intrinsically disordered’ (ID) protein or domain. ID regions lack a globular 3D structure, and are unfolded in their native states (4,5). Work on disordered-region annotation has been extensive, with several algorithms being developed (5–10). ID proteins can function in signalling and regulation, and are associated with post-translational modifications, such as phosphorylation sites (5,11,12). The link between ID and CB regions, and simple repetitive regions has been demonstrated, with CB regions of a certain degree of disorder having distinct compartmentalizations and functional category tendencies (13–15).
Several algorithms have been derived previously to annotate CB regions, with the primary goal of ‘masking’ such regions before sequence alignment, to avoid incorrect inference of homology [e.g. SEG, (16); and CAST (17)]. To facilitate the automated annotation of all possible CB regions, we have developed a server, called LPS-annotate (LPS stands for Lowest Probability Subsequence; see the algorithm summary below for further details). This algorithm annotates CB regions in both protein and nucleotide sequences. Previously, we reported the development of this algorithm for the exhaustive assignment of CB regions (1,14,18). The chief novelty of this procedure is that CB regions of multiple amino acid residue types can be assigned thoroughly and completely, with clearly optimized boundaries.
Here, we report the development of a server and an on-line database of annotations that is based on the latest development of this algorithm. First, the server can be used to apply the LPS algorithm to annotation of both protein and nucleotide sequences. Second, after determining the biases in a sequence, a database of greater than 1500 000 pre-calculated CB regions and regions of predicted protein disorder (PPD) can be queried for regions of the same type and protein disorder content, for investigation of further functional hypotheses and inferences. In the database portion of the website, CB region annotations have been pre-calculated for the Uniprot/SWISSPROT database (19). CB annotations are cross-referenced with default SEG annotations of low-complexity regions (16), and also with predictions of disordered regions in proteins [made using DISOPRED2 (20)].
Methods
LPS algorithm
To calculate biases derived from any number of residue types thoroughly for a given protein sequence, the following iterative process is performed. Pmin values are calculated for any set of amino acids {xyz…}, by summing up the number of residues over the whole residue-type set. However, biases are only picked in preference over a previously calculated bias made by a smaller number of residue types, if their Pmin-values are smaller. The set of residue types contributing to the bias (sorted in decreasing order of their original Pmin values), is defined as the ‘CB signature’. The iterative procedure is performed until convergence. Using this procedure, regions that comprise mild bias for multiple residue types can be detected as significantly biased. Further details of the algorithm are given on the help pages of the server [and in (14,18)].
Data analysed
The algorithm was run on the complete UniProt/SwissProt and UniProt/TrEMBL databases from July 2009 (19). The CB regions in the database are given a ranking, with the most biased (smallest P-value) being given a ranking of 1, and others given higher rankings.
Use of the database
The database can be used in a two-step process:
LPS-annotate server: assignment of CB regions in a query sequence (either protein or nucleotide sequences);
Database of pre-calculated CB annotations for UniProt: searching the database of pre-calculated CB regions for functional inferences (this is, of course, for protein sequences only).
LPS-Annotate server
The LPS-annotate server can annotate both protein and nucleotide sequences for CB regions. Users can paste the input sequence into the query box provided, and select values for Wmin, Wmax and S (step size). A screenshot of an example of the output of this server is illustrated, for a glutamine-/histidine-rich protein (Figure 1). A help page is provided, which explains the functioning of the server, including recommended values for Wmax and Wmin. Typically, if a smaller Wmax is used, there are two effects on the CB region annotations: (i) longer CB regions are broken up into shorter stretches (of up to approximately the size of Wmax); (ii) subsidiary mild biases that can only be detected with longer window sizes are not considered. Thus, it is generally advisable to use the largest Wmax (= 500 residues length).
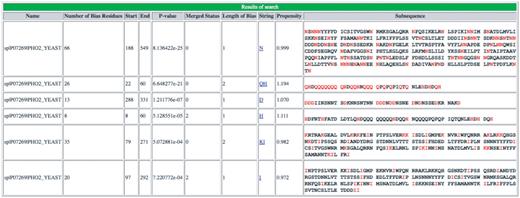
Screenshot of output of initial server portion of database. An example of the initial LPS-annotate program server output for the example PHO2, from budding yeast (P07269, PHO2_YEAST).
As shown in the Figure 1 example, for each CB region, the server output displays: (i) the protein name; (ii) the number of bias residues (i.e. those residue types that define the bias); (iii) the start and end points of the CB region; (iv) the CB region’s binomial P-value; (v) the CB signature; (vi) the mean disorder propensity for the CB region (calculated as described in ‘Methods’ section); (vii) the CB region subsequences. Other fields in the output are explained in the downloadable Help page. A link to ‘Download’ the data is given at the bottom of the page.
Database of pre-calculated CB annotations for UniProt
We have supplied a database of CB-region annotations for proteins in the June 2009 version of the Uniprot/SWISSPROT protein database (19). These were made using the parameter settings for the LPS algorithm (Wmin = 25, Wmax = 500 and S = 1). The annotations in the database are cross-referenced with: (i) low-complexity regions identified with SEG (16) (run with default settings); (ii) predictions of disordered regions made with the program DISOPRED2 (run with default settings) (20). It is important to note here that the default settings for the SEG program are designed for sequence masking as a prelude to sequence alignment, not for the annotation of compositional biases, which is the purpose of the presently described algorithm, LPS-annotate.
The database can be searched in three ways: (i) with a Uniprot/SwissProt identifier; (ii) with a CB signature; or also (iii) with a sequence, through a BLAST search interface (23). The CB-signature search capability is particularly useful for finding regions of similar compositional bias and protein disorder content. Such similar regions may help infer functional linkages or hypotheses, in a sequence that was initially input into the LPS-annotate server. In the output for each database search, a list of CB regions in increasing order of binomial P-value is given (each with a link to the complete Database entries for each CB region) (Figure 2). Each CB-region name is a live link to the individual Database entry of the CB region (Figure 3). At the bottom of the page, a ‘Download’ link is provided, so that the user can download the list of similar CB regions (Figure 2).
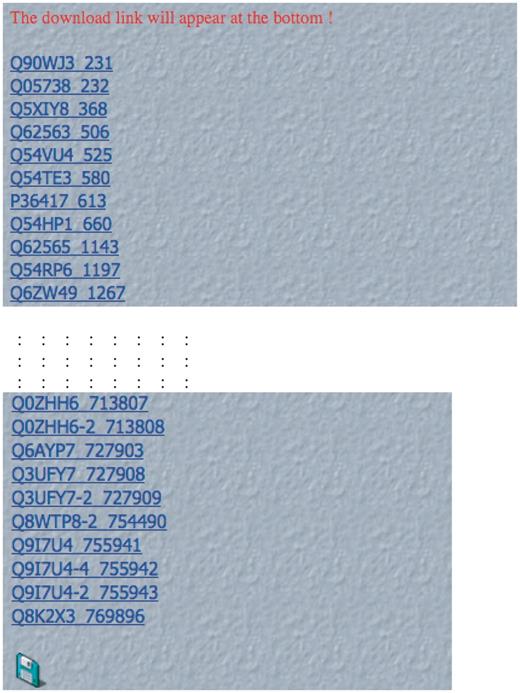
Screenshot of initial output after database search. An example of the initial LPS-annotate Database output for the search for bias type ‘QH’. Each CB region is a live link in the depicted list. The download link for the data is at the bottom of the page.
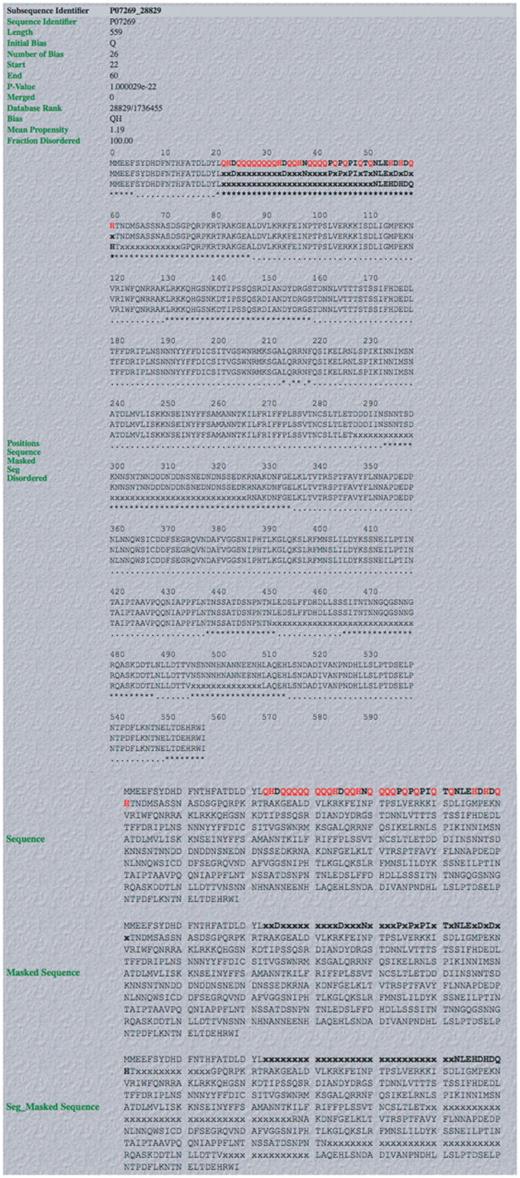
Screenshot of example of output from database. An example of a complete LPS-annotate Database entry (as described in the main text, and in the downloadable Database Help page). This is for the QH region from PHO2 of budding yeast.
An example of the individual database entry display for the glutamine/histidine-rich (QH-rich) region in PHO2 from budding yeast, is illustrated (Figure 3). PHO2 is a regulator in phosphate metabolism that contains a homeobox DNA-binding domain, and acts as a derepressor of PHO5, another central regulator. It binds to the upstream activator sequence of PHO5, and the promoters of TRP4, HIS4 and CYC1. The database entry contains the following useful information: (i) the subsequence identifier, a unique identifier for the subsequence in the UniProt/SwissProt sequence that is compositionally biased; (ii) sequence accession number; (iii) the initial bias used to build the CB region (in this case = ‘Q’); (iv) the number of residues in the CB region defining the bias; (v) the start and end points of the CB region; (vi) the binomial P-value for the CB region; (vii) the rank of the CB region in the database; (viii) the CB signature (in this case = ‘QH’); (ix) the mean protein disorder propensity (if >1.0, this indicates that the region on average has a propensity to protein disorder); (x) the proportion of the CB region that is disordered, according to the disordered region assignments made with the DISOPRED2 algorithm (in this case it is 100.0%). Other database entry fields are described on the ‘Help’ page.
Below this list of information are displays of the sequence with the CB region in bold (and the bias-defining residues in red bold) (Figure 3). PPD (predicted using the DISOPRED 2 algorithm, see ‘Methods’ section) is indicated by asterisks (Figure 3).
The database and server for LPS-annotate is available at //libaio.biol.mcgill.ca/lps-annotate.html. A link is provided on the web page to download the complete database of annotations for both UniProt/SwissProt and UniProt/TrEMBL (July 2009 versions).
Using the LPS-annotate Database to search for similar CB regions in other proteins
The chief utility of the database is to find proteins with similar CB regions, to yield a list of proteins of use for further functional hypotheses and inferences. For example, take the sample sequence PHO2 from budding yeast. First, we can determine the CB regions in PHO2 using the LPS-annotate Program Server; the most obvious biased region in PHO2 is the ‘QH’-rich region which is predicted to be 100% protein disorder by the program DISOPRED. Second, we can either: (i) click on the links given in the LPS-annotate Program Server output to obtain lists of similar biases in the LPS-annotate Database or (ii) type the biases of interest into the query box for the LPS-annotate Database Server, and proceed with downloading, from there. The output to download comprises a list of similar CB regions in other proteins, including the complete sequence of the CB regions within these other proteins. After download, this list of proteins can then be further examined bioinformatically by the user in a manner of his/her choosing, e.g. for shared globular protein domains elsewhere in the sequence, sequence motifs, cellular co-localizations and functional linkages [as specified, for example, by the Gene Ontology classification (25)].
Comparison of LPS-annotate Database to existing CB annotations in UniProt
We have substantially augmented the annotations of compositionally biased regions in the UniProt database, which are intentionally limited in the UniProt/SwissProt databases to a few, more specific cases, such as homopolymeric runs, with up to one or two short interruptions in the run (26). Here, we have generated more than 23 000 000 CB-region annotations for the UniProt/TrEMBL database, and more than 1 500 000 CB annotations for UniProt/SwissProt. Original CB-region annotations in UniProt number approximately 43 000 (‘FT COMPBIAS’ records); all of these are for the SwissProt portion of UniProt. We have compared these COMPBIAS feature annotations with our new annotations (Figure 4). For binomial P ≤ 10−6, the new CB annotations (blue column) overlap ∼20% of the COMPBIAS records (to within five residues at either end point). A further breakdown of these overlapping CB annotations is given in some pie charts in Figure 5.
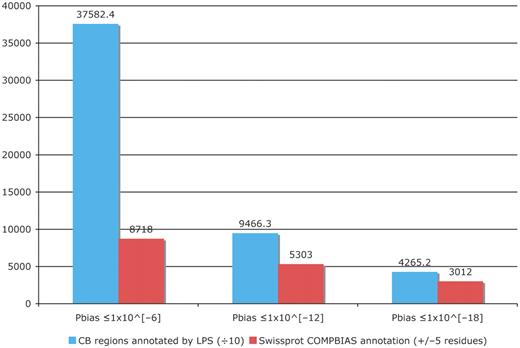
Column chart showing the augmentation of existing COMPBIAS annotations in UniProt, using the LPS algorithm. The blue column shows the number of CB regions annotated with the LPS-annotate algorithm, for three different P-value thresholds (10−6; 10−12; 10−18). The red columns are the existing UniProt COMPBIAS records that overlap the new LPS-annotate annotations (±5 residues at either end of the regions). The UniProt COMPBIAS records are intentionally limited in the UniProt/SwissProt databases to a few, more specific cases, such as homopolymeric runs, with up to one or two short interruptions in the run (26).
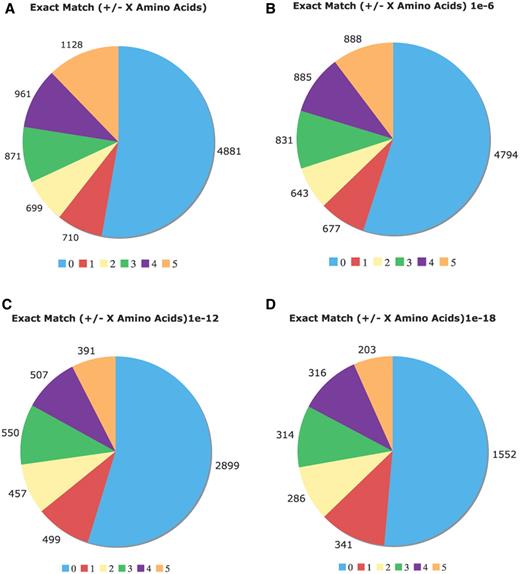
Comparison of the Uniprot COMPBIAS annotations with annotations by the LPS algorithm. Pie charts showing the detailed breakdown of how the new LPS-annotate CB annotations correspond with the UniProt COMPBIAS annotations, for four different P-value thresholds (10−4, i.e. all of the LPS-annotate CB annotations; 10−6; 10−12; 10−18). These are depicted in Figure parts A, B, C and D respectively. Annotations that are exactly matching are colored blue, those that are off by one at either end are colored red and so on. The UniProt COMPBIAS records are intentionally limited in the UniProt/SwissProt databases to a few, more specific cases, such as homopolymeric runs, with up to one or two short interruptions in the run (26).
The CB-region annotations also do not have a simple correspondence with PPD. After removing CB region annotations corresponding to globular domains and transmembrane domains (Figure 6), there are a large number of CB regions without an overall tendency to protein disorder. For example, in Figure 6, for binomial P ≤ 10−6, ∼21% of the CB regions (approximately 78 000 in number) have disorder propensity less than 1.0, indicating a cohort of CB regions that are potentially uncharacterized biophysical types, e.g. functional amyloids (27).
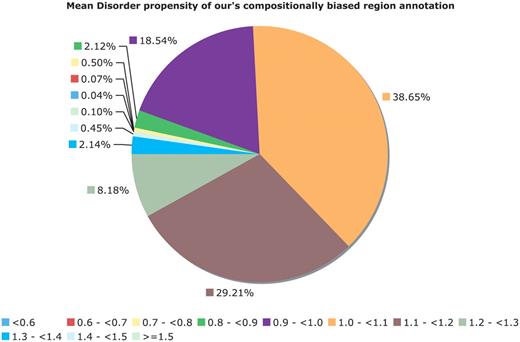
Mean disorder propensity of the CB regions. This is a pie chart for the mean disorder propensity of all CB regions with P < 10−6, with any CB regions that correspond to globular or transmembrane domains removed. The mean disorder propensity is calculated as described in ‘Methods’ section.
Conclusions
This server and database is a conceptually novel addition to the panoply of tools now available to molecular biologists to generate hypotheses and inferences about the proteins that they are investigating. Furthermore, large-scale analysis of cohorts of proteins with specific compositional biases and disorder propensities is made tractable by our analysis. The database of CB annotations is updatable at regular intervals.
Funding
This research was funded by the National Science & Engineering Research Council, Le Fonds québécois de la recherche sur la nature et les technologies, and McGill University. The open access publication charge is paid by Le Fonds québécois de la recherche sur la nature et les technologies.
Conflict of interest. None declared.
