


Abstract
The RCSB Protein Data Bank (RCSB PDB, www.pdb.org) is a key online resource for structural biology and related scientific disciplines. The website is used on average by 165 000 unique visitors per month, and more than 2000 other websites link to it. The amount and complexity of PDB data as well as the expectations on its usage are growing rapidly. Therefore, ensuring the reliability and robustness of the RCSB PDB query and distribution systems are crucially important and increasingly challenging. This article describes quality assurance for the RCSB PDB website at several distinct levels, including: (i) hardware redundancy and failover, (ii) testing protocols for weekly database updates, (iii) testing and release procedures for major software updates and (iv) miscellaneous monitoring and troubleshooting tools and practices. As such it provides suggestions for how other websites might be operated.
Database URL:www.pdb.org
Introduction
The RCSB Protein Data Bank (RCSB PDB) (1) is a member of the worldwide PDB (wwPDB) (2) and one of its data distribution sites. In 2009, the website (www.pdb.org) was used by an average of 165 000 unique visitors each month who viewed 12.7 million web pages and downloaded nearly one terabyte of data via HTTP. In addition, data were being downloaded from the RCSB PDB via FTP and rsync at a rate that averaged more than seven files per second over the course of the year and nearly 87 files per second during the single busiest day. A recent analysis showed that over 2000 other websites provide links to the RCSB PDB website. Given the apparent importance of RCSB PDB services to the structural biology community and related scientific disciplines, we need to ensure quality of service. This article is about providing such quality of service.
Concurrently, the size and complexity of the PDB are ever increasing. The number of structures in the PDB has roughly doubled in the last 5 years, and the RCSB PDB website bandwidth (the amount of data transferred) has almost doubled in the last 3 years. The growth in content accelerates over time: about 50 new structures were released per week in the year 2000, now that rate has nearly tripled with close to 150 new structures each week. In addition, data growth is not merely quantitative, but the data are also becoming more complex. For example, very large structures such as ribosomes are now being released on a much more routine basis; there are more methods of determining structures and even cases where hybrid methods were used during a single structure determination.
User expectations are also rising. Increased network speeds and improvements in browser technology have raised the standards of ‘acceptable’ website performance. Data are also accessed through an increasing number of protocols and services: 10 years ago FTP and HTTP were the only online services offered (we also had CD-ROM distributions); now, in addition, rsync, web services using SOAP or RESTful protocols and RSS feeds are offered. Users increasingly expect Web 2.0 type functionality implying social bookmarking, video and other services. Similarly, smart cell phones and other mobile devices constitute a growing number of clients.
To meet the growing scientific expectations, significant feature enhancements continue to be added (3) such as pair-wise and all-against-all structural alignments (4) and the integration of open access literature (5). Structure visualization is becoming more sophisticated, for example, with regards to viewing extremely large structures or protein–ligand interactions. There are higher expectations for integration with other web resources and for the enablement of workflow solutions rather than simple data downloads. In summary, growth, complexity and user expectations speak to the challenge of keeping up with quality assurance.
Regardless of these specific challenges, quality assurance in information technology is generically a difficult problem. Why is that so? There are many components to quality assurance when maintaining a website, as we shall see, but perhaps the most readily identified issue is software testing. Whitaker explored the question of why software testing is hard (6). Among the reasons he offers are software complexity, nearly infinite variations of usage scenarios, many different user interfaces and operating environments and a lack of time and resources to test everything. Of course, quality assurance is much more than testing (7). While testing might be seen as a quality control measure to detect problems—so that they can subsequently be corrected—quality assurance is also concerned with preventing problems in the first place. Furthermore, running a biological database and website obviously involves both hardware and software, and both aspects will be addressed in this article.
PubMed searches show that the literature on quality assurance for biological databases and associated websites is relatively sparse. A number of publications have examined the quality of biological data (8–12). However, few publications describe the quality of services that allow data to be accessed and explored. A survey of quality assurance practices in biomedical open source projects (13) focused primarily on software testing and peer review. There is, of course, a much larger body of literature on software quality assurance in the computer science field, including for example an entire journal dedicated to the subject, the Software Quality Journal (www.springerlink.com/content/0963-9314). However, much of this literature is not indexed in PubMed, and therefore less accessible to the bioinformatics community.
This article is not about quality assurance of PDB data, since this has been described extensively elsewhere (14–16). Instead, we describe here the practices we use to assure the quality of services associated with distributing and querying these data. In the major sections that follow in this article, we address several areas of quality assurance at the RCSB PDB: (i) hardware redundancy and failover; (ii) weekly database updates; (iii) software releases; (iv) monitoring and troubleshooting tools and practices. As the number of biological web resources continues to grow at a rapid rate, and some projects mature in relevance and prominence, it is our hope that this case study of quality assurance at the RCSB PDB website will be helpful to other biological databases and websites in developing or expanding their own set of ‘best practices’.
Redundancy and failover
Here, we focus our attention on the hardware and software that host and provide critical RCSB PDB services such as the database, website and FTP site. It is only common sense that for any single piece of infrastructure the question is not if it will fail, but when. Such failures might be physical equipment breakdowns (e.g. a hard drive or motherboard) or interruptions of services running on the hardware (e.g. a hung Apache Tomcat process serving the website). Should such a failure result in the interruption of a critical production service, we need to provide redundant solutions, along with the logistics to manage failover from a failed piece of hardware or software to a working one. We strive for 100% uptime regardless of maintenance needs, planned or unplanned power outages, database or software updates, natural disasters, etc., and realistically achieve better than 99.9% uptime. We utilize multiple layers of physical and logistical redundancy to achieve this goal.
Multiple levels of hardware redundancy
The live website (www.pdb.org) and FTP site (ftp.wwpdb.org) are served by multiple load balanced servers at any one time. The reasons not only include the aforementioned need for redundancy, but also the fact that a single server might not be able to sustain peak traffic loads. The website is normally served by five Dell PowerEdge 2950 servers, each with two quad core 2.66 GHz Intel Xeon processors and 32 GB of RAM. The FTP site is served by three Dell Power Edge 1950 servers, each with two quad core 2.5 GHz Intel Xeon processors and 8 GB of RAM.
The eight servers as just described constitute the live production cluster that is hosted in the machine room of the San Diego Supercomputer Center (SDSC) at the University of California, San Diego (UCSD). Two smaller clusters are maintained in two separate physical locations (consisting of two web servers and one FTP server each). One such cluster is maintained at the Skaggs School of Pharmacy and Pharmaceutical Sciences (SSPPS) at UCSD, the other one on the campus of Rutgers University in New Jersey. These clusters can provide failover services during maintenance or power outages at SDSC, or in case of a catastrophic disaster that might affect one or both of the UCSD locations (Figure 1). A second SDSC cluster, identical in configuration to the live production cluster, primarily serves for advanced staging of weekly updates, and would only be used for failover in the most extenuating circumstances.
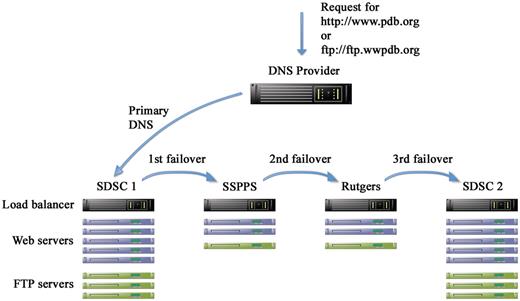
Schematic representation of hardware redundancy and DNS failover. There are four clusters in three separate geographical locations: San Diego Supercomputer Center (SDSC) and Skaggs School of Pharmacy and Pharmaceutical Sciences (SSPPS), both at the University of California, San Diego (UCSD), and Rutgers, the State University of New Jersey. Each cluster contains multiple load balanced Web and FTP servers. A third party DNS provider is used to manage the DNS entries for the website (www.pdb.org) and the FTP site (ftp.wwpdb.org) including failover in case the primary cluster fails.
In addition, there is yet one more level of redundancy of serving PDB data in its most fundamental form: the distribution of the PDB archive via FTP is duplicated at the PDB Europe (PDBe) and the PDB Japan (PDBj), according to the charter agreement of the wwPDB (2).
Load balancer
Each of the two SDSC production clusters is managed by a single Cisco CSS 11506 load balancer. The two load balancers are configured to automatically take over from each other in case one of them fails. Incoming traffic is distributed round-robin between the servers in the cluster. Sticky session management guarantees that all traffic received from the same IP address within a certain amount of time is directed to the same server which facilitates some website usage such as query refinements and paging through results. Once every 30 s, the load balancer probes the services of machines in the pool with ‘keep-alive’ tests. For HTTP services, this involves requesting a special web page that performs a database query, so that the successful return of this page confirms that the Tomcat web server and the MySQL database are operational. For FTP services, the load balancer attempts an anonymous FTP login, and for rsync it pings the port.
When a keep-alive test of a particular service fails three times in succession, the load balancer removes the server in question from the active pool and sends a notification to email addresses and pagers (cell phones) of several RCSB PDB staff members. Traffic to the failed server is reassigned to other servers in the pool. For most practical purposes, this failover is transparent to the user apart from the delay necessary to detect persistent failure and remove the affected server from the pool (up to 2 min). For example, a unique identifier and description of the user's most recent query on a web server is shared in memory via memcached (www.memcached.org) between all servers in the pool. This allows such operations as query refinements or moving to the next page of query results even if the user's traffic has failed over from one server to another. Once the staff has investigated the failure and restored the service to a healthy state (or the service has recovered on its own), the load balancer will automatically add the server back into the active pool following the first successful keep-alive test.
DNS management and failover
DNS management and failover for critical production services (HTTP, FTP, rsync) are outsourced to a third party DNS provider. Active failover records consist of prioritized lists of IP addresses for each service which point to the load balancers of the four clusters in the following order: primary SDSC production cluster, backup cluster at SSPPS, backup cluster at Rutgers University and finally the backup SDSC production cluster (Figure 1). Weekly data updates are released to the public at 00:00 UTC on Wednesdays in a coordinated fashion between the wwPDB partners. The RCSB PDB starts this weekly update internally on the previous Friday to allow sufficient time for running all components of the update (including, for example, about 1 million structure alignments), appropriate testing (as described in the next major section) and resolution of any contingencies. In order to make the update live to the public, the DNS failover records are edited to switch the primary and backup SDSC clusters. This serves the purpose of instantly making live an update that is well tested (as described below), without the risk of publicly exposing an incompletely updated resource or data with untested integrity.
Every 2 min, the DNS provider also checks from multiple locations in the USA whether a test page is successfully returned from each of the clusters. When it is not, the status of that cluster is changed to ‘failure’. Any web server that is in the process of running the weekly update is automatically removed from public service and its traffic is redirected to a specified peer. Hence, this ‘failure’ of clusters being updated is expected. This situation only applies to backup clusters in the failover stack, and the DNS provider sends just a notification of the event. However, when a failure of the active cluster is detected, the DNS record is switched to the next available cluster in the failover stack. This might happen, for example, because of a networking problem affecting traffic to the primary cluster, or because the load balancer of the primary cluster has detected problems with all servers in its cluster, hence removing all of them from the pool. Notifications are sent to key staff members via email and cell phone text messages to alert them of the DNS failover. As soon as the primary cluster has become active again, DNS is automatically switched back to the primary cluster.
Failures of individual servers, as described in the previous section, are relatively common and may occur weekly. Strictly speaking, though, such ‘failures’ in many cases merely represent server performance that has fallen below acceptable levels, at which point it is taken out of the cluster until the problem has been resolved. On the other hand, a DNS failover due to failure of an entire cluster has not occurred for the past several years.
Weekly database updates
Every Wednesday at 00:00 UTC, a weekly data update of new and modified entries is released to the public on the web and FTP sites. The timely and accurate distribution of these data updates is one of our most mission critical tasks. Over the past 10 years, the RCSB team has maintained a near-perfect record of meeting the published deadline for updating the site. The sole exception was one week when the update was internally completed, but a mistake in changing the public DNS entries went undetected for several hours past the deadline, resulting in the update not being visible to the public on time. Additional testing procedures were put in place to prevent any recurrence. In the next sections, we describe the procedures followed to consistently ensure the timely execution and delivery of these weekly database updates.
Synchronization and testing of data archives
Weekly updates of new and modified entries are prepared by RCSB PDB staff at Rutgers University on Fridays. As part of this process, internal master copies of the public FTP archive and the so-called ‘sandbox’ are updated. The sandbox is another view of the archive that is only used for internal update purposes, with practically the same content as the public FTP site, but organized differently.
Following the update of the FTP and sandbox master copies, propagating it to the public sites is in the hands of the RCSB PDB staff at UCSD. Tasks that include synchronizing various copies of FTP and sandbox archives and running the weekly updates on the database/web servers are performed on a total of 26 servers in four clusters over the course of the week. To reduce tedium and the possibility for human error, all of these processes are launched from one central server, which then sends the necessary commands over ssh connections to the appropriate sets of servers. FTP and database updates of the four clusters are staggered throughout the week to balance the needs for advanced staging of updates and the availability of failover clusters matching the content of the live cluster (Figure 2).
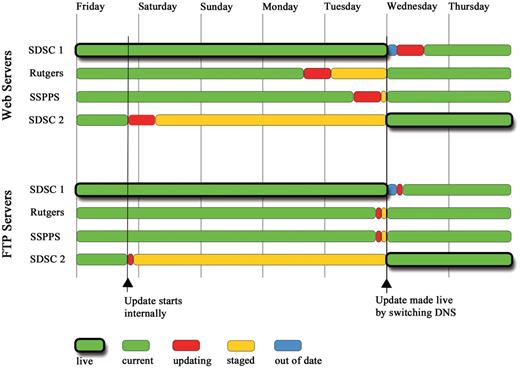
Staggered weekly update schedule of the Web and FTP servers. The overall aim is to balance the need for advanced staging of the update (red and orange) with as much failover to current data (green) as possible at any given time. The update cycle begins on Friday with the second SDSC cluster (SDSC 2). Two more clusters are updated on Monday and Tuesday. On Wednesday at 00:00 UTC, the update is made public by switching the DNS entry between the two SDSC clusters (thick outlines). A few hours are allowed for the DNS change to propagate until the update on the final and now out of date cluster (blue) is started. Green with thick outlines shows “live” clusters serving data to the public. Other clusters in green have the same current content. Clusters in red are being updated. Orange denotes a cluster with a finished update that contains “staged” data not yet available for public release. Blue shows a cluster whose data are out of date compared with the live public site.
First, all sandbox servers (since they are only used internally) and the FTP servers of the backup SDSC cluster are synchronized to their respective master copies via rsync. Rsync is first run in silent mode, recording to a log all changes that would have occurred, without actually making any of those changes. A Python script then analyzes this silent rsync log to ensure the integrity of the weekly update. By referencing separate lists of new and modified files, these integrity checks answer such questions as ‘Would the rsync have transferred all expected files for new and modified PDB IDs?’ and ‘Would no unexpected files have been modified?’ If all tests pass, the rsyncs are repeated in live mode. Another validation script then checks the total holdings: ‘Does the previous count of entries, minus obsolete entries, plus new entries, add up to the new count?’ ‘Is this count consistent between the internal sandbox and various directory paths of the public FTP site?’
Selenium test suite
The next step of the weekly update procedure is to run a database update on each of the web servers of the backup SDSC cluster (this is repeated on the other three clusters over the following few days). The details of this database update are beyond the scope of this article. Briefly, the structure files in mmCIF format (17) of all new and modified entries are parsed and loaded into the database, derived data are calculated and related content from several dozen external databases is imported. Problems with any of the more than 50 loader classes are logged in the database and emailed to staff.
A new software build is created from a stable production branch of the software and deployed to the updated web servers. While this update may occasionally contain critical bug fixes, changes in site functionality on the production site are generally reserved for carefully orchestrated software releases as described in the next section. News items and other so-called static web content are now maintained in a separate content management system (CMS) that was developed in-house. This further diminishes the changes in the deployed builds and thus contributes to the stability of the production site's software.
A key piece of quality assurance for the weekly data updates is an extensive Selenium test suite. Selenium is a suite of tools for testing web applications (seleniumhq.org). Selenium IDE, one of the Selenium projects, is a plug-in that runs in the Firefox web browser. It records and replays tests of any website in Firefox. We have developed an extensive suite of tests for the RCSB PDB website containing over 1300 steps (‘go to this URL’, ‘click this link’, ‘enter this search term’, ‘wait for the page to return’, etc.). Of these, more than 350 commands are assertions or verifications such as ‘does the page contain certain text?’, ‘does a number on a page match a number previously stored during the test?’, etc. (Figure 3). Test coverage of site functionality was primarily decided based on site usage as indicated by AWStats log analysis and Google Analytics traffic analysis.
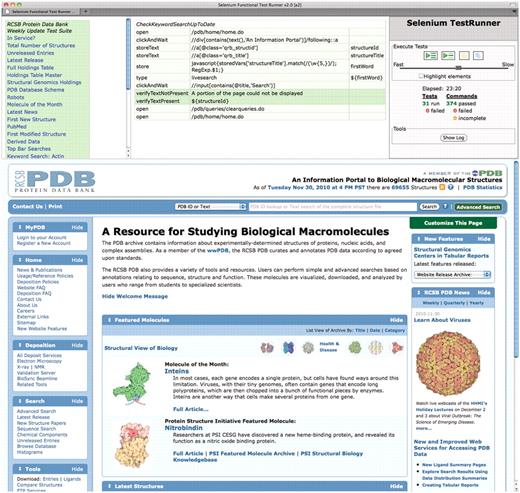
Screenshot of fully executed Selenium IDE test suite in a Firefox browser. We have developed an extensive suite of testing scripts with several goals such as checking key elements of the user interface, verifying the integrity of the weekly update, and comparing results between multiple servers. The top-left panel shows the list of test scripts. The top-middle panel shows as an example the script for verifying that keyword searches are up to date. It selects the first entry ID from the weekly release, extracts a keyword from its title, and then performs a search for this keyword and asserts that the search results include the given entry ID. The top-right panel contains the controls for executing tests and shows the test results. The bottom panel is a regular browser window that shows the web pages being loaded by the scripts.
This test suite is run on every web server of every cluster after it has been updated. The suite has several overall goals. It tests key elements of the user interface, such as keyword searches and structure summary pages for a single entry. It checks the integrity of the weekly update, for example, by asserting that the total number of structures returned on the website matches the holdings in the FTP archive. Furthermore, it ensures that each server in a load balanced cluster returns the same results for a number of queries by comparing the results from the server being tested to that of a dedicated master server. Once the public DNS entries have been switched to make the update live, another shorter Selenium test suite is run against the public URLs (rather than individual servers), simply to ensure that the public site has been successfully updated.
Software releases
Another major target of quality assurance is the software that powers the RCSB PDB website. Written in Java, it consists of over 2000 classes with roughly 200 000 lines of source code. The RCSB PDB staff at UCSD maintaining the site currently consists of eight full-time employees, of which half are full-time developers, and the other half divide their time between development, project management and system administration. New software versions with major new features are released on the production site about four times a year. This is a medium-sized software project with enough complexity to make good software practices a considerable yet essential task. This section contains short descriptions of the tools and practices used to monitor code quality and site performance and to ensure the stability of new software releases.
Code maintenance
All code is kept in a Subversion (subversion.tigris.org) version control repository. Each programmer has at least one development clone running the latest trunk version of the code. Code development is performed in the Eclipse (eclipse.org) integrated development environment. New feature requests, as well as bug reports and other tasks are logged in a private JIRA bug tracker (www.atlassian.com/software/jira/) that is intended for RCSB PDB staff use only. The resolution of a JIRA ticket by one programmer is verified by a second developer before the issue is closed. If a bug report or feature request came from an outside user, an email is sent to the user to describe the action that was taken. Subversion check-ins are linked to JIRA ticket numbers which is helpful in evaluating and tracing code changes.
Questions sent to the electronic help desk are also automatically logged, and manually linked to bug reports where appropriate. We prefer receiving this feedback through the Contact Us web form (www.pdb.org/pdb/home/contactUs.do). It helps reduce spam, but more importantly it automatically provides us with the results of a browser compatibility check, which states the browser version and confirms proper JavaScript, cookies and popup settings. There is also a direct link to this browser compatibility check on the home page.
Programmers are strongly encouraged to use a number of available tools to ensure clean code. The tools most commonly used by the RCSB PDB website developers are listed in Table 1.
Code maintenance and troubleshooting tools most commonly used by RCSB PDB website developers
| Software tool | URL | Description |
|---|---|---|
| Code maintenance tools | ||
| JUnit | junit.org | Java unit testing framework |
| TestNG | testng.org | ‘Next Generation’ Java testing framework |
| FindBugs | findbugs.sourceforge.net | Program for finding bugs in Java code |
| FireBug | getfirebug.com | Firefox extension for web development |
| UCDetector | ucdetector.org | Eclipse plugin for finding unnecessary Java code |
| Troubleshooting tools | ||
| JConsole | download.oracle.com/javase/6/docs/technotes/tools/share/jconsole.html | Java monitoring and management console |
| LambdaProbe | lambdaprobe.org | Tomcat monitoring and management tool |
| jstack | download.oracle.com/javase/6/docs/technotes/tools/share/jstack.html | Java utility for monitoring stack traces |
| jmap | download.oracle.com/javase/6/docs/technotes/tools/share/jmap.html | Java utility for monitoring memory utilization |
| hprof | java.sun.com/developer/technicalArticles/Programming/HPROF.html | Java utility for heap and CPU monitoring |
Every night, a dedicated build machine automatically checks out the entire project de novo from the source repository, builds it and deploys it on a web server. This helps detect code that does not compile, build or deploy properly (e.g. because some dependencies were not correctly checked into the code repository). A notice regarding the success or failure of this nightly build is emailed to all developers. Following the nightly build, a regression test suite written in Selenium RC is executed, and its results are also emailed. Selenium RC provides popular language wrappers (in our case Java) around the Selenium testing language, which adds a lot of flexibility over Selenium IDE, and greatly expands the scope of what it can accomplish.
Site performance
In addition to avoiding or fixing bugs, we also put considerable effort into optimizing the performance of the website. Performance enhancements can be achieved at a number of different levels, such as caching backend data access, compressing content delivered over the network and reducing web browser rendering times by optimizing CSS and JavaScript. The Firefox plug-in YSlow from yahoo.com (developer.yahoo.com/yslow) can be particularly helpful in website performance tuning. We also check performance from multiple clients around the world using website monitoring services such as host-tracker.com.
Apart from some content maintained in the CMS, data on the website are only subject to change with the weekly updates. Hence, many data objects or even entire pages can be stored in memcached (www.memcached.org), a distributed caching system. On the SDSC production clusters, memcached is allocated 32 GB of memory shared between eight servers. Following the Friday weekly data update, and prior to the public release of the new data at 00:00 UTC on Wednesdays, cached data objects and pages for every PDB entry are loaded into memcached by a seed script. Therefore, most data accessed by public users already reside in memory, which reduces database access and results in faster data delivery to the users.
To compare site performance between software releases, a load test script is run to request web pages for 2000 PDB entries. This script is run first without the use of memcached, and then again with data already seeded in cache. Performance is compared to the previous release, and any obvious degradation is investigated. Occasionally, other stress tests are run as well, such as simulations of many concurrent users performing similar queries. Recently, this was used to evaluate a new caching layer for queries.
Staging of software changes
The stability of the software running the production website is obviously of critical importance. Here we describe the processes used to control and test the roll-out of new software releases, which occur roughly quarterly.
Apart from occasional critical bug fixes, code changes are propagated from development to production in a carefully controlled fashion through multiple stages. Programmers develop new features and fix non-critical bugs in the code from the Subversion trunk. An automated nightly build provides a first check on compiling and deploying the latest code. When major new features are deemed stable enough for public testing, they are made available on a public beta server (betastaging.rcsb.org) with a disclaimer that this site may not behave the same as the production site.
The RCSB PDB team at UCSD periodically holds testing sessions to review newly developed features and to verify bug fixes. A few weeks prior to producing a new software release, staff at Rutgers University performs functional testing of the entire website with a focus on new features. After all serious issues reported in this latter testing session have been addressed, a new branch is created in Subversion, which becomes the next release candidate for the production site. At least one weekly data update is performed on a beta server with code built from the new production branch. The weekly Selenium test suite is updated as necessary to reflect any changes in site design and functionality.
Finally, during the first week of a new software release on the production site, only the two SDSC clusters are converted to the new build. The backup clusters at SSPPS and Rutgers University still run the previous release. In the unlikely case that a highly critical bug or performance problem is discovered only through public usage of the site, we can quickly fail back to the previous release by switching DNS to one of the failover clusters. The following week, assuming no serious issues surfaced, the remaining clusters are also converted to the new build.
Monitoring and troubleshooting tools
Even the best upfront efforts to ensure a high performance website with a minimal number of bugs do not eliminate the need for monitoring of hardware and software. Some monitoring and notification practices such as load balancer and DNS failover alerts have already been described. Here we outline additional tools used for monitoring and troubleshooting.
Monitoring tools
ServerStalker is a tool developed in-house to monitor the current hardware status of all production servers and the services they provide. In addition to simple ICMP ping tests to all servers, items monitored for web servers include the percentages of CPU and hard drive space used, the amount of RAM used by the Java process, the number of PDB entries and the status of the MySQL database. In addition, a summary of the update status is provided for each server and cluster to indicate whether they contain current data, are currently being updated or have a completed update staged for future public release. For FTP servers, a quick confirmation of the availability of FTP and rsync services is given. The overall goal of ServerStalker is to provide a quick glance at the current health of each production server. We intend to open source ServerStalker in the future.
In addition, we use Cacti (www.cacti.net) to graphically present status information gathered over time (Figure 4). Parameters such as internal and external traffic, CPU and memory usage, thread counts and Tomcat session counts are collected every few minutes and presented in graph form for each server or cluster. This is particularly useful for retroactively investigating server crashes or performance bottlenecks. For example, if a user were to report a complex query returning too slowly, Cacti might help in discerning where MySQL or Tomcat might have been the bottleneck at the time.
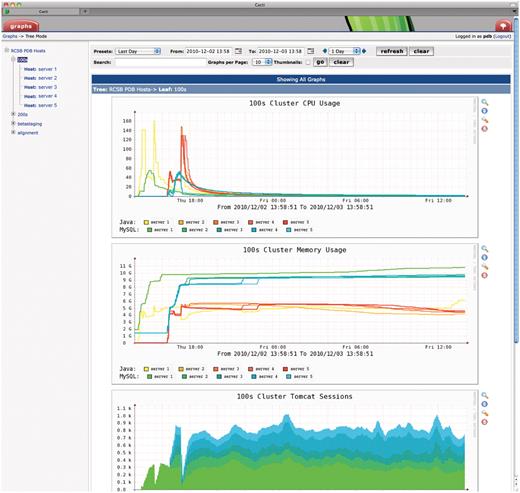
Screenshot of Cacti monitoring tool (www.cacti.net). Parameters such as internal and external traffic, CPU and memory usage, thread counts and Tomcat session counts are collected every few minutes and presented in graphical form for each server or cluster. The time window starts after the cluster had just been reinstalled with a new quarterly software release and shows the server load during successive Selenium tests on each server. Server names are redacted for security reasons.
Server logs, of course, need to be meticulously gathered and archived. Web, FTP and rsync logs are analyzed by AWStats (awstats.sourceforge.net) and website traffic is further analyzed by Google Analytics (www.google.com/analytics). Besides providing basic usage statistics, these analyses can also help discern usage patterns including the adoption of new features. However, a full discussion of such analyses is outside the scope of this article.
Troubleshooting tools
The RCSB PDB web application is complex enough that troubleshooting of bugs and performance problems can be quite involved. A host of tools are at our disposal to help with the process, depending on the nature of the problem.
For bug reports, the first step is to try to reproduce the issue. To zero in on the root cause of non-trivial bugs, a developer might reproduce the use case in his or her own development clone in the Eclipse debug mode. Various levels of increasingly verbose logging can also be easily configured in the web application.
Server crashes and performance issues (‘the site seems really slow’) can be among the most difficult problems to investigate, because it is often far from trivial to reproduce the issue or to pinpoint an underlying cause. Tedious detective work is often required, but a number of tools are available to help (Table 1). Recently, for example, jmap helped us identify the cause of infrequent server crashes that were related to a third party package for exporting data in Excel spreadsheet format. For excessively large tabular reports, so many objects were created that garbage collection could not keep up, and server CPU was maximized, making the affected server inaccessible.
In summary, troubleshooting requires the right tool for the job, depending on the exact nature of the issue at hand. The most difficult part is often reproducing the issue, especially when the problem may be related to heavy server load. Finally, it always bears remembering one of the golden rules of customer support, no matter how trivial it may sound: the inability to readily reproduce an issue reported by a user does not imply that the issue is not real.
Discussion and summary
The RCSB PDB strives to provide a quality resource with highly reliable service. This implies uninterrupted access 7/24/365 regardless of maintenance needs, power outages, etc.
Over more than a decade of managing the PDB, the RCSB PDB has generally enjoyed very favorable user comments regarding the reliability and performance of the site. However, one lesson learned is that users do not necessarily tell us about problems they experience, but possibly just leave the site. Over one recent year, the site was accessed from roughly one million unique IP addresses, but only about 1600 different users wrote to the electronic help desk with comments, questions or concerns. While these numbers leave room for various interpretations, personal interactions with users, for example at conferences, also sometimes reflect reluctance to voice perceived problems. Some users have said they simply assumed that they were doing something wrong and did not consider the possibility of a bug on the site. While it is of course always desired to discover issues internally before outside users experience them, the tendencies just described raise the burden of doing so.
The question of how much to test, and how, is not a simple one to answer. Time and resources simply do not permit us to test everything, so priorities have to be set. The question of automated versus manual testing is also an interesting one. While complete testing automation may naively seem like an obvious goal, we have found that it cannot fully replace manual testing, and that a proper balance is required. Another interesting psychological aspect is an inherent danger of over testing. The more assertions are included in a test script, the higher the chance that one of them fails. Isn't this always a good thing? Yes, as long as the failure indeed reflects a real problem. However, increased testing also increases the chance of false error reports, and in our experience this brings with it a danger of developing complacency on the part of the tester (‘I've seen that fail before, I won't worry about that’). All tests should be conceived and implemented such that a failure indeed reflects a real problem that warrants further investigation.
Selenium IDE as a testing environment has a number of advantages. It is easy to get started writing tests using the GUI test editor, and at the same time the HTML formatted source code of the tests is easily edited by hand. There are multiple ways of addressing HTML elements on pages, including relative and absolute placement in the document object model (DOM) via the powerful XPath query language. Arbitrary JavaScript can be embedded in the Selenium commands, allowing for the evaluation of mathematical constructs and adding limited ways of including logic in the assertions. However, a shortcoming of Selenium IDE (at least without the use of third party add-ons) is the lack of true flow control or looping, making some repetitive tests a bit awkward (e.g. ‘for each of the structural genomics centers, test the number of structures returned’).
The strongest point of using Selenium IDE, in our opinion, is that the execution of the tests in a real browser constitutes a testing environment that most closely resembles the end user's real experience of interacting with the website. Unit testing and regression testing are important components of a comprehensive quality assurance strategy. However, the ultimate goal is not to have every class pass a unit test, but for all website functionality to perform as designed and expected. A web browser is the most common interface to the RCSB PDB for most users, making Selenium IDE an appropriate choice for integration testing of the application as it is experienced by the user.
We have developed our quality assurance practices over the course of several years. While many of these could be considered fairly standard industry practices, we continually revise and refine them as necessary. Hardware redundancy, in particular, brings with it necessary trade-offs, such as the overhead of data synchronization, inefficient utilization of hardware, financial constraints, limits on scalability, etc. For example, multiple copies of databases that are updated independently from each other may for one reason or another diverge in content over time. We intend to improve on this with a future hardware re-design.
Another area in which we could improve is the use of regression tests. While the regression test suite covers a decent amount of site functionality, it is not comprehensive. Furthermore, an ideal goal might be that for every bug discovered and fixed, a test is added to the regression suite to avoid any undetected future occurrence of the same issue. Clearly, this would have to be balanced against the run time of the full test suite.
We have outlined tools and practices used for software maintenance in this article. The original design of the software and database was described elsewhere (18). The PDB website offers enough functionality that maintaining all of the code in a single web application becomes increasingly difficult. In order to address the mounting risks that code changes for one aspect of the site adversely affect other functionality, we are increasingly modularizing the code. Some components of the code base are already available through the BioJava (19) project.
In summary, we have described the quality assurance efforts for the RCSB PDB query and distribution systems in general, and for the RCSB PDB website in particular. Through multiple layers of redundancy we strive for 100% uptime and nearly achieve it. Weekly database updates and roughly quarterly software releases are carefully staged and tested before making them publicly available. Finally, we have outlined a number of tools and practices used to investigate problems that do occur despite our best efforts to avoid them in the first place.
Acknowledgements
The RCSB PDB is a team effort, and the contributions to quality assurance by all staff members in general and the annotation team in particular are greatly appreciated. A full listing of current RCSB PDB staff members is available at www.pdb.org/pdb/static.do?p=general_information/about_pdb/contact/pdb_members.html.
Funding
National Science Foundation (NSF DBI 0829586); National Institute of General Medical Sciences (NIGMS); Office of Science, Department of Energy (DOE); National Library of Medicine (NLM); National Cancer Institute (NCI); National Institute of Neurological Disorders and Stroke (NINDS); and the National Institute of Diabetes and Digestive and Kidney Diseases (NIDDK). The RCSB PDB is managed by two members of the RCSB: Rutgers University and UCSD. Funding for open access charge: National Science Foundation (NSF DBI 0829586).
Conflict of interest. None declared.
References
Author notes
Present address: Chaitali Shah, XIFIN Inc., 3394 Carmel Mountain Road, San Diego, CA 92121, USA.
