


Abstract
Drug-induced QT interval prolongation is one of the most common reasons for the withdrawal of drugs from the market. In the past decade, at least nine drugs, i.e. terfenadine, astemizole, grepafloxacin, terodiline, droperidol, lidoflazine, sertindole, levomethadyl and cisapride, have been removed from the market or their use has been severely restricted because of drug-induced QT interval prolongation. Therefore, this irregularity is a major safety concern in the case of drugs submitted for regulatory approval. The most common mechanism of drug-induced QT interval prolongation may be drug-related inhibition of the human ether-á-go-go-related gene (hERG) channel, which subsequently results in prolongation of the cardiac action potential duration (APD). hERGAPDbase is a database of electrophysiological experimental data documenting potential hERG channel inhibitory actions and the APD-prolongation activities of chemical compounds. All data entries are manually collected from scientific papers and curated by a person. With hERGAPDbase, we aim to provide useful information for chemical and pharmacological scientists and enable easy access to electrophysiological experimental data on chemical compounds.
Database URL: http://www.grt.kyushu-u.ac.jp/hergapdbase/
Introduction
The QT interval of an electrocardiogram is the measure of the duration of ventricular depolarization and repolarization. When ventricular repolarization is delayed and the QT interval is prolonged, there is increased risk of ventricular tachyarrhythmia. Ventricular repolarization is determined by the duration of the cardiac action potential, which is prolonged because of decreased inactivation of inward Na+ or Ca2+ currents, increased activation of the Ca2+ current, or inhibition of one or more outward K+ currents. The rapidly activating components of the delayed rectifier potassium current, known as outward K+ currents (IKr), seem to have the most influential role in determining the duration of the action potential and, thus, the QT interval. QT interval prolongation induced by drugs is known as drug-induced QT interval prolongation.
Drug-induced QT interval prolongation has been one of the most common reasons for the withdrawal of drugs from the market in the past decade. Drug-induced QT interval prolongation might cause polymorphic ventricular tachycardia, i.e. ‘torsades de pointes’ (TdP), and TdP may trigger ventricular fibrillation and sudden death in the worst-case scenario (1). Therefore, over the past decade, at least nine drugs, i.e. terfenadine, astemizole, grepafloxacin, terodiline, droperidol, lidoflazine, sertindole, levomethadyl and cisapride, have been removed from the market or their use has been severely restricted because of their involvement in drug-induced QT interval prolongation. Interestingly, the chemical structures of these nine drugs are unrelated, and they are non-cardiovascular drugs.
According to recent research, the human ether-à-go-go-related gene (hERG) encodes a pore-forming protein, which may represent the α-subunit of the human potassium channels responsible for IKr.
The hERG channel plays an important role in the repolarization phase of the action potential. The duration of the action potential in ventricular cardiocytes determines the length of the QT interval in surface ECGs. hERG channel blockers delay repolarization, which prolongs the action potential duration (APD), and this translates into a prolongation of the QT interval.
The most common mechanism of drug-induced QT interval prolongation may be inhibition of the hERG channel by drugs, and the subsequent prolongation of the APD (2, 3); in other words, hERG channel blockers may prolong cardiac action potentials and thus lead to the development of long QT syndrome (4).
Furthermore, TdP caused by drug-induced QT interval prolongation is a major safety concern with drugs that are submitted for regulatory approval. To avoid severe drug cardiotoxicity, adherence to the International Conference on Harmonization's (ICH) S7B guideline entitled ‘The non-clinical evaluation of the potential for delayed ventricular repolarization (QT interval prolongation) by human pharmaceuticals’ is recommended; this involves a non-clinical testing strategy for assessing the potential of a test substance to delay ventricular repolarization (5, 6).
To address these issues, we propose a unique database—hERGAPDbase. hERGAPDbase contains electrophysiological experimental data on chemical compounds with potential hERG channel-blocking effects, which were measured in terms of IKr currents in the hERG channel using the patch–clamp technique. In addition, electrophysiological experimental data concerning the APD prolongation activity of chemical compounds will also be included in hERGAPDbase. These data may be one of the most important indicators for predicting drug-induced QT interval prolongation. All data were manually collected and curated prior to input into hERGAPDbase.
hERGAPDbase is a web-based interface, which allows the user to search for chemical compounds with hERG channel-blocking potential and APD prolongation activity. hERGAPDbase also displays the top 30 chemical compounds on the basis of their degree of similarity with the chemical compound queried by the user, and shows the electrophysiological experimental data of each compound.
Although Fenichel's database (http://www.fenichel.net/pages/Professional/subpages/QT/Tables/pbydrug.htm) and Polak et al. (7) collected hERG assay data from scientific papers and the publicly deposited databases for the assessment of the torsadogenic potency of chemical compounds, there may be no databases accumulating both hERG and APD assay data. In this context, hERGAPDbase may be unique.
Thus, hERGAPDbase promotes a better understanding of drug-induced QT interval prolongation. In the future, hERGAPDbase might enable scientists to predict not only the hERG channel-blocking potential of drugs but also the drugs’ influence on the QT interval in the early stages of drug research and development.
Data collection
Overall data collection methods for hERGAPDbase are outlined in Figure 1. The primary source of data in hERGAPDbase is published scientific literature. A paper on hERG assay (8) and another on APD assay (8) were obtained from PubMed (9). In PubMed, we searched for the keywords ‘hERG’, ‘IC50’ and the phrase ‘patch clamp’ to find scientific papers mentioning hERG channel inhibitory activity for each chemical compound. To collect data regarding the APD for each chemical compound, we searched for the phrase ‘action potential duration’ and the keywords ‘APD30’, ‘APD60’ and ‘APD90’. Search profiles to find papers of interest at PubMed have been developed, improved and combined with repeated use of these keywords and phrases (Figure 1A).
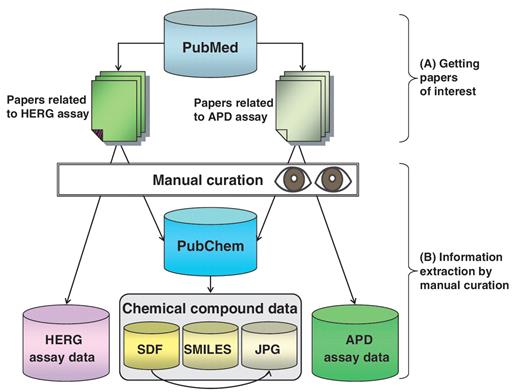
Overall method for hERGAPDbase data collection. (A) Two types of papers related to the hERG assay and the APD assay found in PubMed. (B) hERG assay data and APD assay data were extracted manually from scientific papers. The structural data of the chemical compounds (SDF; SMILES; and JPEG files) were obtained from PubChem.
After finding papers of interest, three types of information—hERG assay data, APD assay data and chemical compound data—were extracted manually (Figure 1B).
hERG assay data, which include characteristics such as chemical name, IC50, species, host cell, hERG channel-expression system, experimental temperature and PMID, are described in detail in Table 1. Although IC50 values obtained from mammalian cells expressing the hERG channel are more reliable than those from cells with heterogeneous expression of the hERG channel (10, 11), we collected electrophysiological data from scientific papers in an objective manner to acquire chemical compound information with as much structural diversity as possible.
Description of accumulated hERG assay data
| Chemical name | Name of chemical compounds and/or drugs described in the scientific papers. |
| IC50 (µM) | The half maximal inhibitory concentration (µM), which is a measure of the effectiveness of a compound in inhibiting hERG channel current. |
| Species | Origin of the hERG channel gene/protein. |
| Host cell | Cell with natural and/or artificial expression of hERG channel. |
| HERG channel expression system | In vitro hERG channel expression system. For example, ‘transient’ and ‘stable’. |
| Experimental temperature | Experimental temperature for patch–clamp test. |
| PMID | Unique identifier assigned to each PubMed entry. |
APD assay data, including chemical name, concentration, species, tissue, cell, measure after perfuse (min), stimulation (Hz), APD30, APD60, APD90 and PMID are described in detail in Table 2.
Description of accumulated APD assay data
| Chemical name | Name of chemical compounds and/or drugs described in the scientific papers. |
| Concentration | Concentration of the chemical compounds and/or drugs for measurement of the action potential. |
| Species | Origin of tissues and cells tested for the action potential of the compounds. |
| Tissue | Tissues for extracting cells. |
| Cell | Cells extracted from tissues for measuring the action potential. |
| Measure after perfusion (min) | Time measurement of the action potential after perfusion of compounds. |
| Stimulation (Hz) | Electrical stimulation frequency for the preparation. |
| APD30 | One of the action potential parameters that indicates APD at 30% repolarization. |
| APD60 | One of the action potential parameters that indicates APD at 60% repolarization. |
| APD90 | One of the action potential parameters that indicates APD at 90% repolarization. |
| PMID | Unique identifier assigned to each PubMed entry. |
In addition to the hERG and APD assay data, three types of chemical compound files, i.e. Structure Data Format (SDF) files and Simplified Molecular Input Line Entry Specification (SMILES) files were collected from the PubChem database (12). Joint Photographic Experts Group (JPEG) files were also collected by converting the format of SDF files by using MarvinView, which is a freely available software (http://www.chemaxon.com/download/marvin/).
Database schema and pre-processing
The database schema of hERGAPDbase is outlined in Figure 2.
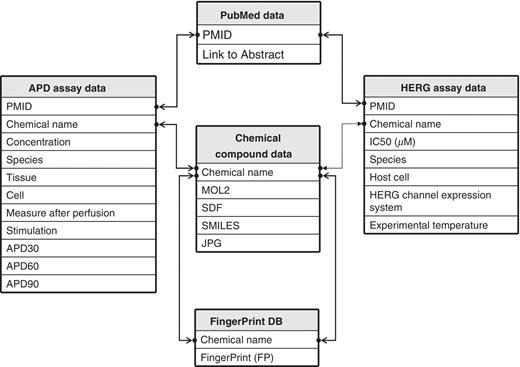
Schematic representation of hERGAPDbase architecture. hERGAPDbase consists of five data tables: PubMed data, Chemical compound data, FP DB, APD assay data and HERG assay data. The abbreviations APD and HERG indicate APD and hERG, respectively. The PubMed data table consists of two attributes: PubMed Unique Identifier (PMID) and Link to Abstract. The Chemical compound data table consists of five attributes: chemical name, Sybyl Mol2 chemical modeller output (MOL2), SDF, SMILES and JPEG). The FP DB data table consists of two attributes: chemical name and FP. The APD assay data table consists of 11 attributes: PMID, chemical name, concentration, species, tissues, cell, measure after perfusion, stimulation, APD at 30% repolarization (APD30), APD at 60% repolarization (APD60) and APD at 90% repolarization (APD90). The HERG assay data table consists of seven attributes: PMID, chemical name, half maximal inhibitory concentration (IC50; µM), species, host cell, HERG channel expression system and experimental temperature.
All hERG and APD assay data were collected independently from various scientific papers. These experimental data were related to each other by PMID. However, all chemical information was manually collected from the PubChem database based on the chemical name mentioned in scientific papers. Thus, different chemical names may indicate the same chemical structures. To avoid such inconsistencies in chemical names, all chemical information was converted into the binary bit string, which describes the chemical compound in SDF and/or SMILES formatted chemical compound data. These binary bit strings were added to the searchable FingerPrint (FP) DB, with each entry related to electrophysiological experimental data, such as hERG and/or APD assay data.
hERGAPDbase was implemented using the open source MySQL relational database management system to accumulate hERG assay data (Table 1) and APD assay data (Table 2).
For quick processing of similarity searches, all chemical compound data were pre-processed for construction of the FP DB. First, all SDF and/or SMILES files were converted into MOL2 files by OpenBabel software (13). OpenBabel, which is freely available software (http://openbabel.org/), is a specialized system used mainly for converting chemical file formats.
Then, all MOL2 files were converted into FP files using the mol22aefp module. The mol22aefp module, part of the MOLPRINT 2D software, is a compiled C binary program (14). Lastly, all FP files were accumulated into the hERGAPDbase to create the FP DB, which was used for similarity searching.
Web-based interface of hERGAPDbase
The web-based interface of hERGAPDbase was built using open-source Linux–Apache–MySQL–PHP (LAMP) tools and is outlined in Figure 3. hERGAPDbase is an online interactive interface for structure-based similarity searching in the FP DB.
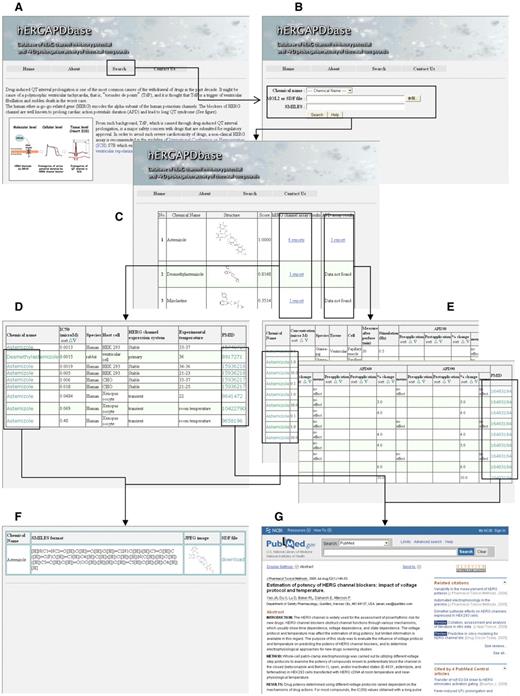
Overall outline of hERGAPDbase. (A) Homepage of hERGAPDbase. (B) Screen capture of the similarity search homepage for query input. In this example, astemizole is specified in the pull-down menu. (C) The resulting table from the similarity search in the FP DB of the hERGAPDbase. (D) Table of the hERG assay data for astemizole in this example. (E) Table of the APD assay data for astemizole. (F) Platform of data download for SDF, SMILES and JPEG files. (G) Paper abstracts of data resources for the hERG and APD assays from PubMed.
hERGAPDbase query input and similarity search
Detailed here are descriptions for querying and similarity searching in the hERGAPDbase, an example of similarity searching results and a description of how to browse hERG and APD assay data for each chemical compound. hERGAPDbase allows the user to specify a chemical compound or a drug using one of the three input methods: the chemical name, the MOL2 or SDF file or SMILES (Figure 3B).
In the chemical name window, the user specifies a chemical compound or drug in the pull-down menu. With the MOL2 or SDF file window, the user uploads the chemical compound data of any MOL2 or SDF file. In the SMILES window, the user inputs SMILES-formatted chemical compound data, which are text-based descriptions of chemical compounds.
After the user queries a chemical compound or drug as mentioned above and clicks on the search button (Figure 3B), the hERGAPDbase starts a similarity search in the FP DB.
The similarity search is performed with a perl script, tanimoto.pl, which is a program of MOLPRINT 2D software. Tanimoto.pl is an efficient algorithm used to calculate the similarity between chemical compounds: the higher the score, the more structural similarity between the compounds.
Results of the similarity search
After a similarity search, the hERGAPDbase displays table style results listing the top 30 chemical compounds in order of their similarity search score (Figure 4). The resulting table includes the following columns: number (No.), chemical name, structure, score, hERG channel assay results and APD assay results.
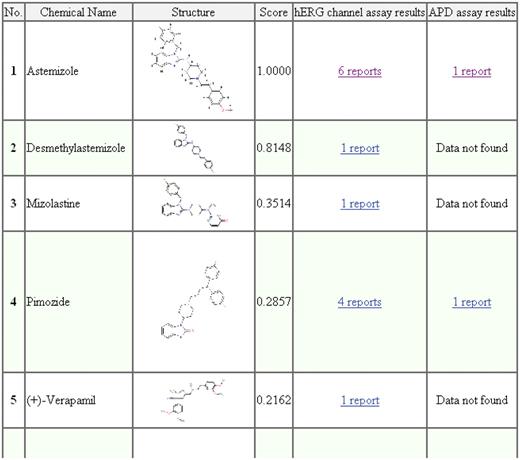
Screen capture of the similarity search results for astemizole. The attributes listed in the results table, i.e. No., chemical name, structure, score, hERG channel assay results and APD assay results, indicate the compound's similarity rank among the top 30 compounds, the name of the chemical compounds, JPG images of the chemical compounds, the similarity score calculated by tanimoto.pl, hERG assay results and the APD assay results, respectively.
The attributes listed in the results table—No., chemical name, structure and score—indicate the compound's similarity rank among the top 30 compounds, the name of the chemical compounds, JPG images of the chemical compounds and the similarity score calculated by tanimoto.pl, respectively. In addition, the hERG channel assay and APD assay results are displayed in the results table. Both columns include links to the electrophysiological experimental data or list ‘Data not found’ if there were no data.
Displaying hERG and APD assay results
The user can access the hERG assay results (Figure 5) for each chemical compound through the link in the hERG channel-assay results column, as shown in Figure 4. As shown in Figure 5A, the user will find that astemizole inhibits the activities of the human hERG channel, which was stably expressed on HEK 293 cells, with an IC50 value of 0.0013 μM. Further, the user will also find that astemizole inhibits activities of the human hERG channel transiently expressed in the Xenopus oocyte with an IC50 value of 0.0484 μM (Figure 5B).
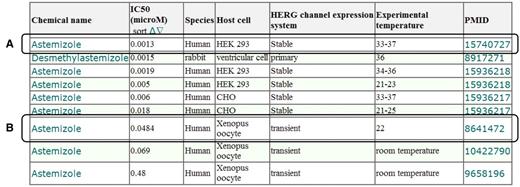
Screen capture of the hERG assay results for astemizole. (A) Example of hERG assay result using hERG channel stably expressed on HEK 293 cells. (B) Example of hERG assay result using a hERG channel transiently expressed in a Xenopus oocyte. The attributes listed in the results table, i.e. chemical name, IC50 (µM), species, host cell and PMID, indicate the name of the chemical compounds, the half maximal inhibitory concentration of the hERG channel, the origin of the hERG channel, cell with natural and/or artificial expression of hERG channel and PMID, respectively.
Next, the user can also access the APD assay results (Figure 6) of each chemical compound through the link in the APD assay results column (Figure 4). As shown in Figure 6A, 0.1 μmol/l astemizole had no effect on APD30, APD60 and APD90 of the guinea-pig ventricular papillary muscle. Further, 10.0 μmol/l astemizole had no effect on APD30 but prolonged 4.0% of APD60 and APD90 of the guinea-pig ventricular papillary muscle (Figure 6B).
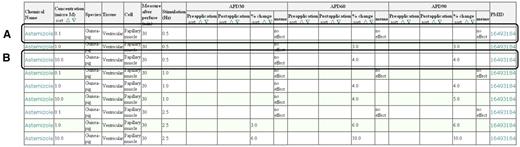
Screen capture of the APD assay results for astemizole. (A) Example of APD in the case of 0.1 μmol/l concentration. (B) Example of APD in the case of 10.0 μmol/l concentration. The attributes listed in the results table, i.e. chemical name, concentration (µM), species, tissue, cell, measure after perfuse (min), stimulation (Hz), APD30, APD60, APD90 and PMID, indicate the name of the chemical compounds, concentration of the chemical compounds and/or drugs for measurement of the action potential, origin of tissues and cells tested for the action potential of the compounds, tissues for extracting cells, cells extracted from tissues for measuring the action potential, time measurement of the action potential after perfusion of compounds, electrical stimulation frequency for the preparation, APD at 30% repolarization, APD at 60% repolarization, APD at 90% repolarization and PMID, respectively.
Other features of hERGAPDbase
hERGAPDbase provides a platform for downloading chemical compound data through click, the chemical name in the hERG assay results or the APD assay results (Figure 3D–F). Through this platform (Figure 3F), the user can copy and paste SMILES formatted data and JPG files and download SDF files.
In addition, hERGAPDbase also provides links to MEDLINE entries for accessing abstracts of scientific papers related to the experimental data through click using the PMID (Figure 3G).
Future plans and upgrades
To better understand the torsadogenic activities of chemical compounds, it may be necessary to collect additional information on chemical compounds for which hERG and APD assays have been performed. Although, we are currently focusing on collecting information on chemical compounds that have shown positive hERG and APD assay effects during electrophysiological experiments, it may be important to collect information on chemical compounds with negative effects. In addition, the current version of hERGAPDbase has more hERG assay data than APD assay data; therefore, more of the latter should be added.
For these reasons, hERGAPDbase is still under construction and may have limited usefulness in its current state. Therefore, hERGAPDbase will be continuously updated when new articles and data are opened to the public domain. We plan to increase the number of structurally unrelated chemical compound data entries by adding new electrophysiological experimental data. Moreover, in the future, we plan to collect clinically measured human ECG data.
Regarding the web-based interface, we plan to provide users with the ability to download the full data set, which contains chemical compound information including bioactivity annotations, for easier access to hERGAPDbase.
In the next version of hERGAPDbase, we also plan to create bidirectional links between our database and the major open and public databases, such as PubChem, for easier and more comprehensive access to our database.
Funding
Our research was supported by both the Department of Genetic Resources Technology, Faculty of Agriculture, Kyushu University and Otsuka Pharmaceutical Co. Ltd.
Conflict of interest. None declared.
Acknowledgements
We thank Dr Hirofumi Ogawa and Dr Kazushi Nomura for helpful advice on constructing the web-based interface of hERGAPDbase. We also thank Mr Toshihide Ono for technical advice about the relational database management system.
