


Abstract
The QlicRice database is designed to host publicly accessible, abiotic stress responsive quantitative trait loci (QTLs) in rice (Oryza sativa) and their corresponding sequenced gene loci. It provides a platform for the data mining of abiotic stress responsive QTLs, as well as browsing and annotating associated traits, their location on a sequenced genome, mapped expressed sequence tags (ESTs) and tissue and growth stage-specific expressions on the whole genome. Information on QTLs related to abiotic stresses and their corresponding loci from a genomic perspective has not yet been integrated on an accessible, user-friendly platform. QlicRice offers client-responsive architecture to retrieve meaningful biological information—integrated and named ‘Qlic Search’—embedded in a query phrase autocomplete feature, coupled with multiple search options that include trait names, genes and QTL IDs. A comprehensive physical and genetic map and vital statistics have been provided in a graphical manner for deciphering the position of QTLs on different chromosomes. A convenient and intuitive user interface have been designed to help users retrieve associations to agronomically important QTLs on abiotic stress response in rice.
Database URL:http://nabg.iasri.res.in:8080/qlic-rice/.
Introduction
A quantitative trait locus/loci (QTL) is the location of individual locus or multiple loci in an organism's genome that affects a trait measured on a quantitative (linear) scale. These quantitative traits are primarily governed by interactions of multiple genes and their allelic variants with environmental factors (1). As more genomes are sequenced, it becomes increasingly feasible to map genetically identified QTLs from various breeding populations (e.g. in rice and other crops) based on the sequence alignment of the genetic markers flanking the borders of the QTL region or, if desired, only the markers underlying the peak of the resolved QTL. Comprehensive collection and display of this integrated information has become necessary in the post-genomic era, and would allow for clear and useful interpretations of the data. To the knowledge of the authors, this particular data integration has not yet been reported in rice. We have developed the QlicRice database with the specific aim of mining abiotic stress responsive QTLs integrated with rice genomics data to query the large amount of available information on structural and functional genomics derived from genetic mapping, genome sequencing, genome annotation, expression profiling and QTL analysis. In this article, we will introduce QlicRice and its usefulness in functional genomics and rice breeding programs.
QlicRice has been developed to efficiently provide useful information in a user-friendly manner. Mindful of its usefulness to plant breeding and functional genomics research on the abiotic stress response biology of the rice plant, the database was developed and designed to host information on a nearly complete set of abiotic stress-related rice QTLs and sequenced rice genes identified by genome sequencing and annotation projects. This addresses the following goal: ‘Find all the gene loci from the sequenced genome that are present in the genomic region underlying the region of the mapped QTL with a desired trait’. Other features of interest include, the protein-coding gene loci, along with their detailed information, aligned expressed sequence tags (ESTs), GenBank accessions and their tissue-specific expression, protein structure, functional characterization using the Gene Ontology (GO), Kyoto Encyclopaedia of Genes and Genomes (KEGG) Orthology (KO), links to metabolic pathways via KO and tandem repeats. In order to build the database, an intensive search for published resources on rice QTLs responsive to various abiotic stresses was conducted. The 974 abiotic stress-related QTLs representing 53 of traits were collected and annotated for their physical position on different chromosomes assembled by the Rice Genome Sequencing and Annotation Project (MSU-osa1) (2). The alignment of QTLs based on the bordering genetic marker and its physical position on the genome enabled us to find 460 corresponding gene loci overlapping the boundaries of the mapped QTLs. In this database, a comprehensive physical and genetic map is provided to identify the genes underlying quantitative traits and correlate them with their physiological and biochemical mechanisms (3,4). A further effort was made to add GO assignments to these 460 genes to understand their molecular role in biological processes and their locations in cellular components. Similarly, genes were annotated to the KO and its extension to the KEGG metabolic pathways.
The QlicRice system provides simple information retrieval of abiotic stress-related rice QTLs. These QTLs, their corresponding gene loci, associated literature references and genomic information have been stored in a MySQL database (5) accessed via a powerful web application developed using the PHP (http://php.net/downloads.php) scripting language. The online database is accessible at http://nabg.iasri.res.in:8080/qlic-rice/.
Data source and analysis
Rice QTLs, their corresponding rice gene loci and metadata, were collected from various biological databases such as Gramene Database (6) release #30 (http://www.gramene.org/, Rice Annotation Project (2) release #6 (http://rice.plantbiology.msu.edu/), GO Database (http://amigo.geneontology.org/cgi-bin/amigo/go.cgi), GenBank at NCBI and KEGG Database (http://www.genome.jp/tools/kaas). The annotation, curation and alignment of the collected data resulted in the identification of a total of 974 QTLs for abiotic stress traits and 460 corresponding gene loci mapped on different rice chromosomes. We were successful in mapping 583 QTLs (Figure 1) determined by analysing their physical position on 12 rice chromosomes (Figure 2) based on the alignment of bordering genetic markers, which had sequences associated with them. We were unable to map a further 391 QTLs due to a lack of sequenced markers bordering any physical position on rice chromosomes. This is typical of the QTLs identified in classical genetic experiments involving Random Amplified Polymorphic DNA (RAPD) and Amplified Fragment Length Polymorphism (AFLP) markers, which tend to provide an excessive number of polymorphic sites that, are not unique and/or use Restriction Fragment Length Polymorphism (RFLP) markers that have no sequences associated to them.
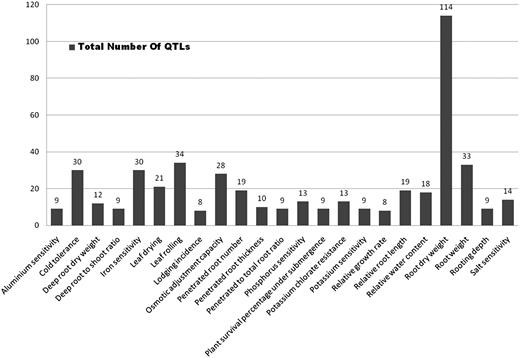
Number of QTLs scored for a short list of traits selected by their distribution on at least 6 out of 12 chromosomes (Supplementary Table S1). Note that ‘root dry weight’ has the highest number of QTLs by a wide margin.
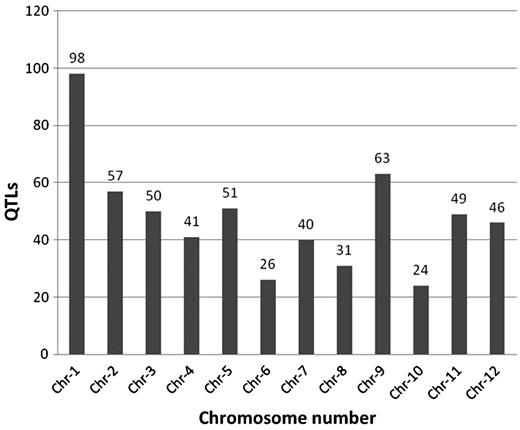
Overall distribution of 583 abiotic stress-associated QTLs scored for 53 traits mapped to 12 rice chromosomes, including those listed in Figure 1. Chromosome 1 has the highest number of identified QTLs (98) while chromosome 10 has the lowest (24).
Of the 583 QTLs with a physical map position, we observed (Figure 2) that rice chromosome 10 had the least number of QTLs mapped (23) compared to 98 QTLs mapped on chromosome 1. We also looked at the genes underlying these QTLs and classified them in four categories (Table 1) based on their location on the genome and its overlap with QTL. These categories include: (i) locus enclosed in ‘[ ]’ indicating a locus lying completely on or within the bounds of the corresponding QTL, (ii) locus enclosed in ‘] [‘indicating a locus extending beyond the bounds of corresponding QTL, (iii) locus prefixed with ‘<’ indicating a left-flanking locus with respect to the corresponding QTL (5′–3′) and (iv) locus prefixed with ‘>’ indicating a right-flanking locus with respect to the corresponding QTL (5′–3′). We observed that the highest number (94.8%) of loci belonged to the first category (Table 1). Further analysis demonstrated that 583 QTLs play an imperative role in 52 different abiotic stresses with a maximum of 114 QTLs (19.55%) for the trait ‘root dry weight’ (Figure 1). Other significant QTLs include 34 (5.8%) for ‘leaf rolling’, 33 for ‘root weight’, 28 for ‘osmotic adjustment capacity’, 30 for ‘iron sensitivity’, 21 for ‘leaf drying’ and 19 each for ‘penetrated root number, relative root length and 18 for relative water content’ (Figure 1). With the exception of iron sensitivity, these traits are all associated with drought or water deficit growth conditions. The overall distribution of significantly represented QTL traits and QTLs distributed across at least half the number of chromosomes (Figure 3), we observed that there are about 26 such traits of which root dry weight and leaf rolling are controlled potentially by many loci across several chromosomes. With the exception of cold tolerance, aluminium sensitivity and iron sensitivity QTLs almost all of the traits can be associated to plants’ response to water deficit or water relations in a physiological condition (Figure 3). The remaining QTLs were associated at a lower frequency of occurrence with several physiological and morphological traits linked to abiotic stress conditions (Supplementary Table S1). In silico tissue-specific expression studies mapped the over-expressed ESTs aligned to the gene loci, indicating that the majority of genes overlapped by these QTLs were expressed in the ‘shoot’ and ‘whole plant’ (Table 2). This is a significant finding considering that the physiological aspect of water relations in plants essentially start by the interaction of roots and the growth environment mainly the soil. We expected that the gene expression would be over represented in roots, which is clearly not the case.
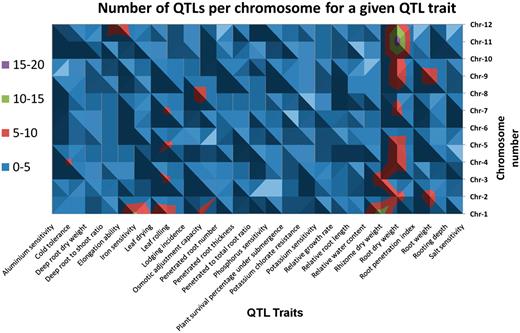
A topological display of the number of QTLs scored and associated traits selected by their distribution on at least 6 out of 12 chromosomes (Supplementary Table S1).
List of symbols describing the location of sequenced gene loci with respect to the overlapping QTL
| Symbol | Symbol description, enclosed ‘in’ or ‘prefixed’ with | Locus IDs | Numbers of corresponding locus |
|---|---|---|---|
| [] | The MSU locus lies on the QTL or completely within the bounds of corresponding QTL. | [LOC_XYZ] | 435 |
| ][ | The MSU locus extends beyond the bounds of corresponding QTL. | ]LOC_XYZ[ | 1 |
| < | The MSU locus is left flanking the corresponding QTL (5′–3′). | <LOC_XYZ | 6 |
| > | The MSU locus is right flanking the corresponding QTL (5′–3′). | >LOC_XYZ | 17 |
The Locus IDs enclosed ‘in’ or ‘prefixed’ with [],][, < and > (and their counts) are related to abiotic stress QTLs in rice. Four hundred and thirty-five loci are enclosed with ‘[]’, 1 with ‘] [‘, 6 with ‘<’ and 17 with ‘>’. One locus enclosed with both in ‘<’, and ‘[]’ is not shown.
Locus_XYZ is representation for any Locus IDs related to abiotic stress condition listed in the supplementary Table 3.
Tissue-specific expression of abiotic stress related QTLs of rice
| Locus ID | QTLsa | Tissue | Number of EST | Frequency |
|---|---|---|---|---|
| LOC_Os01g46610 | AQCS001 (UV-b light sensitivity), AQCS004 (UV-b light sensitivity), CQI2 (sodium uptake), CQI3 (sodium to potassium content ratio) | Anther | 7 | 0.039 |
| LOC_Os03g46770 | AQCS002 (UV-b light sensitivity), AQCS005 (UV-b light sensitivity), AQD002 (UV-b light sensitivity), AQD010 (leaf rolling), AQD022 (leaf drying), AQD028 (leaf drying), AQR013 (deep root dry weight), CQAW10 (penetrated root number) | Endosperm | 22 | 0.339 |
| LOC_Os12g36830 | AQCl012 (phosphorus sensitivity), AQD026 (leaf drying), AQDZ005 (lodging incidence), AQGl019 (root dry weight), AQGL025 (root dry weight), AQGl026 (root dry weight), AQGl066 (root dry weight), AQGl092 (root dry weight), AQGl098 (root dry weight) | Flower | 101 | 0.169 |
| LOC_Os05g33570 | DQE50 (relative water content), DQC9 (penetrated root number), AQC016 (penetrated to total root ratio), DQC16 (penetrated to total root ratio) | Immature seed | 11 | 0.278 |
| LOC_Os02g38480 | CQAA16 (relative phosphorus distribution between shoot and root), CQAA17 (relative phosphorus distribution between shoot and root), | Root tip | 1 | 1.235 |
| LOC_Os11g47760 | AQAR001 (root dry weight), AQF105 (potassium chlorate resistance) | Seed | 46 | 0.137 |
| LOC_Os02g38920 | CQAA16 (relative phosphorus distribution between shoot and root), CQAA17 (relative phosphorus distribution between shoot and root) | Seedling | 14 | 0.281 |
| LOC_Os06g50300 | AQGI059 (root dry weight), AQGI060 (root dry weight), AQEK004 (iron sensitivity), AQEK006 (iron sensitivity), AQEK008 (iron sensitivity), AQEK012 (iron sensitivity) | Sheath | 2 | 0.575 |
| LOC_Os11g06720 | AQAL058 (rooting depth), AQEX028 (root dry weight), AQF104 (potassium chlorate resistance) | Shoot | 387 | 0.232 |
| LOC_Os11g06720 | AQAL058 (rooting depth), AQEX028 (root dry weight), AQF104 (potassium chlorate resistance) | Stem | 11 | 0.474 |
| LOC_Os08g10020 | CQAW4 (penetrated root number), CQl1 (potassium concentration) | Whole plant | 135 | 0.221 |
aIndicate the traits related to abiotic stress.
Physical and genetic map
To generate a physical map of each chromosome, the MSU loci were plotted on the left side of the chromosome and the QTLs on the right side, placed by an algorithm [written in R (7) developed in-house] intended for all 12 rice chromosomes; a unit on these maps corresponds to a scale of ∼1 Mb (mega base pairs). The side-by-side plotting of both loci facilitates visual comparison and helps the user to understand the relative position of the MSU loci with respect to the QTLs. The interface of the map provides an interactive feature including a zoom option. Only the start positions of the MSU loci and QTLs were plotted across the chromosomes; plotting the stop position was not feasible as it would lead to multiple corresponding loci across the length of the chromosome. The purpose was to get a clear graphical overview of the relative distribution of the MSU loci across the 12 rice chromosomes with respect to the corresponding QTL locations on the rice genome map, as illustrated on chromosome 1 in Supplementary Figure S1 (8).
GO enrichment
To understand the molecular characteristics of the genes overlapped by QTLs, we used GO assignment of rice proteins provided by the Rice Annotation Project (http://rice.plantbiology.msu.edu/annotation_pseudo_goslim.shtml). The GO data highlights the dynamic glossary and hierarchy that unifies gene characterization across genomes. GO has been used widely to predict gene function and classification (9). Three independent set of ontologies were used to describe a gene product: (i) the biological process (BP) in which the gene product participates directly; (ii) the molecular function (MF) that describes the gene product activities; and (iii) the cellular component (CC) where the gene product can be localized. We could functionally classify 200 QTLs (34.013%) using GO terms and establish pathway associations for 76 QTLs (7.8%) using the KEGG. This study showed that 194 QTLs are assigned to MF, 178 QTLs to BPs and 173 QTLs to CC GO terms (Supplementary Figure S2). Close observation revealed that out of 178, 107 (60.11%) QTLs were involved in ‘response to stress’ (GO: 0006950) in BP, while out of 173, 99 (57.22%) were involved in ‘nucleus’ (GO: 0005634) in CC and 85 (43.82%) out of 194 QTLs, were responsible for ‘hydrolase activity’ (GO: 0016787) in the MF category. Table 3 illustrates the GO analysis, revealing the expression and enrichment of the predicted QTLs in response to abiotic stresses amongst the diverse functional categories in this study. The Venn diagram (Supplementary Figure S2) shows the 163 QTLs involved in all three GO categories and their concurrence, whereas 4, 1 and 12 QTLs were involved in both ‘CC and MF’, ‘CC and BP’ and ‘BP and MF’, respectively. Of the 460 corresponding gene loci, ∼80% were assigned more than one GO term with a total of 84 GO assignments being made directly based on information in public databases.
GO enrichment analysis of QTLs related to abiotic stress in rice
| GO Type | GOSlim ID | GO Name | Number of QTLs |
|---|---|---|---|
| BP | GO:0006950 | Response to stress | 107 |
| GO:0009719 | Response to endogenous stimulus | 96 | |
| GO:0009628 | Response to abiotic stimulus | 78 | |
| GO:0007165 | Signal transductions | 75 | |
| GO:0009987 | Cellular process | 74 | |
| GO:0006350 | Transcription | 66 | |
| GO:0009058 | Biosynthetic process | 56 | |
| GO:0006464 | Protein modification process | 56 | |
| CC | GO:0005634 | Nucleus | 98 |
| GO:0005737 | Cytoplasm | 86 | |
| GO:0016020 | Membrane | 72 | |
| GO:0005739 | Mitochondrion | 69 | |
| GO:0005886 | Plasma membrane | 60 | |
| GO:0005783 | Endoplasmic reticulum | 55 | |
| GO:0009536 | Plastid | 49 | |
| GO:0005730 | Nucleolus | 47 | |
| MF | GO:0016787 | Hydrolase activity | 85 |
| GO:0003824 | Catalytic activity | 77 | |
| GO:0003700 | Transcription factor activity | 73 | |
| GO:0003677 | DNA binding | 68 | |
| GO:0005488 | Binding | 63 | |
| GO:0000166 | Nucleotide binding | 59 | |
| GO:0016301 | Kinase activity | 58 | |
| GO:0005515 | Protein binding | 58 |
Only those QTLs having the highest number of GO terms in each category are listed.
Exploring the path maps
QlicRice also provides references to the higher order functional information stored in the biochemical pathway database KO by referencing the ID numbers using the KEGG Automatic Annotation Server (http://www.genome.jp/tools/kaas/) to assign KO identifiers. The results page of KEGG pathway details displays KEGG BRITE (metabolism, genetic information processing, environmental information processing and cellular process). Each reference pathway is viewed as a network of enzymes identified by their commission (EC) numbers and the small molecule metabolites participating in the biochemical reactions catalyzed by these enzymes. By clicking on the particular gene locus, it displays its involvement in a biochemical pathway with the highlighted locus IDs in yellow boxes.
Mining protein structure
In addition to QTL analysis, biochemists often want to look at the structure of the protein to identify the effect of genetic polymorphism determined by genetic and in silico studies. These genetic polymorphisms—often identified by DNA-level insertions and deletions generating alternating forms of transcripts, peptides and single nucleotide polymorphisms (SNP)—can generate synonymous and non-synonymous mutations, leading to putative substitutions in the encoded peptide provided the mutations are in the coding regions of the gene. In addition to the genetic variation observed in the regulatory regions of the cis-elements of genes, the protein-coding regions important for its function are crucial for a protein's activity. Therefore, the three-dimensional (3D) protein structures of overlapping gene loci were modelled by SWISS MODEL (http://swissmodel.expasy.org/) and incorporated in the database. Each locus has a hyperlink with image files showing the protein structure in Protein Data Bank (PDB) format, which can be downloaded and visualized by any protein structure visualization tool such as Rasmol (http://rasmol.org/), DS-Visualiser (http://download.accelrys.com/) and Cn3D (http://www.ncbi.nlm.nih.gov/Structure/CN3D/cn3d.shtml). Automated comparative modelling of 3D protein structures, which identifies templates through sequence identity on the Swiss model server, provides the most accurate model by: (i) finding the known structures (templates) associated with the sequence to be modelled (target); (ii) aligning the target sequence with the templates; (iii) constructing the model; and (iv) measuring the model (10).
QlicRice application architecture
The QlicRice backend resides on a MySQL relational database (http://www.mysql.com), developed with the assistance of SQLyog, a database management utility (http://www.webyog.com/en/, ver. 8.1.3). The full software stack is provided in an XAMPP package (ver 2.5) (http://www.apachefriends.org/en/xampp.html), consisting of Linux (X86_64 Red Hat), Apache, MySQL, Perl and PHP, all running on a Sun Microsystems Blade server. The database was designed and developed to store biological data sets on QTLs, their corresponding locus information, metabolic pathways, GO and KO terms and mapped ESTs. QlicRice employs two-tier client–server architecture, sending the client request from a web browser to the server-hosted web application and database (Supplementary Figure S3). The server receives the request and retrieves the required data in a format acceptable to the user. The database schema designed by us (Supplementary Figure S4) was optimized for performance and storage of the data sets.
Querying the QlicRice database
User interface and search results
QlicRice provides a query interface designed for searching genes underlying QTLs related to abiotic stresses. Three query options (Figure 4A) include: (i) search by typing abiotic stress trait; (ii) mine QTL details by submitting QTL Accession ID (same as those of QTLs provided by Gramene database); and (iii) query by gene locus ID. The search interface allows the selection of any of the above query types and an input form with an auto-complete function. Users can select any of these options, complete the corresponding fields and retrieve a list of relevant results for example a query for QTL ID AQFC001 (Figure 4B) and gene ID LOC_Os03g18130 (Figure 4C). Once a user is on the gene results page (Figure 4C), they s/he has an option to select the options listed in C1 to view the respective pieces of information on general information (Figure 4C), KEGG ontology (Figure 4D), GO (Figure 4E), Tandem repeats (Figure 4F). The QTL ID link in Figure 4B hyperlinks to the source QTL on the Gramene database project. Gene id link in Figure 4C links back to the source MSU-osa1. The gene ID in Figure 4G allows the users to download the protein structure file in the PDB format which can then be uploaded in the stand alone applications discussed above. Additional detail information regarding a particular query is also only a click away by visiting the left hand side links on search by chromosome number, QTL statistics, Chromosome map, tissue-specific statistics and links to the source data providers (Figure 4A). Supplementary Table S2 describes the fields in the result page. ‘Chromosomal map’ views (Supplementary Figure S1) from the search pages, gives us clear graphical overview of the relative distribution of gene loci across the 12 rice chromosomes with respect to the corresponding QTL locations on the map and via the pie charts (Supplementary Figure S5) in ‘QlicRice statistics’, taking into account the classification of QTLs responsive to abiotic stresses on all 12 chromosomes. The graphical layout of QTLs for different abiotic stresses gives us a clear understanding of their distribution and density on each chromosome. An example of the classification of abiotic stress-related QTLs on chromosome 12 is shown in Supplementary Figure S5. Tissue-specific expression analysis has been incorporated for identifying candidate stress responsive genes underlying QTLs that are highly expressed in particular tissue from MSU-osa1. Tandem repeats and their consensus sequences were analysed and retrieved by using the Tandem Repeat Finder (http://tandem.bu.edu/trf/trf.submit.options.html) for the corresponding loci to give an indication of their role in the evolution of genomic loci. GO analyses were performed by MSU-osa1 GOSlim Assignment of rice proteins (http://rice.plantbiology.msu.edu/GO.retrieval.shtml) to understand the BPs, MFs and CCs of rice QTLs involved in abiotic stress tolerance. Biochemical pathways were retrieved by their KO numbers using the KEGG Automatic Annotation Server (http://www.genome.jp/tools/kaas/), which assigns KEGG pathways showing KEGG BRITE (11), the collection of functional hierarchies and ontologies. Template structure and model have also been integrated in QlicRice and were modelled by Swiss Modeller (http://swissmodel.expasy.org/). Previous analysis has shown a number of experimentally determined structures that have been deposited in the PDB and a number of sequences in public sequence databases. To bridge the gap between available sequences and their unknown structure, protein structure prediction methods are important tools; thus we used this technique to build 3D models for further functional annotation (12–14).
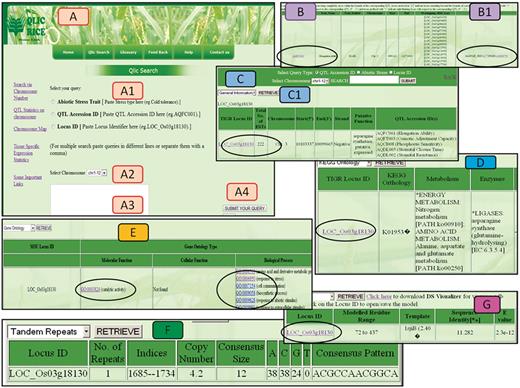
Different views of the QlicRice search user interface. (A) Query interface: (A1) select the query type, (A2) select chromosome, (A3) type your query in the given search box and (A4) submit your query. (B/B1) QTL search results for a given QTL ID. (C) Gene search result for a given Gene ID. (C1) View details of the given gene, which include: (D) the KEGG ontology and pathway mappings, (E) GO assignments, (F) scored tandem repeat(s) and (G) the protein structure module with a gene ID link to the downloadable PDB-formatted protein structure data file. This PDB file can be uploaded in any of the protein 3D-viewers listed on the page or described in the article.
For further enhancement of QlicRice data quality, rice-specific glossary are provided for public discussion and the database web site hosts web-based submission forms for inviting suggestions, feedback and updates for existing and proposed datasets. A ‘help document’ in the help section has been especially created for users to understand the step-by-step data curation process and its relationship to the database. Important links to companion web sites have been integrated on QlicRice as ready references for the user.
Discussion and conclusion
QlicRice is designed to capture and integrate genomic information on QTLs related to abiotic stresses in rice. It emphasizes the importance of searching novel candidate genes underlying QTLs, to understand their MFs and their role in biochemical pathways that may regulate and/or contribute to the observed plant phenotype in response to various abiotic stresses. Abiotic stress tolerance in plants is a quantitative trait and involves diverse genetic mechanisms that are governed by the action of one or many numbers of genes and versatile molecular adaptive processes (15). Therefore, it is important to identify genes/QTLs associated with abiotic stress tolerance or those with the capability to benefit crop plants in adapting to the adverse environmental conditions required to maintain agricultural productivity. Moreover, owing to global environmental changes, a rise in temperature is further likely to compound the existing problem of water deficits and drought affecting rice production that currently feeds about half the world population. Hence, deep understanding of abiotic stress responses in crop plants on a genome-wide scale is vital for the continuous development of strategies to develop improved stress-tolerant crop plants (16,17). As plants experience stress at different stages of growth and development, it would be useful to narrow down the searches for genes and QTLs identified with a specific role at a given growth stage. Several laboratories are currently engaged in identifying robust QTLs, which are predicted to remain unchanged across growth stages. Such information will be added to the QlicRice database on a regular basis.
In this post-genomic era, one of the great challenges in biology is to resolve in a meaningful way the ever-increasing size and number of data sets, and their continuous enrichment for associations on important traits. It is important to build powerful data analysis tools that are capable of scaling and still maintain the annotation quality that allows biologists to query the data in meaningful ways. Therefore, we designed QlicRice, a client-responsive architecture that allows multiple search options via the ‘Qlic Search’ interface. This portal decreases the manual curation of an array of datasets collected from various rice genomics databases as well as those generated in-house. We believe this database would facilitate discovery of novel and thus far unexplored information on abiotic stress tolerant QTLs. The database is also expected to help with the easy interpretation of new experimental data.
Future direction
To begin with, the QlicRice database has placed emphasis on the integration of different QTLs and gene loci related to abiotic stresses by implementing multiple query options. The database has an inbuilt option for further updates and inputs from the research community. It will be expanded to include new abiotic stress-related QTLs, gene expression and proteomics data. The future development of QlicRice will be focused on an even more user-friendly web interface. We also plan to integrate new data sets, such as microarray data on gene expression under different abiotic stresses, phylogenetic relationships to homologous genes from diverse crop species and QTLs from other major crop models such as corn, sorghum and Brassica. Through our collaboration with the Gramene database, the data generated by the QlicRice database will be shared for integration in Gramene's subsequent releases.
Funding
Network Project on Transgenics in Crops (NPTC); Indian Council of Agricultural Research (ICAR); the National Science Foundation (NSF) of USA (Awards 0822201 and 0703908 to P.J. and J.P.). Funding for open access charge: Waived by Oxford University Press.
Conflict of interest. None declared.
Acknowledgement
The authors are grateful to Mr Kamal Batra, Technical Officer, IARI for helpful discussion and suggestions. The authors thank Gramene (http://www.gramene.org), MSU_osa1 (http://rice.plantbiology.msu.edu/), KEGG (http://www.genome.jp/tools/kaas/) and other biological databases for sharing their data.
