


Abstract
The ever-increasing scale of biological data sets, particularly those arising in the context of high-throughput technologies, requires the development of rich data exploration tools. In this article, we present AnnotCompute, an information discovery platform for repositories of functional genomics experiments such as ArrayExpress. Our system leverages semantic annotations of functional genomics experiments with controlled vocabulary and ontology terms, such as those from the MGED Ontology, to compute conceptual dissimilarities between pairs of experiments. These dissimilarities are then used to support two types of exploratory analysis—clustering and query-by-example. We show that our proposed dissimilarity measures correspond to a user's intuition about conceptual dissimilarity, and can be used to support effective query-by-example. We also evaluate the quality of clustering based on these measures. While AnnotCompute can support a richer data exploration experience, its effectiveness is limited in some cases, due to the quality of available annotations. Nonetheless, tools such as AnnotCompute may provide an incentive for richer annotations of experiments. Code is available for download at http://www.cbil.upenn.edu/downloads/AnnotCompute.
Database URL:http://www.cbil.upenn.edu/annotCompute/
Background
The availability and widespread use of high-throughput technologies, e.g. sequencing, genotyping and gene expression microarrays, continue to revolutionize every aspect of life sciences research and practice. The ever-increasing scale of biological data sets requires the development of rich data exploration tools in support of scientific discovery.
In this article, we focus on helping the user discover interesting results in repositories of biological experiments. In particular, we consider the repository of functional genomics experiments that is publicly available from the ArrayExpress Archive (1), a repository that comprises over 660 000 assays from over 20 000 experiments at the time of this writing. The Archive implements search and browsing functionality, and also makes its repository available for download. ArrayExpress annotations are primarily supplied by submitting users with some curation of assay types plus limited text mining of Gene Expression Omnibus (GEO) imports for experimental factors. Occasionally, the curation is extensive and this is usually the case when the original submission is not adequately described.
We motivate and demonstrate our approach with an example. Consider a researcher studying the impact of normal aging on gene expression profiles during the lifespan of an organism. The researcher may search ArrayExpress by issuing the query ‘lifespan or life span or longevity’ against the repository. The query is evaluated by the ArrayExpress search system, and returns all experiments that contain the query keywords or synonyms of query keywords, in any field; about 50 experiments matched the query on 15 June 2010. The researcher can now consider each experiment in the result set, and identify those that are of interest. As s/he goes through the result set experiment-by-experiment, the researcher may realize that some of the results are of lesser interest, e.g. those that study the impact of aging on gene expression under caloric restriction, or those that consider genetically modified organisms. Some of the results are marginally relevant to any aspect of aging, e.g. experiment E-GEOD-6570, which reported that ‘mice with targeted disruption of ZAS3 are viable with life span comparable to controls’.
The example data exploration experience could be improved if the system were to present results in coherent groups, with each group related to a particular aspect of aging research. So, experiments in group 1 may study the impact of normal aging on gene expression profiles, group 2 may focus on aging in organisms under caloric restrictions and group 3 may consider aging in genetically modified organisms with an altered lifespan. We observe that ArrayExpress already includes information that may facilitate such grouping, namely, the annotations of experiments with terms from the MGED Ontology (MO) (2) and, more recently, the Experimental Factor Ontology (EFO) (3) and Ontology for Biomedical Investigations (OBI) (4) ontologies.
We will describe MGED annotations in some detail in the following section, and we give some examples here. Among the experiments that match the keyword query in the above example, those related to normal aging are annotated with ‘physiological process design’ as ‘Experiment Design Type’, and specify ‘age’ as ‘Experiment Factor Type’. Experiments that investigate gene expression under caloric restriction are typically annotated with ‘growth condition design’ as ‘Experiment Design Type’, and with ‘growth condition’ as ‘Experiment Factor Type’. Finally, experiments that investigate aging in genetically modified organisms are typically annotated with ‘individual genetic characteristics design’ as ‘Experiment Design Type’, and ‘genotype’ as ‘Experiment Factor Type’. This example demonstrates that grouping experiments based on similar annotations can be effective in data exploration and we will support this quantitatively in our experimental evaluation. Another way to help researchers identify relevant experiments is to support query-by-example. A researcher is often able to identify one experiment of interest in the result set, and may use that experiment to look for similar experiments. Here, again, we propose to use ontology annotations, and to compute similarity between experiments based on these annotations. Consider, e.g. experiment E-GEOD-3305, ‘Transcription profiling of rat spinal cord and oculomotor nucleus samples from animals aged 6, 18 and 30 months’, which focuses on normal aging. This experiment is annotated with the following ‘Experiment Design Types’: organism part comparison design, co-expression design, physiological process design and transcription profiling. Using E-GEOD-3305 as the query experiment, we can look for other experiments among the results that carry similar annotations. This includes experiments E-GEOD-3309 and E-GEOD-11097, both also focusing on transcription profiling during normal aging, as does E-GEOD-3305. This demonstrates that annotations may be used effectively in query-by-example, and we will support this intuition quantitatively in our experimental evaluation.
Consider now experiment E-GEOD-11882, ‘Transcription profiling of human normal brain aging reveals sexually dimorphic gene expression’, another experiment related to normal aging and annotated with ‘Experiment Design Type’—‘transcription profiling’. Other experiments in the result set that carry similar annotations are E-GEOD-2110 and E-GEOD-8096; however, these experiments are not directly related to normal aging, or even to any other aspect of aging. Query-by-example is less effective in this case, primarily because the annotations of the query experiment are not rich enough to describe it sufficiently. By reviewing the text description of E-GEOD-11882, we observe that this experiment should also have been annotated with ‘Experiment Design Type’—‘physiological process’ and ‘Experiment Factor Type’—‘age’, both related to normal aging. Adding these annotations allows us to, once again, retrieve experiments that focus on normal aging. This example demonstrates that availability of appropriate annotations directly affects the effectiveness of data exploration methods.
Summary of contributions
In the remainder of this article, we present AnnotCompute, a system for the meta-analysis of repositories of functional genomics experiments like ArrayExpress. AnnotCompute supports two types of exploratory meta-analysis described above—clustering and query-by-example. Both types of meta-analysis rely on a notion of similarity that compares experiments with respect to their intent and content.
Our main contributions are as follows:
We describe an annotation-based approach for computing similarity between experiments that may be used in support of data exploration in large repositories of functional genomics experiments such as ArrayExpress. We rely on existing, retrieval and clustering algorithms, and show that using ontology annotations and text descriptions of experiments can result in an enriched user experience.
We show results of an experimental evaluation of the effectiveness of our data exploration methods, demonstrating that annotation-based similarity, as well as clustering and query-by-example based on this similarity, help users find experiments of interest.
We present AnnotCompute, a live system that implements our data exploration techniques and is available to the scientific community at large.
We also note here that our goal is to support effective data exploration. There is general consensus in the Information Retrieval literature that user-facing data exploration functionality, e.g. ranking and clustering interfaces, is best evaluated with user studies, see, e.g. (5, Chapter 3) and (6, Chapter 8). Different users have different information needs and preferences, and it is unreasonable to expect that, e.g. every single cluster will be of interest to every single user. An effective data exploration system makes information discovery easier, by helping users navigate to parts of the result set that are of potential interest. With this in mind, it is rarely possible to define a gold standard against which to benchmark and evaluate. An evaluation of effectiveness of a data exploration system with a user study allows accounting for varying user preferences, and we take this approach in our work.
Methods
Description of the data set
In this article, we focus on the ArrayExpress Archive (1) that makes use of microarray standards.
The FGED (formerly MGED) Society developed the Minimal Information About a Microarray Experiment (MIAME) standard and the MO to facilitate the sharing and unambiguous interpretation of functional genomics experiments. The MAGE-TAB format supports MIAME and is a simple spreadsheet-based format for describing microarray investigations. A MAGE-TAB document contains two tab-delimited metadata files: Investigation Description File (IDF) and Sample and Data Relationship File (SDRF), which cover the intent and the content of an investigation. An IDF provides general information about an experiment including the protocols used, while an SDRF describes samples and application of protocols, and provides links to data files associated with the samples. Experiments that comprise the ArrayExpress Archive are available in MAGE-TAB format.
AnnotCompute works with the following MAGE-TAB fields:
Experiment Name: title of the experiment in free text.
Experiment Description: description of the experiment in free text.
Experiment Design Types: a collection of ontology terms that provide a high-level description of the experiment. For example, an experiment with ‘co-expression design’ type identifies genes that are coordinately expressed, and may be used to infer a role in a biological process, whereas ‘compound treatment design’ annotates an experiment in which specimens are treated by some compounds.
Experiment Factor Types: a collection of ontology terms that describe the type of factors studied in the experiments. For example, ‘strain or line’ annotates an experiment that studies various strains or cell lines.
Experiment Factor Values: a collection of ontology terms or free text, describing a specific value for a given experiment factor type. A measurement is typically a combination of a number and an ontology term representing the unit. For example, MO terms ‘male’ and ‘female’ may be used as values for factor type ‘sex’, while measurements ‘6 months’ and ‘12 months’ may be used for factor type ‘age’.
Biomaterial Characteristics of Biosources: a description of biomaterial characteristics that may include ontology terms, measurements or free text. For example, NCBI Taxon ontology terms Homo sapiens and Mus musculus may describe the organism to which the biomaterial belongs, whereas Developmental Stage (an MO term) of an organism may be ‘adult’ (also an MO term).
Protocol Types: a collection of ontology terms that describe the types of protocols applied in any step of the experiment, e.g. ‘growth’, ‘nucleic acid extraction’ and ‘labeling’.
Protocol Descriptions: free-text descriptions of protocols used in the experiment.
The MO organizes concepts (classes) into a hierarchical structure. However, MAGE-TAB fields that contain MO terms are typically annotated with instances of these classes, which are among the leaves in the hierarchy.
AnnotCompute uses all fields described above for the initial filtering of results by keyword. Fields containing ontology terms and providing information on the biological intent and content of an investigation are also used to compute dissimilarities between pairs of experiments. As an exception, ‘Protocol Types’ is used for filtering but not for the dissimilarity computation, because this field takes on only a handful of distinct values. We also use ‘Experiment Name’, a text field that can contain additional useful information although not drawn from a controlled vocabulary, for the computation of dissimilarity, by converting it to lowercase, tokenizing its value and removing some common stop-words (Our list of stop-words was constructed manually and contains: a, an, as, or, of, in, on, to, so, the, and, for, who, why, any, from, when, what, over, till, then, such, that, than, whom, whose, since, under, until, during, because). The dissimilarity measures were developed by us specifically for AnnotCompute and are at the heart of the system. We describe these measures in the following section.
Using annotations for meta-analysis
The dissimilarity between e1 and e2 may be computed as the weighted average of percomponent dissimilarities. In the current version of the system, a simple unweighted average of percomponent dissimilarities is taken. Two experiments that carry the same sets of annotations in each component have dissimilarity 0. If all annotations are different, dissimilarity is 1. Allocating a predetermined portion of the score to each component allows us to limit the effect of coincidental overlap in annotations or text keywords on dissimilarity. For example, two experiments with similar keywords in Experiment Name, but with different intent and content, as per ‘Experiment Design Types’, ‘Experiment Factor Types’ and other MAGE-TAB fields, will be considered dissimilar.
We noted earlier that, while a hierarchical structure exists over MO classes, experiments are typically annotated with instances, which are among the leaves. For this reason, we opted for set-oriented dissimilarity measures that do not exploit the structure of the hierarchy. In some cases, where external ontologies are used for annotation, there are opportunities to leverage their hierarchical structure. We plan to investigate alternative dissimilarity measures in a follow-up study.
The architecture of AnnotCompute
Figure 1 presents the system architecture of AnnotCompute. Our system has three components. First, ‘Extractor’ is invoked to download MAGE-TAB files from ArrayExpress, and to extract structured annotations from these files. On 9 June 2010, 12 098 experiments were downloaded from ArrayExpress. Annotations of 10 639 experiments (87%) were extracted successfully. The remaining 13% were not parsed by our system because the IDF or the SDRF portion the MAGE-TAB file were missing, or because at least one required field in the SDRF was left unspecified. One common case where ‘Extractor’ fails is when the SDRF refers to a protocol that is not defined in the IDF.
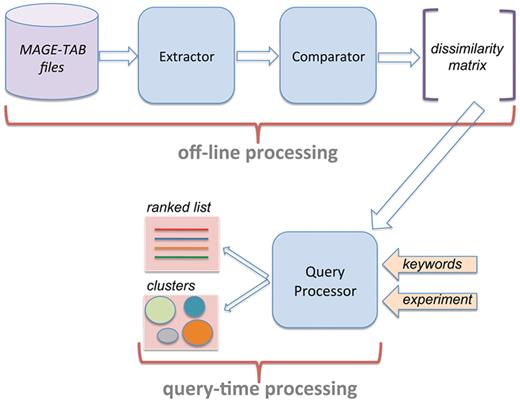
System architecture of AnnotCompute. Off-line processing is executed once a month, and builds a dissimilarity matrix of experiments. This matrix is used at query time to produce a ranked list of results in ‘query-by-example’, or to cluster results in the ‘clustering’ scenario.
Figure 2 presents statistics about the richness of annotations of ArrayExpress experiments. The score is computed as the total number of extracted annotations per experiment, and is plotted on the x-axis. Each MAGE-TAB field that contains one or more valid ontology terms increments the score by 1, whereas fields with terms such as ‘unknown’, ‘none’ and ‘N/A’ do not increment the score. Note that the field ‘Biomaterial Characteristics’ may contain several ontology annotation categories, and so may increment the score by more than 1. A higher annotation score indicates that an experiment is annotated more richly. The percentage of the data set with a given score is plotted on the y-axis. We observe that three or fewer annotations were extracted for about 30% of the experiments, and that the Gene Expression Omnibus Data set (GEOD) portion of ArrayExpress is annotated significantly less richly than the rest, with about 40% of the experiments having three or fewer annotations. As we argued in the ‘Introduction’ section, and as we will demonstrate in the experimental evaluation, richly annotated experiments are better suited for the kind of meta-analysis that AnnotCompute performs.
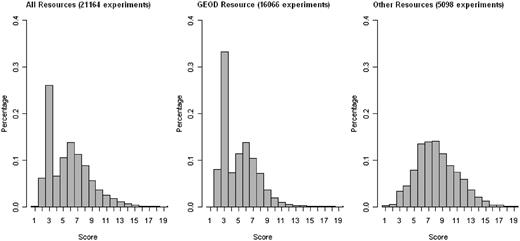
Annotation statistics for the ArrayExpress data set. The score is computed as the total number of extracted annotations per experiment, and is plotted on the x-axis. Each MAGE-TAB field that contains one or more valid ontology terms increments the score by 1, whereas fields with terms such as ‘unknown’, ‘none’ and ‘N/A’ do not increment the score. The field ‘Biomaterial characteristics’ may contain several ontology annotation categories, and so may increment the score by more than 1. A higher annotation score indicates that an experiment is annotated more richly. The percentage of the data set with a given score is plotted on the y-axis. Data used in the figure was downloaded on 1 August 2011.
Having parsed MAGE-TAB files, ‘Extractor’ passes control over to ‘Comparator’, which computes dissimilarity between all pairs of experiments, and records them in a dissimilarity matrix. ‘Extractor’ and ‘Comparator’ are implemented in Perl, and are executed off-line once per month.
The third component, ‘Query Processor’, is invoked when a user submits a query through the web-based interface. As we described in the ‘Introduction’ section, AnnotCompute supports two types of data exploration: clustering and query-by-example. If the user chooses query-by-example, experiments that are similar to the query experiment are retrieved, and up to 100 most similar ones are presented in a ranked list, in a decreasing order of similarity (Similarity is computed as 1—dissimilarity). Results may optionally be prefiltered using one or more keywords. These keywords are evaluated against all extracted fields.
AnnotCompute uses the annotation-based dissimilarity measures described earlier in this section to cluster experiments. Clustering happens at query time, and is implemented in R. In particular, we leverage agglomerative hierarchical clustering with average linkage, as implemented by the R hclust function (8). We experimented with dissimilarity measures based on both Jaccard and Kulczynski distances, and found that they perform comparably. We use Kulczynski distance in the current version of AnnotCompute, because it performed slightly better on the use cases, which we used to tune our system.
Note that hierarchical clustering will always produce at least N clusters, because each experiment in the result is initially assigned to a cluster, and smaller clusters are progressively merged. Thus, it is always possible to select K < N clusters, which are then presented to the user.
Generating cluster descriptions
Whether clustering is useful for data exploration, depends on two properties. First, experiments clustered together should be similar, and those clustered separately should be dissimilar. Second, clusters should be described appropriately, enabling the user to decide whether a particular cluster is worth exploring, given an information need. Thus, generating intuitive cluster descriptions is an important usability criterion. AnnotCompute generates cluster descriptions using two methods, referred to as ‘common annotations’ and ‘tf–idf’. The common annotations method describes each cluster by listing the top-3 most frequent annotations assigned to at least two experiments in the cluster. The ‘tf–idf’ method leverages a popular term weighting technique commonly used in information retrieval and text mining (9). This technique measures how important a term is to a document in a collection. Intuitively, a term is important if it appears frequently in a document (it has a high term frequency, or tf), but infrequently in the corpus as a whole (it has a low document frequency and therefore a high inverse document frequency, or idf). Terms with high ‘tf–idf’ scores can be used to summarize the contents of a document, in a way that focuses on its major themes, and also sets it apart from the rest of the collection. We use ‘tf–idf’ weights to generate cluster descriptions in the following way. Terms correspond to experiment annotations, and to the words appearing in the ‘Experiment Name’ field; these are exactly the features used to compute pairwise dissimilarity between experiments, and on which clustering is based. Clusters of experiments in our setting correspond to documents in the text retrieval setting. AnnotCompute computes ‘tf–idf’ scores of all terms for each cluster, and uses the terms with the top-10 scores to describe each cluster, including also all terms that tie for the 10th highest score. If more than five terms tie for the 10th highest score, we do not display any terms with that score.
Evaluation methodology
Our experimental evaluation is based on the case studies in which an expert user states an information need by posing a keyword query. AnnotCompute retrieves all experiments that match the keyword query, which typically corresponds to a superset of the relevant documents. The user then manually evaluates the quality of ranking or of clustering.
Evaluating ranking
The quality of ranking is evaluated by considering the relevance of individual experiments, and the user quantifies this by assigning a relevance score based on the title and the description of the experiment. A score of 2 means that the experiment satisfies the user's information need precisely, a score of 1 is assigned to experiments that are on the general subject of the query, but are not an exact match. A score of 0 is assigned to irrelevant experiments. We will explain particulars of score assignment in each case study. In query-by-example, the user considers all experiments that match the keyword query, and identifies an experiment that satisfies his information need precisely from among the matches (i.e. with a relevance score of 2). He then uses it as the query experiment, assigns a relevance score to each of the top-10 matches returned by AnnotCompute, and records these as a gain vector G, with vector positions corresponding to the rank of the result. For example, if experiments at ranks 1–5 in the top-10 list have a relevance score of 2, and the remaining five experiments have a score of 1, the gain vector is G = [2, 2, 2, 2, 2, 1, 1, 1, 1, 1]. We use G to compute normalized discounted cumulated gain (NDCG), a measure commonly used in information retrieval to quantify the quality of ranked lists (10). NDCG compares scores of items in a gain vector corresponding to a ranked list of length N, with those of an ideal vector I, corresponding to the best possible ranked list of the same length. The measure models the intuition that a list of high quality has high-scoring results appearing at early ranks. NDCG values range from 0 to 1, with 1 corresponding to the best possible outcome.
Evaluating clustering
In the clustering scenario, we also rely on evaluations by expert users to assess quality. All clustering outcomes were evaluated by six users, and we report the average quality score for each cluster. All users were bioinformaticians or biologists with experience in bioinformatics, and had a graduate level of education. Four of the six users were not involved in any aspect of the AnnotCompute project prior to participating in the evaluation. The users considered cluster descriptions generated by AnnotCompute, and rated these descriptions on a three-point scale, with 2 being the best possible score, and 0 being the worst. We now describe these scores in detail.
A score of 2 is assigned to clusters with coherent and accurate descriptions. A cluster description is coherent if the user is clearly able to tell, by looking at the description, what types of experiments the cluster contains, and in particular whether the cluster contains experiments of interest. A cluster description is accurate if, after inspecting the contents of the cluster, the user agrees that cluster description accurately represents cluster contents. Clusters with a score of 2 are judged by the user to be very helpful in data exploration.
A score of 1 is assigned to clusters with somewhat coherent or somewhat accurate descriptions, or both. A cluster is somewhat coherent if the user can tell to some extent what types of experiments the cluster contains, but needs to navigate to the cluster and see its contents before he can safely decide whether it contains any experiments of interest. A cluster description is somewhat accurate if it represents the contents of the cluster reasonably well, but does not fully capture the main commonalities between the experiments that belong to that cluster, and that set it apart from other clusters. Clusters with a score of 1 make data exploration easier by helping the user focus on a set of potentially interesting clusters, but are less helpful than clusters with a score of 2.
Finally, a score of 0 is assigned to clusters with incoherent or inaccurate descriptions. With incoherent cluster descriptions the user cannot determine, by looking at the description alone, what types of experiments the cluster contains. A cluster description is inaccurate if it does not adequately describe the experiments in the cluster. In this case, the user may miss out on some interesting experiments, and so clusters with a score of 0 may hinder data exploration.
Results
We now describe results of an experimental evaluation of the effectiveness of AnnotCompute. We consider several use cases for both query-by-example and clustering scenarios, and show that AnnotCompute enriches the user experience, particularly for well-annotated experiments. Note that, because AnnotCompute is a live system, and its data set is being updated on a monthly basis, the results in the current version of AnnotCompute may differ slightly from the results described in this section.
Query by example
We evaluated the effectiveness of query-by-example with three use cases. Table 1 summarizes our findings, and we also describe them below.
Effectiveness of ‘query-by-example’
| Use case | Query experiment | NDCG |
|---|---|---|
| Metastasis | E-GEOD-2280 | 0.98 |
| Metastasis | E-GEOD-2685 | 1 |
| Metastasis | E-GEOD-15641 | 0.68 |
| Insulin | E-MEXP-867 | 0.613 |
| Insulin | E-TABM-141 | 0.641 |
| Insulin | E-GEOD-11484 | 0.203 |
| Aging | E-GEOD-3305 | 0.817 |
| Aging | E-GEOD-11882 | 0.055 |
| Aging | E-GEOD-3305 (enriched) | 0.944 |
| Aging | E-GEOD-11882 (enriched) | 0.894 |
Effectiveness of ‘query-by-example’ for three use cases and for several query experiments. Effectiveness is measured by NDCG, which ranges from 0 to 1, with a score of 1 corresponding to highest possible effectiveness.
Case 1: ‘Metastasis’
The user is interested in experiments that investigate the molecular mechanism of metastasis in human cancer. The user issues the query ‘metastasis and human’, retrieving 123 experiments. Experiments that match the user's information need precisely receive a relevance score of 2. Experiments that are related to metastasis but do not focus on human cancer receive a relevance score of 1. Experiments that are not related to metastasis have a relevance score of 0. To measure NDCG at top-10, we construct the ideal vector I = [2, 2, 2, 2, 2, 2, 2, 2, 2, 2], because there are at least 10 experiments with a relevance score of 2 among the results. Three query examples with relevance scores of 2 were randomly chosen due to the large number of candidates.
Using E-GEOD-2280 (an experiment with a relevance score of 2) as the query experiment, AnnotCompute retrieves a list of similar experiments, sorted in decreasing order of dissimilarity. Among the top-10 experiments, 9 have a score of 2, and one (at rank 8) has a score of 0 and we compute NDCG = 0.980 using the ideal vector I above for normalization. Using E-GEOD-2685 (an experiment with a relevance score of 2) as the query experiment, we find that all experiments in the top-10 are highly relevant, giving a perfect NDCG = 1. Finally, using E-GEOD-15641 (an experiment with a relevance score of 2) as the query experiment, we find that seven experiments in the top-10 have a score of 2, one has a score of 1, and two have a score of 0, for NDCG = 0.680.
We conclude that AnnotCompute is effective in identifying highly relevant experiments in this case. Further, by considering the annotations of the query experiments, we observe that E-GEOD-2280 and E-GEOD-2685 are more richly annotated than the E-GEOD-15641, leading to higher quality of ranking. We will study the impact of the richness of annotations on ranking quality in the following subsection.
Case 2: ‘Insulin’
The user is interested in experiments that investigate glucose-stimulated insulin secretion (GSIS). He issues a query ‘insulin and glucose’ that matches 75 experiments. Of these, 9 focus on GSIS and receive a relevance score of 2, 37 study other aspects related to type 2 diabetes, affected tissues and metabolism and have a score of 1 and the remaining 29 have a score of 0. The ideal vector for NDCG is [2, 2, 2, 2, 2, 2, 2, 2, 1, 1] in this case, since the query experiment is not part of the result, and so at most, eight experiments in the top-10 can have a score of 2.
Using E-MEXP-867 as the query experiment, AnnotCompute retrieved two experiments with relevance score of 2 among the top-10 (ranks 1 and 5), four experiments had a score of 1 and the remaining four had a score of 0. We compute NDCG = 0.613. With E-TABM-141 as the query experiment, two highly relevant experiments are retrieved among the top-10 (ranks 1 and 6), five had a score of 1 and the remaining three have a score of 0, for NDCG = 0.641. Finally, using E-GEOD-11484 as the query, no experiment among the top-10 had a score of 2, five had a score of 1 and the remaining five—a score of 0, for NDCG = 0.203. The average NDCG for the nine experiments with relevance score of 2 was 0.447.
We conclude that using experiments E-MEXP-867 and E-TABM-141 allows us to retrieve relevant experiments among the top-10. By considering the annotations of the query experiments we, once again, observe that E-MEXP-867 and E-TABM-141 are annotated more richly than E-GEOD-11484, leading to higher quality of ranking.
Case 3: ‘Aging’
In our final use case, we consider a user who is interested in retrieving experiments that consider the impact of normal aging on gene expression profiles during the lifespan of an organism. The user issues a query ‘longevity or lifespan or life span’, retrieving 48 experiments. Of these, seven focus on normal aging (relevance score = 2), seven investigate the impact of aging on gene expression under caloric restriction (relevance score = 1) and nine consider aging in genetically modified organisms (relevance score = 1). The remaining 25 experiments bear limited relevance to aging of gene expression profiles (relevance score = 0). Thus, to measure NDCG at top-10, we define the ideal vector I = [2, 2, 2, 2, 2, 2, 1, 1, 1, 1]; note that only six entries have a score of 2, since the query experiment itself is not returned as a result, and is thus removed from the list.
Selecting E-GEOD-3305 as the query experiment, we use AnnotCompute to retrieve a list of similar experiments. We observe that four experiments in the top-10 describe normal aging, four are from the two other aging related groups and two are not related to aging of gene expression profiles. We compute NDCG = 0.817 in this case. Using experiment E-GEOD-11882 as the query and considering the top-10 results, we find that one experiment (at rank 6) has a score of 2, one (at rank 8) has a score of 1 and 8 are not related to aging of gene expression profiles and have a score of 0. We compute NDCG = 0.055. We reviewed annotations of all 48 experiments in the result set and found that some were not sufficiently well-annotated, and that E-GEOD-11882 was among the poorly annotated experiments, limiting the effectiveness of AnnotCompute. The average NDCG for the seven experiments with relevance score of 2 was 0.559.
Clustering
In the final part of our evaluation, we study the effectiveness of AnnotCompute for clustering. Clustering is carried out with the default number of clusters per use case, as per Equation (3).
Case 1: ‘Metastasis’
In this experiment, six users evaluated clustering quality for the query ‘metastasis or metastatic’. The query returns 237 experiments. According to Equation (3), AnnotCompute clusters the result set into K = 10 clusters by default. Of these, seven clusters contain two or more experiments, and we present their descriptions in Table 2, along with an average per-cluster quality score. Average quality scores ranged from 0.8 to 1.5. Six out of seven clusters received a score of at least 1, and so were deemed helpful by the users for data exploration. The average quality score, across all clusters and all users, was 1.2. Cluster 6 received the highest average quality score of 1.5. This cluster contains two experiments, both studying human colon cancer, which is accurately reflected in the cluster description.
Clusters for the ‘Metastasis’ use case
| Size | Quality | Description | |
|---|---|---|---|
| 1 | 142 | 1.3 |
|
| 2 | 36 | 1.3 |
|
| 3 | 35 | 1 |
|
| 4 | 12 | 1.2 |
|
| 5 | 5 | 1.3 |
|
| 6 | 2 | 1.5 |
|
| 7 | 2 | 0.8 |
|
| Size | Quality | Description | |
|---|---|---|---|
| 1 | 142 | 1.3 |
|
| 2 | 36 | 1.3 |
|
| 3 | 35 | 1 |
|
| 4 | 12 | 1.2 |
|
| 5 | 5 | 1.3 |
|
| 6 | 2 | 1.5 |
|
| 7 | 2 | 0.8 |
|
Clustering result for the query ‘metastasis or metastatic’. ‘Size’ is the number of experiments in a cluster. ‘Quality’ is the average quality score assigned to a cluster by users; it ranges from 0 (worst) to 2 (best).
Clusters 1, 2 and 5 were also considered by users to be of high quality, with an average score of 1.3. Cluster 1 is the largest, containing 142 experiments, all involving human samples. The majority of the experiments in this cluster investigated gene expression profiling using microarray. However, the cluster also contains several experiments that performed array comparative genomic hybridization (CGH), thus making the cluster less cohesive. Cluster 2 mostly contains experiments that study metastasis in genetically modified mouse or rat samples. However, the cluster description does not help determine the biological question being studied. Cluster 5 contains five experiments that use human samples and CGH. All experiments in this cluster are related to metastasis. However, similarly to Cluster 2, the cluster description did not reveal its biological content.
Clusters 3 and 7 had the lowest scores (1 and 0.8, respectively). Experiments in both clusters studied the binding site of transcription factors that relate to metastasis formation, using human samples and ChIP-chip tiling arrays. The description of Cluster 3 did not describe its biological meaning, and also did not reveal how it is different from other clusters. According to their descriptions and content, Clusters 3 and 4 are very similar and should have been clustered together.
Case 2: ‘Insulin’
We now consider the result of clustering 75 experiments that match the keyword query ‘insulin and glucose’ into eight clusters [the default number of clusters as per Equation (3)]. Of these, six contain two or more experiments, and we present these clusters in Table 3, along with average quality scores. Here, again, we observe that five out of six clusters have an average quality score of at least 1. The average quality score, across all clusters and all users, was 1.5.
Clusters for the ‘Insulin’ use case
| Size | Quality | Description | |
|---|---|---|---|
| 1 | 38 | 1.7 |
|
| 2 | 16 | 1.7 |
|
| 3 | 13 | 1 |
|
| 4 | 2 | 0.8 |
|
| 5 | 2 | 1.7 |
|
| 6 | 2 | 2 |
|
| Size | Quality | Description | |
|---|---|---|---|
| 1 | 38 | 1.7 |
|
| 2 | 16 | 1.7 |
|
| 3 | 13 | 1 |
|
| 4 | 2 | 0.8 |
|
| 5 | 2 | 1.7 |
|
| 6 | 2 | 2 |
|
Clustering result for the query ‘insulin and glucose’. ‘Size’ is the number of experiments in a cluster. ‘Quality’ is the average quality score assigned to a cluster by users; it ranges from 0 (worst) to 2 (best).
Cluster 6 has the highest score (2), and contains two experiments. The two experiments are related: they have the same contact listed, and both study diabetes biomarker disease progression in rats (one in liver, and one in adipose tissue). Clusters 1, 2 and 5 also scored high (all 1.7). Cluster 1 is the largest and contains the majority of experiments investigating glucose-sensitive insulin secretion. The cluster also includes some irrelevant experiments (e.g. treatment of astrocytes with tetrahydrocannabinol), but there is a common overall theme of experiments involving genetic modifications and/or drug treatments of model organisms (mostly mouse). Cluster 2 primarily contains experiments with human samples in relation to disease with many, but not all related to diabetes and insulin resistance/sensitivity. Cluster 5 contains two experiments, both involving dietary lipids and effects on growth, although in different species and tissues.
Case 3: ‘Aging’
Keyword query ‘longevity or lifespan or life span’ matches 48 experiments, which are grouped into six clusters by AnnotCompute. Of these, five contain two or more experiments, and we present them in Table 4, along with average quality scores. Observe that three out of five clusters were deemed by the users to be useful in data exploration, with a score of 1 or higher. The average quality score, across all clusters and all users, was 1.
Clusters for the ‘Aging’ use case
| Size | Quality | Description | |
|---|---|---|---|
| 1 | 32 | 1.7 |
|
| 2 | 6 | 0.2 |
|
| 3 | 4 | 1.7 |
|
| 4 | 3 | 0.7 |
|
| 5 | 2 | 1 |
|
| Size | Quality | Description | |
|---|---|---|---|
| 1 | 32 | 1.7 |
|
| 2 | 6 | 0.2 |
|
| 3 | 4 | 1.7 |
|
| 4 | 3 | 0.7 |
|
| 5 | 2 | 1 |
|
Clustering result for the query ‘longevity or life span or lifespan’. ‘Size’ is the number of experiments in a cluster. ‘Quality’ is the average quality score assigned to a cluster by users; it ranges from 0 (worst) to 2 (best).
Clusters 1 and 3 have the highest quality score (1.7). Cluster 1 is the largest containing 32 experiments. Based on its description, experiments in this cluster are related to longevity studies and caloric restriction (diet). Indeed, Cluster 1 contains experiments that study transcription profiling under normal aging or caloric restriction during the lifespan of an organism. All four experiments of Cluster 3 examine gene expression in genetically modified organisms with altered life span, compared with that of wild-type. Cluster 2 had the lowest score (0.2). Four out of six experiments in this cluster were not related to the study of aging mechanisms and were pairwise dissimilar. The description of this cluster did not give much information about its contents, likely due to the cluster being heterogeneous.
Extended evaluation
In the final part of our evaluation, we demonstrate the effectiveness of clustering on a larger set of queries, but with fewer judgments per query. In the three use cases described above, we collected evaluations for three queries, from six users per query. In the remainder of this section, we describe effectiveness results for 10 additional queries, with each query being evaluated by one user. All evaluators are unaffiliated with our project and have no knowledge of the implementation details of AnnotCompute. Results of this part of our evaluation are presented in Table 5. Users chose which queries to execute, and their queries returned between 12 and 199 experiments. Users then rated all clusters that had more than one experiment assigned to them, called nonsingleton in Table 5. Recall that clusters that contain a single experiment are trivially coherent and accurately described, i.e. have a quality score of 2. We exclude such clusters from our evaluation so as not to inflate average quality scores.
Effectiveness of clustering for the extended evaluation
| Query | Size | Number of clusters | Quality | |||
|---|---|---|---|---|---|---|
| Total | Nonsingleton | Minimum | Maximum | Average | ||
| Alzheimer | 34 | 5 | 5 | 1 | 2 | 1.2 |
| Autism | 12 | 3 | 3 | 1 | 2 | 1.7 |
| Cell and cycle and arrest | 30 | 5 | 4 | 1 | 2 | 1.5 |
| Enhancer and promoter | 27 | 5 | 5 | 1 | 2 | 1.4 |
| Flow and cytometry | 119 | 10 | 5 | 1 | 2 | 1.8 |
| Melanoma | 108 | 10 | 7 | 1 | 2 | 1.7 |
| Menin | 56 | 7 | 5 | 1 | 2 | 1.2 |
| Methylation | 199 | 10 | 10 | 1 | 2 | 1.3 |
| Migration | 119 | 10 | 5 | 1 | 2 | 1.2 |
| Olfactory | 46 | 6 | 4 | 2 | 2 | 2 |
| Average | 1.5 | |||||
Results of an evaluation of the effectiveness of clustering for 10 queries. In the table, ‘size’ is the total number of experiments returned by the query. We report both the total number of clusters and the number of ‘nonsingleton clusters’, which contain at least two experiments. ‘Quality’ is the quality score averaged across nonsingleton clusters, on a scale from 0 (worst) to 2(best).
Quality of individual clusters ranged between 1 and 2. No cluster was assigned a quality score of 0 by the evaluators, indicating that all clusters discovered and presented by AnnotCompute were deemed to be helpful for data exploration. Per-query average quality of nonsingleton clusters ranged between 1.2 and 2; average quality across all queries was 1.5.
Discussion
The data exploration approaches supported by AnnotCompute rely on pairwise comparisons between experiments based on intent and content. This has naturally led us to utilize an annotation-based approach, as opposed to a data-based one. Moreover, in this context, a data-based approach would have not been feasible. In general, it is difficult to put data from different experiments on equal footing. In fact, when the platform utilized is a microarray, it can be challenging to put on equal footing even data from assays within the same experiment. There are various normalization approaches that have been proposed, but any such approach typically relies on certain biological assumptions that one makes on the samples at hand and the genes monitored by the microarray. There is no single approach that works in all cases. When one seeks to integrate data from different experiments, the challenges become even greater and, in order to apply a reasonable integration, it is typically necessary to impose some constraints (e.g. focus on one particular platform) and to apply a certain amount of curation [e.g. see (11)]. In our case, the inputs are experiments from a large repository, spanning a variety of platforms, samples and intents. Moreover, an experiment typically comprises multiple assays spanning different conditions. Besides the difficulties in putting data from assays in different experiments on equal footing, there is also no obvious way to combine the data from the assays within any experiment in a meaningful fashion that represents that experiment as a whole. Thus, an annotation-based approach also makes the most sense for our purposes.
In this article, we presented how meta-analysis of annotations can be used to enrich the user experience in the context of ArrayExpress. Similar repositories that make use of MAGE-TAB [e.g. CaArray (12)] would also benefit from this approach. However, our approach can be extended to other kinds of experiments with standardized annotations. For example, GWAS Central at www.gwascentral.org (13) provides a listing of experiments in a tab-delimited format with analogous fields (study_name, study_design, title, phenotype_tested, platform) including ones that appear to use controlled terminology (study_design, phenotype_tested, platform). The ‘Extractor’ component of AnnotCompute would need to be adjusted for the different fields for comparison but once passed to the ‘Comparator’ component, further processing should be the same. This example is meant to illustrate how AnnotCompute could be applied but the utility for GWAS Central or other repositories would need to be evaluated with use cases. Further, and importantly, we do not assume that any particular ontology or controlled vocabulary is used to annotate experiments, or that a community-wide consensus exists as to the appropriate usage of terms for annotation. Rather, our goal was to demonstrate that local, context-based agreement on annotations can already lead to a better user experience.
Techniques presented in the article have been applied primarily to MO annotations of ArrayExpress experiments. However, there is nothing specific to MO in our approach. New ontologies, such as EFO (3) and OBI (4), are currently emerging, with the goal to complement or replace MO, and AnnotCompute will automatically leverage these annotations as their use in ArrayExpress becomes widespread.
As we demonstrated in our evaluation, AnnotCompute can be effective as a data exploration tool, particularly in cases where experiments are annotated sufficiently well. Lack of appropriate annotations is an important factor that limits the effectiveness of our system in many other cases. We hope that the adoption of AnnotCompute and of other meta-analysis tools by the scientific community will serve as an in incentive for more judicious annotation of experiments.
To establish the gain of improved annotation, we focused on Case 3 ‘Aging’. This use case returned a manageable number of total matches, making it feasible to manually enrich annotations of all experiments, as appropriate. According to descriptions and comments provided in the SDRF files, we manually enriched the annotations of some experiments and corrected some inappropriate annotations. We enriched the annotations of experiments in the result set consistently, irrespective of whether they were used as a query experiment and of their rank. A representative set of MAGE-TAB documents for this use case, before and after enrichment, is available at the AnnotCompute download site (http://www.cbil.upenn.edu/downloads/AnnotCompute).
Using experiment E-GEOD-3305 as the query, we achieved NDCG = 0.944 after enrichment, as compared with NDCG = 0.817 before enrichment, a noticeable improvement. For experiment, E-GEOD-11882, the difference was even more considerable: NDCG = 0.894 after enrichment, compared with only 0.055 before. We conclude that availability of rich annotations leads to an improvement in the quality of ranking in our use case.
Some examples of our enrichment procedure are described below. In E-GEOD-11882, organism part, age and sex were provided in the description of the experiment, but were not among its annotations. We thus added the following ‘Biomaterial Characteristics’ to the SDRF: ‘organism part’, ‘sex’ and ‘age’, along with the corresponding values. Additionally, while the experiment investigated gene expression profiles in samples extracted from different organism parts, sexes and ages, the IDF only indicated ‘transcription profiling’ as ‘Experiment Design Type’, and did not include appropriate ‘Experiment Factor Type’ annotations. We thus, added ‘organism part comparison design’, ‘sex design’ and ‘physiological process design’ to the list of ‘Experiment Design Types’. The corresponding ‘Experiment Factor Types’—organism part, sex and age were added as well along with the appropriate factor values.
As another example of enrichment consider E-GEOD-13753, an experiment that investigates transcription profiling in wild-type and knockout mice at various developmental stages. In addition to ‘transcription profiling’, annotations ‘development or differentiation design’, ‘individual genetic characteristics design’ and ‘genetic modification design’ should also be added as ‘Experiment Design Types’, with ‘developmental stage’ and ‘individual genetic characteristic’ provided as ‘Experiment Factor Types’.
In several other experiments, ‘growth condition’ was specified as ‘Experiment Factor Type’, which was not sufficiently specific. The MGED Ontology provides several experimental factor types associated with growth condition design, including ‘atmosphere’, ‘nutrients’ and ‘temperature’. For example, experiment E-GEOD-9217 examines transcription profiling of yeast grown at different levels of glucose. ‘Experiment Factor Type’—‘nutrients’ is a more accurate term to use than growth condition in this experiment. Experiment E-MEXP-1506 investigates cellular senescence by examining transcription profiling of human stem cells grown at different oxygen levels, and ‘Experiment Factor Type’—‘atmosphere’ is a more appropriate annotation for this experiment.
As a final example of the effectiveness of enrichment, consider E-MEXP-1506, an aging related experiment that does not bear high similarity to query experiment E-GEOD-11882. Before enrichment, E-MEXP-1506 was among the top-10 most similar experiments to the query; it was ranked below the top-10 after enrichment.
Related work
ArrayExpress (1) and GEO (14) are two large repositories of functional genomics experiments. GEO supports two interfaces to its repository—query (by data set, gene profiles and accession number) and browsing. ArrayExpress likewise, provides query functionality where experiments may be located by keywords, citation, sample and factor annotations. Additionally, ArrayExpress gives access to the Gene Expression Atlas, allowing users to find experiments in which particular genes are differentially expressed, under certain conditions and in certain organisms. A recent data exploration tool is GEOmetadb (15), a GEO microarray search tool that leverages the metadata associated with samples, platforms and data sets. The ArrayExpress and GEOmetadb search interfaces do not allow for either similarity search between experiments, as in our query-by-example, or meta-analysis, as in the clustering approach of AnnotCompute.
Sophisticated tools have been built for querying genomic databases [reviewed in Ref. (16)] such as BioMart, EcoCyc, InterMine and the WDK Strategies. These employ various approaches to select, filter or combine databases entries (e.g. genes). Annotations in those systems are treated as individual fields (attributes) or as parts of objects and users select what are desired values to get returned a list of data. AnnotCompute does use keywords to filter but its main approach is to provide what is similar (as opposed to what has the specified values of attributes).
An annotation-based approach for clustering experiments has also been used earlier (17). In that work, the authors start with about 450 GEO Data Sets (i.e. experiments) and parse the GEO free-text annotations to map to concepts from the Unified Medical Language System (UMLS), so that a standardized vocabulary can be used. Hence, each experiment is associated with a binary vector with a 0 or 1 for each UMLS concept according to whether or not the experiment annotation maps to that concept. These vectors are then used as inputs to hierarchical clustering in R with a binary dissimilarity (which coincides with Jaccard). Our approach is similar in spirit, but leverages the already standardized annotations of ArrayExpress experiments with ontology terms that were developed specifically to annotate functional genomics experiments (like the MGED Ontology). One of the reasons to develop these ontologies was to minimize the use of free text, which is difficult to parse and mine, so as to facilitate the exchange of information about experiments. Our approach allows us to assess, to what extent these ontologies facilitate annotation-based comparisons. Like in Ref. (16), our dissimilarity measures are based on binary data (presence or absence of an annotation) but, instead of pulling together all annotation terms for one experiment, we group them according to annotation components. This has allowed us to experiment with different weights on the various annotation components.
Conclusion
We presented AnnotCompute, an on-line information discovery and meta-analysis tool for repositories of functional genomics experiments.
Our tool supports two types of data exploration—query-by-example and clustering. We demonstrated that annotations of experiments may be leveraged to enrich a user's data exploration experience. We also gave examples of cases where richer annotations would lead to a better user experience. We believe that tools such as AnnotCompute may provide a powerful incentive for richer annotations of functional genomic experiments in ArrayExpress and in other repositories.
The focus of our work is not on developing novel retrieval and clustering algorithms, but rather on demonstrating that experiment annotations may be used as features by standard existing techniques. Seeing whether more advanced retrieval and clustering techniques will result in a more effective data exploration experience is an interesting direction for future work.
Funding
The National Human Genome Research Institute (R21 HG004521 to J.Z., E.M., J.L., and C.J.S); the National Science Foundation (CIFellows 0937060 to J.S.). Funding for open access charge: The National Human Genome Research Institute (R21 HG004521).
Conflict of interest. None declared.
Acknowledgements
We thank the external evaluators who participated in our user study for helping assess the effectiveness of AnnotCompute.
