1-20 of 9104
Select how you would like to sort the search results
Journal Article
Review of autism spectrum disorder databases for the identification of candidate genes Open Access
Diana Martínez-Minguet and others
Database, Volume 2025, 2025, baaf067, https://doi.org/10.1093/database/baaf067
Published: 15 October 2025
Image
Advanced search filter used to search the PubMed information source. Open Access
Published: 15 October 2025
Figure 2.
Advanced search filter used to search the PubMed information source.
Image
Host distribution of bacterial pathogens. (a) Brucella hosts: Bos taurus, H... Open Access
Published: 15 October 2025
Figure 2.
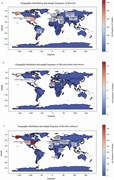
Host distribution of bacterial pathogens. (a) Brucella hosts: Bos taurus, H. sapiens , and O. aries are the primary hosts, reflecting zoonotic transmission routes. (b) Mycobacterium tuberculosis hosts: Bos taurus dominate, indicating limited host range. (c) Bacillus anthracis hosts: H. s
Image
Global distribution of bacterial pathogens. For each panel, the world map d... Open Access
Published: 15 October 2025
Figure 3.
Global distribution of bacterial pathogens. For each panel, the world map displays the number of isolates collected from each country. The fill of each country represents isolate frequency on a continuous scale. The colour bar provides a quantitative reference for frequency values, with the maximum
Image
The phylogenetic relationships between various species of Brucella. Open Access
Published: 15 October 2025
Figure 4.
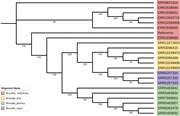
The phylogenetic relationships between various species of Brucella .
Image
Distribution of genes among the four databases. These representations suppo... Open Access
Published: 15 October 2025
Figure 4.
Distribution of genes among the four databases. These representations support the CDL—Fig. 4(a)—and consistency—Fig. 4(b)—metrics.
Image
Methods workflow. Methods and research questions addressed in this study. Open Access
Published: 15 October 2025
Figure 1.
Methods workflow. Methods and research questions addressed in this study.
Image
Systematic Mapping Study flow-chart. Open Access
Published: 15 October 2025
Figure 3.
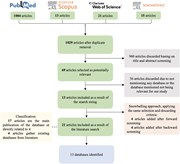
Systematic Mapping Study flow-chart.
Image
Species distribution of bacterial pathogens. (a) Brucella species distribut... Open Access
Published: 15 October 2025
Figure 1.
Species distribution of bacterial pathogens. (a) Brucella species distribution: B. melitensis (58%) and B. abortus (22%) dominate. (b) Mycobacterium tuberculosis species distribution: M. tuberculosis variant bovis accounts for 100% of detected species. (c) Bacillus anthracis species dist
Journal Article
Zoonosis: a comprehensive database of zoonotic pathogens Open Access
Boyuan Zhang and others
Database, Volume 2025, 2025, baaf062, https://doi.org/10.1093/database/baaf062
Published: 15 October 2025
Image
A summary schematic of the key genes involved in the absorption, transport,... Open Access
Published: 01 October 2025
Figure 1.
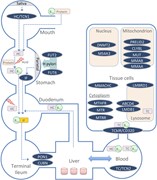
A summary schematic of the key genes involved in the absorption, transport, and metabolic utilization of B 12 across different body compartments. TCN1: transcobalamin I (haptocorrin); TCN2: transcobalamin II; GIF: gastric intrinsic factor (IF); FUT2: fucosyltransferase 2; FUT6: fucosyltransferase 6
Image
A schematic workflow of data collection and database integration for CobVar... Open Access
Published: 01 October 2025
Figure 2.
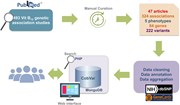
A schematic workflow of data collection and database integration for CobVar database.
Image
An overlap analysis of genetic variant associations across B12 traits. Open Access
Published: 01 October 2025
Figure 3.
An overlap analysis of genetic variant associations across B 12 traits.
Image
Distribution of genes reported to be associated with different B12 traits: ... Open Access
Published: 01 October 2025
Figure 4.
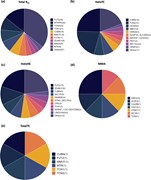
Distribution of genes reported to be associated with different B 12 traits: (a) total plasma/serum B 12 , (b) holoTC (active B 12), (c) holohaptocorrin (holoHC), (d) MMA, and (e) total transcobalamin (totalTC) levels. The number in parentheses next to each gene name represents the count of reported
Image
Screenshots of the CobVar database application featuring the Home page, and... Open Access
Published: 01 October 2025
Figure 5.
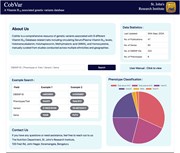
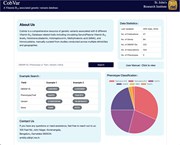
Screenshots of the CobVar database application featuring the Home page, and the different search query formats that can be used by the user.
Image
Screenshots of (a) the expanded database query results, (b) the detailed vi... Open Access
Published: 01 October 2025
Figure 6.
Screenshots of (a) the expanded database query results, (b) the detailed view of the Variant section, and (c) the Association section.
Journal Article
CobVar—a comprehensive resource of vitamin B12-associated genomic variants Open Access
Neha H Suresh and others
Database, Volume 2025, 2025, baaf049, https://doi.org/10.1093/database/baaf049
Published: 01 October 2025
Image
Comparison of average F1 scores across different dataset sizes for the thre... Open Access
Published: 30 September 2025
Figure 3.
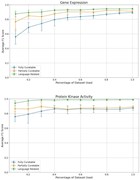
Comparison of average F1 scores across different dataset sizes for the three curation tasks: Task 1 (fully curatable), Task 2 (partially curatable), and Task 3 (language related) for the gene expression and protein kinase activity datasets.
Image
Current and planned integration of sentence classification output into cura... Open Access
Published: 30 September 2025
Figure 4.
Current and planned integration of sentence classification output into curation workflows. (A) Extracted sentences identified as fully or partially curatable are presented to professional curators via a dedicated interface, allowing for rapid evaluation and annotation of key data types. (B) Future i
Journal Article
Navigating open-source waters: the pharmaceutical industry’s role in bioontology development Open Access
Shawn Zheng Kai Tan and others
Database, Volume 2025, 2025, baaf066, https://doi.org/10.1093/database/baaf066
Published: 30 September 2025


