


Abstract
The rapid advancement of sequencing technology, including next-generation sequencing (NGS), has greatly improved sequencing efficiency and decreased cost. Consequently, huge amounts of genomic, transcriptomic and epigenetic data concerning cotton species have been generated and released. These large-scale data provide immense opportunities for the study of cotton genomic structure and evolution, population genetic diversity and genome-wide mining of excellent genes for important traits. However, the complexity of NGS data also causes distress, as it cannot be utilized easily. Here, we presented the cotton omics data platform COTTONOMICS (http://cotton.zju.edu.cn/), an easily accessible web database that integrates 32.5 TB of omics data including seven assembled genomes, resequencing data from 1180 allotetraploid cotton accessions and RNA-sequencing (RNA-seq), small RNA-sequencing (smRNA-seq), Chromatin Immunoprecipitation sequencing (ChIP-seq), DNase hypersensitive sites sequencing (DNase-seq) and Bisulfite sequencing (BS-seq). COTTONOMICS allows users to employ various search scenarios and retrieve information concerning the cotton genomes, genomic variation (Single nucleotide polymorphisms (SNPs) and Insertion and Deletion (InDels)), gene expression, smRNA expression, epigenetic regulation and quantitative trait locus (QTLs). The user-friendly web interface offers a variety of modules for storing, retrieving, analyzing and visualizing cotton multi-omics data to diverse ends, thereby enabling users to decipher cotton population genetics and identify potential novel genes that influence agronomically beneficial traits.
Database URL: http://cotton.zju.edu.cn
Introduction
Cotton (Gossypium spp.) is the most important fiber and oil crop in the world; it is also an excellent genetic materials model for studying the polyploid genome and heterosis. With the rapid advancement of next-generation sequencing (NGS) technology and progressive decreases in sequencing cost and time, an ever-increasing and ever-more-unwieldy quantity of cotton genomic, transcriptomic, epigenomic and other omics data has been produced and made publicly available. This wealth of data enables researchers to investigate cotton evolution, domestication, germplasm genetic divergences and the molecular mechanisms controlling important agronomic traits such as yield and fiber quality; however, the sheer depth and detail of omics data make their effective and efficient utilization inherently difficult for both biologists and breeders. Therefore, an accessible and comprehensive web database for storing, retrieving, analyzing and visualizing cotton multi-omics data is urgently needed.
As previously reported, several cotton databases are available online: COTTONGEN provides storage and search capabilities for genomic data and genetic markers; ccNET mainly provides search interfaces, such as in querying references for cotton transcriptome expression and cotton gene co-expression; CottonFGD focuses on the searching and visualization of genomic and expression data; and MaGenDB provides complete genomic functional annotations and transcriptomic and epigenomic analysis results for multiple members of the Malvaceae, along with a variety of online bioinformatic tools (1–4). However, these existing databases are not well integrated with currently released big data for cotton, especially with regard to the mining of genomic variations (SNPs and InDels) among allotetraploid cotton populations, which are essential in the discovery of potential novel genes governing agronomically beneficial traits. In this study, we built a more comprehensive cotton multi-omics database named COTTONOMICS (http://cotton.zju.edu.cn/), which collects together and analyzes huge cotton omics datasets including genome annotations, genomic variation, gene expression, miRNAs and epigenetic data. Furthermore, COTTONOMICS contains a variety of modules for storing, retrieving, analyzing and visualizing cotton multi-omics data; to better support cotton researchers in their various purposes, a comparison between the existing cotton database and COTTONOMICS is summarized in Supplementary Table 1.
Results
Data collection and analysis
To develop a more complete cotton database, a total of 32.5 TB of omics data were collected and analyzed, including seven assembled genomes and genome resequencing, RNA-seq, smRNA-seq, ChIP-seq, DNase-seq and WGBS-seq data (Table 1).
The brief summary of all data
| Category | Description | Size(base) | Descriptions | Source |
|---|---|---|---|---|
| Genome (main) | G. hirsutum | 2298.44 | 72 761 genes/66 917 annotated | Hu et al. (7) |
| G. barbadense | 2226.68 | 75 071 genes/68 832 annotated | ||
| G. arboreum | 761.41 | 40 960 genes/36 799 annotated | Du et al. (6) | |
| G. raimondii | 1710.1 | 37 505 genes/34 092 annotated | Paterson et al. (5) | |
| Resequencing data | G. hirsutum group | 27 Tb | 1091 samples (27 891 730 SNPs/1 351 234 InDels) | Ma et al. (10) Du et al. (6) Fang et al. (9) Wang et al. (34) |
| G. barbadense group | 1.9 Tb | 77 samples (26 355 613 SNPs/2 126 182 InDels) | Fang et al. (9) | |
| Other group | 871 Gb | 12 samples (30 255 131 SNPs/2 566 802 InDels) | Fang et al. (9) Yu et al. (3) | |
| Transcriptomics | RNA-seq | 2.4 Tb | 312 samples (161 tissues/151 stress) | Hu et al. (7) Zhang et al. (35) |
| smRNA-seq | 32 Gb | 45 samples (tissue: 39 leaf; 6 ovule) | Song et al. (36) Sun et al. (37) | |
| Epigenetics | WGBS-seq | 92 Gb | 4 samples (4 species; tissue: leaf) | Wang et al. (38) |
| DNase-seq/MNase-seq | 83 Gb | 8 samples (4 species; tissue: leaf) | Wang et al. (38) | |
| ChIP-Seq | 171 Gb | 23 samples (4 species; tissue: leaf) | Wang et al. (38) |
Genome information from seven different cotton species, including two diploids (Gossypium raimondii and Gossypium arboreum) and five allotetraploids (Gossypium hirsutum, Gossypium barbadense, Gossypium tomentosum, Gossypium mustelinum and Gossypium darwinii) (5–7), was collected and integrated into the web database for BLAST and genome analysis. Among the 456 933 genes in the seven genomes, 86.76% were annotated with terms from the Gene Ontology (GO), Kyoto Encyclopedia of Genes and Genomes (KEGG), the integrative protein signature database (InterPro), and the protein families database (Pfam) (Supplementary Table 2).
Genomic variation is essential in understanding population genetics and identifying novel genes that can be leveraged in plant breeding to improve agronomically beneficial traits in plant breeding. As allotetraploid cotton is a commercially important crop worldwide, resequencing data from 1180 allotetraploid cottons were collected and aligned to the G. hirsutum L. acc. TM-1 reference genome (7). Consequently, COTTONOMICS contains 62 221 593 genomic variations (56 510 315 SNPs and 5 711 278 InDels) identified from the resequencing of 1091 G. hirsutum accessions, 77 G. barbadense accessions and 12 other tetraploid cotton accessions, including wild species, semi-wild species, races, landraces and cultivars. Of these variations, 29 242 964 (27 891 730 SNPs and 1 351 234 InDels), 28 481 795 (26 355 613 SNPs and 2 126 182 InDels) and 32 821 933 (30 255 131 SNPs and 2 566 802 InDels) were identified in G. hirsutum, G. barbadense and other tetraploid cotton, respectively. COTTONOMICS thus features more genomic variations and accessions than the existing cotton databases, along with a user-friendly search interface. Details regarding the types and distribution of genomic variations are shown in Supplementary Figures 1–3. These variations were annotated with ANNOVAR based on the gene annotations of the TM-1 reference genome v2.1 (7).
In addition, gene expression, smRNA expression and epigenetics data were integrated into COTTONOMICS as well. The gene expression data comprise 312 samples representing 16 tissues (bract, anther, filament, pistil, leaf, sepal, torus, stem, root, ovule, fiber, petal, calycle, stamen, seed and cotyledon) and four stress conditions (4°C, 37°C, polyethylene glycol (PEG) and NaCl). Expression in terms of transcripts per kilobase million and pairwise correlations between genes can be searched and visualized using the COTTONOMICS web interface. Meanwhile, the smRNA expression data include two records comprising 45 samples of leaf and ovule tissues. Finally, the included epigenetics data consists of three datasets: DNA methylation, DNase-seq and ChIP-seq.
Main function and module introduction
COTTONOMICS was developed on a Linux operating system and contains five major modules: genome information search, genomic variation search, expression profiles analysis, epigenetic visualization and an interface for online tools such as BLAST, sequence retrieval, CRISPR design, etc. (Figure 1). To make the interface and its use easier for breeders and scientific researchers to understand, we have provided several example scenarios: (i) retrieving genome information for a cotton species, (ii) seeking genomic variation among allotetraploid cotton accessions, (iii) exploring gene expression and co-expression networks and (iv) QTL searching and the use of other common online bioinformatics tools. We use GH_D12G1827 as an example gene, previously reported as MIXTA genes regulating cotton lint fiber development, to demonstrate the function of this database (8).
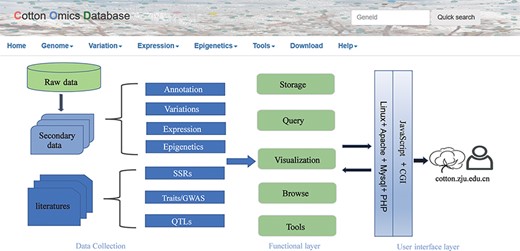
Summary of COTTONOMICS data collection and construction. COTTONOMICS is an easily accessible web database that integrates 32.5 TB of omics data including seven assembled genomes, resequencing data from 1180 allotetraploid cotton accessions and multi-omics data; detailed data information is found in Table 1
With the integrated gene annotations, COTTONOMICS allows users to search on a gene ID and retrieve information about a certain gene in multiple cotton species. We have furthermore provided a search tool for retrieving genes on the basis of keywords related to gene function, UniProt ID, Pfam ID, GO ID and more. An example search is illustrated in Figure 2A, specifically retrieving detailed information for the gene GH_D12G1827 that encodes myb domain protein 106. The search returned information concerning gene location, gene structure, homologous genes, nucleic acid sequence, protein sequence, protein domain, functional annotation, gene ontology and expression level in different tissues; interestingly, the expression map shows that the GH_D12G1827 is highly expressed in the day before anthesis (−1 DPA) ovule. (Figure 2B–D). Meanwhile, in order to solve the problem of gene id conversion in different versions of TM-1 genome, ortholog identification was applied among six versions of TM-1 genome assemblies, and an ortholog finding interface was constructed (Supplementary Table 6).
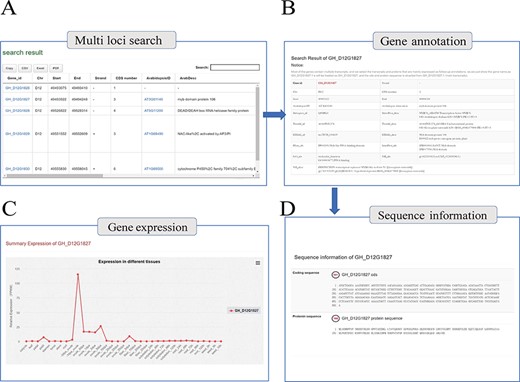
Genome annotation query interface. (A) Multi-loci query interface. (B) COTTONOMICS returns detailed information regarding the functional annotation, location, etc. (C) Expression of the query gene; the interface use dot plots to indicate the expression level of the query gene in different tissues. (D) Sequence information of gene locus GH_D12G1827.
Users can likewise seek detailed information on genomic variations (SNPs and InDels) among allotetraploid cotton accessions by searching on the corresponding genomic regions, gene information and variation ID. The user can further filter variations based on minor allele frequency and variation type. Representative search results detailing variations in the genomic region D12:49 483 522–49 504 248 (10 kbp flanking region of the GH_D12G1827) among 10 upland cotton accessions are shown in Figure 3A, in which red color indicates that a locus differs from reference in the selected accession. COTTONOMICS also provides an interactive interface with which one can query variations based on gene locus; for example, Figure 3C shows information on genomic variations that are linked to GH_D12G1827, and it can be found that 615 variant sites are associated with this gene, of which six are located in the body region. In order to facilitate further analysis, all genomic variations in the database are uniquely numbered, and their details can be retrieved using those unique IDs (Figure 3B). Finally, COTTONOMICS allows users to search for different types of primers in the context of a chosen variation and can directly identify appropriate primers according to its location (Figure 3D).
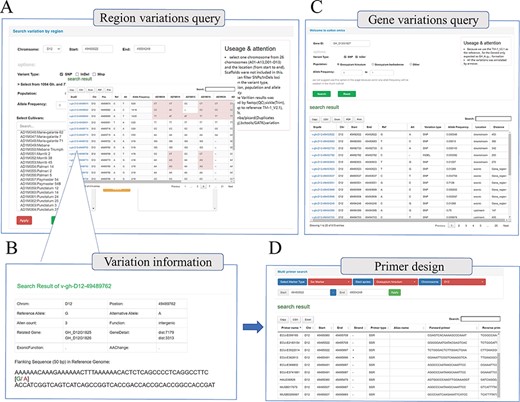
Whole genome-wide variations query interface. (A) Variation information regarding genome region (e.g. D12:49 483 522–49 504 248) among different cotton samples. (B) Detailed introduction of the mutation site (e.g. v-gh-D12-49 489 762), including location information, related genes, function prediction and flank sequence. (C) Variations query based on gene locus (e.g. GH_D12G1827); this interface will return all the mutation sites related to the gene, including upstream, downstream, UTR, exon, etc. (D) Multi-type primer design interface; users can obtain SSR primers and InDel primers based on locus.
Beyond genetic variation, COTTONOMICS offers multiple representations of transcriptomic data, such as heat maps, which users can download and use directly and conveniently (Figure 4A). Using transcriptomic data, we have constructed a genome-wide association network for G. hirsutum and G. barbadense and included in COTTONOMICS, a method for online analysis of the weighted co-expression of genes and prediction of hub genes. For example, we identified 20 genes in the v-myb avian myeloblastosis viral oncogene homolog (MYB) family, an important family of transcription factors involved in cotton fiber development (8), which are specifically expressed in fibers, and then utilized the co-expression interface to reveal their co-expression associations (Figure 4B), which encompassed 1105 other genes. We then divided these MYB-related genes into 12 modules according to their expression patterns. Reviewing their connections, we identified 40 genes directly related to GhMML3_D12, including neighboring genes Gh_D12G1826 (MYB domain protein 16) and Gh_D12G1827 (GhMML4_D12) (Supplementary Figure 4). These genes that share a common expression pattern may interact with each other. In addition, we built a multi-omics data browser that allows users to view the relationships between epigenetic modifications and gene expression. Examination of regulatory relationships in the 5-kb regions upstream and downstream of target genes can substantially refine our understanding of those genes and their functions (Figure 4C).
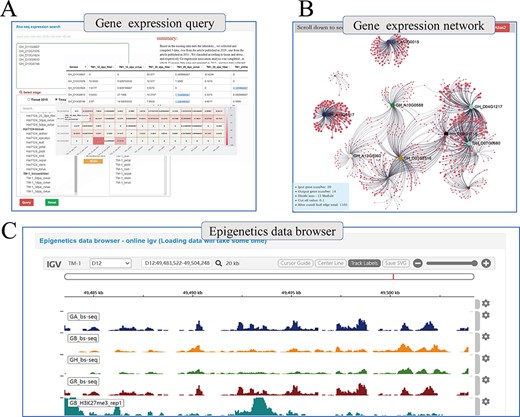
Whole genome-wide transcriptome and epigenome query interface. (A) The interface uses heatmap to show the expression levels of multi-genes in different states. (B) Co-expression relationship visualization of query genes; each dot represents a gene related to the query genes. The size of the gene is proportional to the number of related genes, and the thickness of the line is proportional to the association between the genes. (C) Gene browser for epigenetic data; users can perform operations of coloring, zooming and position jump to the data just like operating the local igv tool.
Finally, COTTONOMICS compiles a selection of QTLs and loci associated with agronomic traits, including 3065 Genome-wide association study (GWAS) loci and 1852 QTLs that pertain to fiber quality and various traits of import to breeders (days-to-flowering, bolls weight, etc.) (9, 10) (Supplementary Table 5). We built a search interface and integrated the loci in Jbrowse, a convenient tool for conducting further exploration (Figure 5A). In addition, we developed several other online tools to facilitate exploration of the cotton genomes. These include online BLAST tools that can be queried with various cotton protein and DNA sequences, a utility for visualizing genomic collinearity to facilitate genome-level comparison and single-guide RNA design and a utility for genome-wide off-target predictions, included in the Tools module (Figure 5B–D).
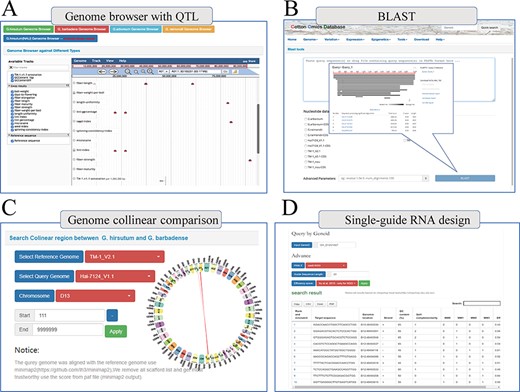
Multi-online bioinformatics tools. Genome browser for multiple cotton species. (B) Online blast tools; users can blast against multiple cotton genome databases based on nucleic acid sequence and protein sequence. (C) Genome collinear comparison query interface; the interface provided circle graphs to show the collinearity of the genome, and users can also download the table to view these collinearity segments information. (D) Single-guide RNA design tools; the interface allows users to design single-guide RNA based on gene loci or chromosome location; furthermore, we also provide a variety of scoring strategies for users to evaluate the efficiency.
Discussion and conclusion
As an effective means of studying crop breeding and discovering potential genes relevant to important agricultural traits, NGS provides great convenience and advantages for cotton genomic and post-genomic research. As such, a plethora of cotton genome and omics data is continually being produced. It is urgent to bridge the gap that remains between this abundant big omics data and biologists and plant breeders. Most users desire a comprehensive and reliable data platform that can easily access, obtain and analyze data at any time; hence, developing such a platform tailored for cotton research is also an urgent need. So far, several available cotton databases have only focused on some specific aspects for cotton research. In brief, the CottonGen (3) provides comprehensive information for cotton genomes, genetic markers, breeding cultivar phenotypes, etc., but its searching and visualization interface needs to be improved; the ccNet (2) mainly focuses on co-expression networks of tetraploid G. hirsutum and diploid G. arboretum; the CottonFGD (1) is a cotton functional genome database that integrates cotton genomes, transcriptome data and a variety of online tools, but it lacks information for genetic resources; the MaGenDB (4) is a comprehensive database for 13 Malvaceae species including cotton, so it is convenient to perform genetic comparative analyses among Malvaceae species; however, its functional analyses on cotton are not complete. Although there have been many studies on cotton omics, a lot of information such as gene IDs and QTLs in these studies is not uniform. Therefore, a reliable platform with integrated genomic resources, genetic information and multi-omics data should be established for cotton research. The COTTONOMICS platform we present here integrates the genomic resources and functional annotations of six cotton species, integrates large-scale population variation information and covers phenotype-related loci information such as QTLs and GWAS and includes transcriptomic and epigenomic resources of multiple cotton species. We also introduced the ForceAtlas2 graph layout algorithm for the first time in the co-expression network to facilitate customers to better discover hub genes. Meanwhile, we provided an ortholog search interface to resolve gene ID switch between different versions of upland cotton genomes. Compared with the previous cotton databases, the COTTONOMICS enriches the types of omics data and provides more easy-to-use functions. COTTONOMICS has already served thousands of global users over the past 2 years, and we plan to continue updating its content and developing additional online analysis functions.
Relative to other existing cotton databases, COTTONOMICS integrates more genomic variation and omics data resources, which will provide comprehensive assistance for the study of gene function and breeding. Besides providing a web database that combines comprehensive multi-omics data analysis modules and online biology tools, we offer a variety of search interfaces, which will provide new ideas for elucidating the association between genetic polymorphisms and cotton phenotypes, and furthermore provide important references for epigenetic and transcriptome researchers (Figure 4C). COTTONOMICS will greatly facilitate the ongoing study of the cotton genome, its evolution, gene mining and breeding.
Materials and methods
Genome and gene functional annotation
The Basic Local Alignment Search Tool (BLAST) is supplied as a sequence-based search engine to identify homologs and loci among all cotton species. We used iTAK (11) to identify transcription factors, transcriptional regulators and protein kinases from among all cotton proteins. We applied blast2go (12) to annotate each gene with GO terms and EC numbers and used the KEGG Automatic Annotation Server (13) to identify KEGG pathways using the bi-directional best hit method. Homology to Arabidopsis genes was determined by aligning protein sequences to the Arabidopsis database using BLASTP (14) with an E-value cutoff of 1e–6. To integrate a complete set of gene function annotations into the database, gene functions were identified by Interproscan (15) using the Pfam (16), National Center for Biotechnology Information (NCBI) conserved domain (17), Simple Modular Architecture Research Tool (SMART) (18) and ProSiteProfiles (19) databases.
Identification and annotation of genomic variation
After completing data processing and quality control, all clean reads were mapped to the G. hirsutum genome using BWA, with uniquely mapped data being retained for further analysis. Variation calling was carried out using Genome Analysis ToolKit (GATK) (20) and Bcftools (21), with only those variations supported by both programs being retained. Variations whose positions were supported by less than three reads or mapping quality was less than 30 were excluded. A hard filter strategy with a minor allele frequency lower than 5% and a max missing rate higher than 50% was applied to remove unreliable sites. All variations were numbered and annotated using ANNOVAR (22).
Analysis of transcriptomics and epigenetic data
We carried out a complete quality control process to ensure the accuracy of the omics data we collected. Depending on the omics data type, we carried out quality control steps as appropriate using FastQC (23), fastp (24), Cutadapt (25) and Trimmomatic (26). Transcriptomic analysis was performed with a commonly used RNA-seq pipeline, namely mapping sequence data against the genome with HISAT2 (27) and then performing assembly with StringTie (28). Afterward, we applied weighted correlation network analysis (29) to establish a gene co-expression network. We also used the javascript plugin sigma.js to illustrate the dynamic relationships between genes. For miRNA-seq data, we used the miRDeep2 toolkit (30) to quantify and explore new miRNAs and psRobot (31) to predict target genes. In processing BS-seq data, we used the Bismark pipeline (32), while for DNase-seq and ChIP-seq data, we chose the more commonly used bowtie2 series software (33). All details of the software used are shown in Supplementary Table 3.
Development of database and webserver
All processed sequences, annotation and expression data were stored in our MySQL (v5.7.26) server. JavaScript was used to render images and process data. Hypertext Preprocessor (PHP) (v7.0.27) and Python (v3.6.8) were used to process large-scale computing. All these services run on the Ubuntu 18.04 operating system.
Supplementary data
Supplementary data are available at Database Online.
Acknowledgements
National Science Foundation of China (32172008 and 31661143016); Project of Hainan Yazhou Bay Seed Lab (B21HJ0223); the project from Sanya Yazhouwan Technology City (SKJC-2021-02-001); the Leading Innovative and Entrepreneur Team Introduction Program of Zhejiang (2019R01002); the Distinguished Discipline Support Program of Zhejiang University (226-2022-00153).
Author contributions
T.Z. and L.F. conceptualized the research program. F.D., J.C., Z.Z., F.L., J.L., T.Z. Y.H. performed the bioinformatics analyses and website construction. F.D., L.F. and T.Z. analyzed all the data and wrote the manuscript. All authors discussed results and commented on the manuscript.
Conflict of interest
The authors report that they have no conflict of interest to declare.
References
Author notes
contributed equally to this work.
