


Abstract
ProtoBug ( http://www.protobug.cs.huji.ac.il ) is a database and resource of protein families in Arthropod genomes. ProtoBug platform presents the relatedness of complete proteomes from 17 insects as well as a proteome of the crustacean, Daphnia pulex . The represented proteomes from insects include louse, bee, beetle, ants, flies and mosquitoes. Based on an unsupervised clustering method, protein sequences were clustered into a hierarchical tree, called ProtoBug. ProtoBug covers about 300 000 sequences that are partitioned to families. At the default setting, all sequences are partitioned to ∼20 000 families (excluding singletons). From the species perspective, each of the 18 analysed proteomes is composed of 5000–8000 families. In the regime of the advanced operational mode, the ProtoBug provides rich navigation capabilities for touring the hierarchy of the families at any selected resolution. A proteome viewer shows the composition of sequences from any of the 18 analysed proteomes. Using functional annotation from an expert system (Pfam) we assigned domains, families and repeats by 4400 keywords that cover 73% of the sequences. A strict inference protocol is applied for expanding the functional knowledge. Consequently, secured annotations were associated with 81% of the proteins, and with 70% of the families (≥10 proteins each). ProtoBug is a database and webtool with rich visualization and navigation tools. The properties of each family in relation to other families in the ProtoBug tree, and in view of the taxonomy composition are reported. Furthermore, the user can paste its own sequences to find relatedness to any of the ProtoBug families. The database and the navigation tools are the basis for functional discoveries that span 350 million years of evolution of Arthropods. ProtoBug is available with no restriction at: www.protobug.cs.huji.ac.il .
Database URL:www.protobug.cs.huji.ac.il .
Introduction
With the maturation of sequencing technologies, we now have a large number of completely sequenced genomes. Recent sequencing efforts have yielded a large and diverse collection of complete genomes of insects. The genome and proteome of Apis mellifera provide a glimpse on the first social insect ( 1 ). Several ant representatives have been recently sequenced ( 2 ). Ants comprise the largest and most diverse group within Hymenoptera ( 3 ). In analysing a newly sequenced genome, the immediate task is to determine the protein sequences and their genomic borders ( 4 ). A more challenging task is to reliably assign functional annotations to predicted coding sequences. Major resources for functional annotations include UniProtKB keywords ( 5 ), Pfam (families, domains and repeats) ( 6 ), Gene Ontology ( 7 ) and the unified resource of InterPro ( 8 ). The success in annotated proteins at a proteome scale using unsupervised clustering was illustrated for A. mellifera ( 9 ) and Daphnia pulex ( 10 ). The quality of automatic methods for assigning functions to uncharacterized proteins is extensively discussed ( 11 ). ProtoBug 1.0 resource clusters protein sequences from Arthropods to functional families. The approach is based on the ProtoNet algorithm ( 12 ) that was designed to cope with a large number of sequences using an efficient and accurate algorithm ( 13 ). ProtoNet algorithm is automatic, unsupervised clustering algorithm, which groups proteins according to their mutual sequence similarity. The clustering does not rely on multiple sequence alignments and the input consists raw sequences with no additional knowledge.
The ProtoBug database classifies all 17 completely sequenced insect proteomes as well as one crustacean ( D. pulex ). It provides a rich resource for comparative perspective of protein families of all insects’ proteomes. An interactive searching of protein families and tracing their evolutionary relatedness are available at http://www.proto bug.cs.huji.ac.il .
Constructing ProtoBug Tree
Data resources
The protein sequences that are included in ProtoBug platform include only completely sequenced genomes. Several criteria were applied to compile the protein sequence collection: (i) A minimal quality for proteomes’ completeness. We set a minimum of 10 000 sequences as a threshold; (ii) A wide range of divergence time among Neoptera. The human body louse is a prototype for aphids, shield bugs and cicadas (belong to Hemiptera). We also included the D. pulex as outgroup for insects. (iii) Reduced redundancy. We selected only 2 complete proteomes out of the 12 species of the Drosophilae. The model organisms Drosophila melanogaster covers related species ( Drosophila simulans and Drosophila sechellia ). We also selected the Drosophilavirilis that is separated by about 40 M years of evolution from the D. melanogaster . (iv) Including fast evolving insects. We included the ants in the list of complete proteomes to cover a range of habitats, ecological needs, sizes and social behaviors.
We downloaded the whole proteome of Tribolium castaneum , Aedes aegypti, Anopheles gambiae, Culex quinquefasciatus, D.melanogaster, D. virilis, Solenopsis invicta, Anopheles darlingi, Acromyrmex echinatior, Camponotus floridanus, Pediculus humanus, Harpegnathos saltator and D. pulex from UniProtKB ( 14 ). Other proteomes were downloaded directly from the Hymenoptera Genome Database (HGD) ( 15 ): Nasonia vitripennis (v1.2), Linepithema humile (v1.2), Atta cephalotes (v1.2), Pogonomyrmex barbatus (v1.2) and A. mellifera (release 4.5).
Table 1 summarizes the statistics of the analysed species. Note that D. pulex ( 16 ) was added as an outgroup species. The total number of proteins from the combined resources is 287 405 (206 615 from UniProtKB and 80 790 from HGD). There are 138 762 proteins that belong to the Hymenoptera (48%) and 91 241 (32%) to the Diptera.
Collection of 18 Arthropods proteomes
| Taxa-ID | Organism (common name) | DB Sourcea | No. Proteins | No. Fam | No. TMD’s proteinsc |
|---|---|---|---|---|---|
| 7070 | T. castaneum (Red flour beetle) | UniProt | 16502 | 6706 | 3670 |
| 7159 | Ae. aegypti (Yellowfever mosquito) | UniProt | 16045 | 5120 | 3442 |
| 7165 | An. gambiae (African malaria mosquito) | UniProt | 13075 | 4563 | 3101 |
| 7176 | Cx. quinquefasciatus (Southern house mosquito) | UniProt | 18703 | 5415 | 3713 |
| 7227 | D. melanogaster (Fruit fly) | UniProt | 17524 | 5233 | 4277 |
| 7244 | D. virilis (Fruit fly) | UniProt | 14457 | 5662 | 3202 |
| 7425 | N. vitripennis (Parasitic wasp) | HGD (v1.2) | 18822 | 5058 | 3128 |
| 13686 | S. invicta (Red imported fire ant) | UniProt | 14194 | 5814 | 2669 |
| 43151 | An. darlingi (Mosquito) | UniProt | 11437 | 5446 | 2407 |
| 103372 | Acromyrmex echinatior (Panamanian leafcutter ant) | UniProt | 13962 | 6538 | 2812 |
| 104421 | C. floridanus (Florida carpenter ant) | UniProt | 14787 | 6008 | 2983 |
| 121224 | P. humanus subsp. corporis (Body louse) | UniProt | 10763 | 4866 | 2451 |
| 610380 | H. saltator (Jumping Ant) | UniProt | 15029 | 5423 | 2768 |
| 7460 | A. mellifera (Honeybee) | BeeBase (v4.5) | 10570 | 4521 | 2561 |
| 83485 | L. humile (Argentine ant) | HGD (v1.2) | 16116 | 6964 | 3290 |
| 12957 | A. cephalotes (Leaf Cutter Ant) | HGD (v1.2) | 18093 | 8378 | 3777 |
| 144034 | P. barbatus (Red Harvester Ant) | HGD (v1.2) | 17189 | 7999 | 3530 |
| 6669 | D. pulex (Water flea) | UniProt | 30137 | 8742 | 4770 |
a Source of BeeBase belong to HGD, Hymenoptera Genome Database.
b Short proteins are ≤100 aa.
c Number of proteins predicted as having TMDs.
Hierarchical clustering algorithm
The clustering protocol starts by pre-calculating an all-against-all BLAST similarity score ( 17 ) for all 300 000 protein sequences. The similarities’ E-scores were used to produce a continuous hierarchical bottom-up clustering process. At each step, the two most similar protein clusters are joined [the exact algorithm is described in reference ( 13 )]. Importantly, BLAST E-score with an extremely relaxed threshold is considered throughout the tree construction (E-score = 100). The agglomerative clustering algorithm benefits from such relaxed E-score distances for constructing a robust family tree. A key ingredient of ProtoBug is the use of a Constrained Memory-ProtoNet algorithm ( 13 ). The algorithm has previously described for the ProtoNet platform ( 12 , 18 ).
In the clustering tree, there is a natural tradeoff of the number of clusters, clusters’ size and their quality. The result is a hierarchy of protein clusters at various degrees of granularity. This hierarchy is structured as a collection of trees that form what we call—the ProtoBug forest. The root clusters contain all the proteins of the tree while other clusters represent subdivisions of proteins into smaller groups. The hierarchical definitions allow the user to navigate from a protein to the sub-family and the super-family levels in order to discover overlooked functions and evolutionary signals.
Protein families
The tree of functional families is naturally leveled according to the percentage of merging steps carried out so far (ProtoLevel). We sought the level that provides the best partition into functional families. This default level (or cut) turned out to be ProtoLevel70 (PL70). Using the PL70 threshold we obtained 20 134 disjoint clusters that represent protein families. Figure 1 shows the number of protein families and the correlation to the number of protein sequences for each of the 18 species. There are 6000 families per genome on average. Actually, the range for the number of families per genome is quite broad (between 4500 and 8000). The variability of protein numbers is monitored for the two major clades of insects: the Hymenoptera and the Diptera. The high number of families in D. pulex is in accord with the exceptional number of proteins (over 30 000 sequences).
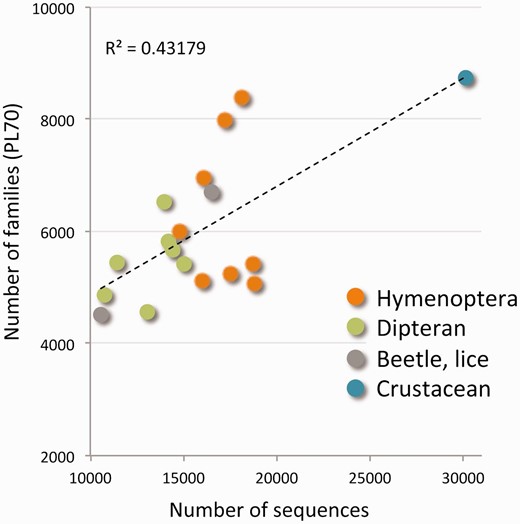
Protein families of the Arthropods complete proteomes. The scatter plot shows the number of protein families from the ProtoBug tree with respect to the number of raw sequences for each of the 18 analysed proteomes. The families are disjoint clusters from the partition at PL70. Although some organisms appear in >8000 families, most organisms participate in 5000–5500 protein families. The organisms are colored by the main clades. The extreme value of ∼30 000 proteins belongs to D. pulex .
As the clustering relies on complete proteomes, we take advantage of the expectation for appearance of proteins for a family from each of the tested organisms ( Table 1 ). Analysis of the ProtoBug algorithm reveals that the average number of species for PL70 clusters is 15.5. Estimating the random expectation (fixing the number of proteins from each species, and according to the multinomial distribution) is only 12. The P -value of having 15 species (or more) in a random cluster of size 18 is significant ( P = 0.00059). Thus, the PL70 level leads to a good representation of all the analysed insects. The rest of the analyses will refer to the 20 134 clusters from the PL70 threshold as disjoint protein families. Each family is associated with a ProtoBug identifier.
For comparison, we applied the OrthoMCL clustering algorithm on the same set of sequences ( 19 ). The result from both algorithms is a comparable number of families (the number is 26 204 for OrthoMCL) ( Figure 2 ). The number of proteins that were clustered to small clusters of size 3 or less by OrthoMCL and ProtoBug are ∼25 K and ∼27 K, respectively. However, the cluster size that was obtained by applying OrthoMCL is substantially smaller ( Figure 2 A and B). The largest difference between the two alternative classification modes is associated with the largest families. In ProtoNet based clusters, there are 383 clusters of size >100 proteins (a total of 118 534 proteins) relative to only 45 large clusters by OrthoMCL (total of 6933 proteins). Although 41% of all proteins are included in large ProtoBug clusters (>100 proteins), only 2.4% of the proteins meet that size for the OrthoMCL clusters ( Figure 2 ).
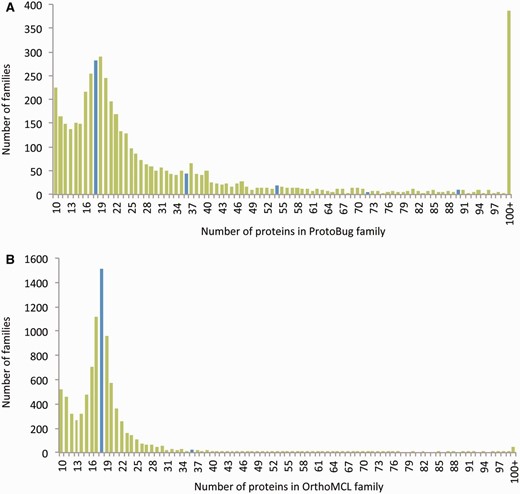
Size distribution of the protein families from Arthropods-complete proteomes. The families listed are based on all 18 complete proteomes. The protein families are ranked by their sizes according to ProtoBug clusters (A) and OrthoMCL (B) algorithms. The blue bars shows the families of size 18 and the multiplications (i.e. 36, 54, etc.). Note a clear difference in cluster size distribution between the two clustering modes. Specifically, there are ∼400 families with more than 100 proteins among the ProtoBug family collection.
Quality of families
The protocol that constructs ProtoBug is unsupervised. Therefore, no annotations are included. However, measuring the correspondence between a given cluster and specific annotations provided by external expert systems is essential for the ‘validation’ of the quality of the automatically generated families. Each protein was assigned with its predicted Pfam keywords (domains, families and repeats), leaving 77 988 (27% of all the sequences) unannotated. Altogether there are 4400 Pfam keywords that were assigned to the analysed proteomes. Based on a minimal threshold for the family size, 3437 Pfam keywords are associated with 4504 families (≥10 proteins each).
At the granularity level of PL70, many families are pure and sensitive in term of their associated keywords. For example, Trypsin (2912 proteins, no false positives) and Ras (1559 proteins, one false positive) are confined to only a single family. Nevertheless, many keywords appear in more than one family (i.e. low sensitivity). Thus, we focused on the specificity score (i.e. the fraction of annotated proteins in a family that shares a common Pfam keyword versus all the proteins in the family). Table 2 lists PL70 families with a moderate size of 100–300 proteins each, all having a maximal purity (specificity score of 1.0). These families account for fundamental processes that are shared by all insects such as the various aspects of membrane trafficking and secretion. Other functions that are covered by all the analysed species include oxygen transfer and a collection of enzymatic activity. For all 3437 Pfam keywords the average specificity is 0.89 and the median is 0.93 ( Figure 3 ).
Pure cluster (Specificity of 1.0) for ProtoBug PL70 clusters having 100–300 proteins each
| PFAM name | PFAM accession | Average length | No. of annotion a | No. of unannotation | No. of proteins | No. of clusters |
|---|---|---|---|---|---|---|
| CD36 family | PF01130 | 385.8 | 211 | 0 | 211 | 1 |
| Eukaryotic-type carbonic anhydrase | PF00194 | 214.8 | 206 | 0 | 206 | 1 |
| Astacin (Peptidase family M12A) | PF01400 | 174.0 | 177 | 0 | 177 | 1 |
| Hemocyanin, all-alpha domain | PF03722 | 107.0 | 147 | 6 | 153 | 1 |
| Hemocyanin, ig-like domain | PF03723 | 235.0 | 146 | 7 | 153 | 1 |
| Hemocyanin, copper containing domain | PF00372 | 254.6 | 143 | 10 | 153 | 1 |
| Sulfatase | PF00884 | 338.9 | 143 | 0 | 143 | 1 |
| Snf7 | PF03357 | 163.2 | 131 | 0 | 131 | 2 |
| Innexin | PF00876 | 292.9 | 129 | 0 | 129 | 1 |
| Inositol monophosphatase family | PF00459 | 238.9 | 116 | 0 | 116 | 1 |
| Synaptobrevin | PF00957 | 73.3 | 107 | 7 | 114 | 1 |
| Regulated-SNARE-like domain | PF13774 | 76.8 | 49 | 65 | 114 | 1 |
| pfkB family carbohydrate kinase | PF00294 | 248.7 | 98 | 14 | 112 | 2 |
| emp24/gp25L/p24 family/GOLD | PF01105 | 175.7 | 103 | 0 | 103 | 1 |
| D-isomer specific 2-hydroxyacid dehyd., catalytic | PF00389 | 286.7 | 86 | 14 | 100 | 1 |
| D-isomer specific 2-hydroxyacid dehy., NAD binding | PF02826 | 168.2 | 97 | 3 | 100 | 1 |
a Annotation according to Pfam keywords.
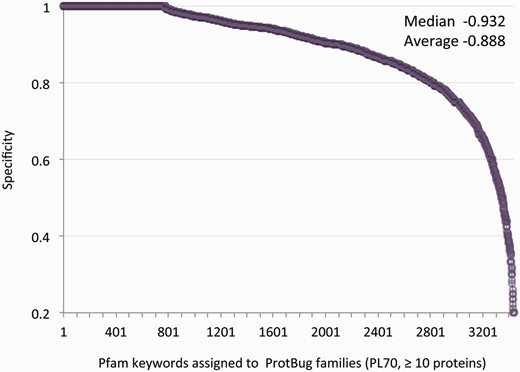
Specificity for all annotated families. Each data-point represents a unique annotation from a set of Pfam keywords. There are 3437 Pfam keywords that are associated with 4504 families (>10 proteins each). The annotation inference is restricted to a minimal specificity of 0.2. The average and median specificity are shown.
The score for a given cluster on keyword K ranges from 0 (no correspondence) to 1 (the cluster C is comprised of all the proteins with keyword K). The CS values are used as a quality measure for the automatic and the curation-based approaches. For example, we consider the distribution of CS value over all clusters that meet a minimal size of a family. In order to obtain a biologically relevant view of the hierarchy, we applied several tests and set a minimal threshold for clusters that are enriched with coherent biological information.
Features associated with high-quality clusters
We monitored the family’s purity in view of the associated attributes to estimate the success of the automatic annotation task. This assessment is the basis for a guideline supporting the manual and experimental curation effort. Toward this task, we look at a paired match of the ProtoBug family (4504 families, ≥10 proteins) and a Pfam keyword. The number of species in each cluster and the additional quantitative properties of the families are recorded. In this ProtoBug family centric view, some families appear multiple times. For example, ProtBug 531099 (90 proteins) associate with 5 Pfam keywords: the Phosphatidylinositol-specific phospholipase C of X and Y domains show high specificity (0.94). However, the keyword ‘Protein of unknown function’ (DUF1154) is associated with only 27 proteins. This led to a poor specificity for DUF1154 (0.3). Thus, from the family perspective, the average specificity is 0.84 where the unannotated proteins are not counted. The specificity score drops to 0.72 once the unannotated proteins are considered false positives.
Figure 4 shows the statistical distribution of the ProtoBug families that cover the highest ( Figure 4 , marked A) and lowest ( Figure 4 , marked B) values for 800 families (18% of 4504 families, ≥10 proteins). In the case of the Pfam domain/family, the average length is 178 (median 154 aa) and 110 (median 82.7 aa), for groups A and B, respectively. This significant difference supports the view that the size of the domain is one of the attributes toward a successful annotation inference. We had shown that the hierarchical algorithm is preferable for single domain proteins and for proteins carrying simple domain compositions ( 20 ). All the attributes show significant statistics with P < 0.001 for each of the panels (based on t -test, Figure 4 ).
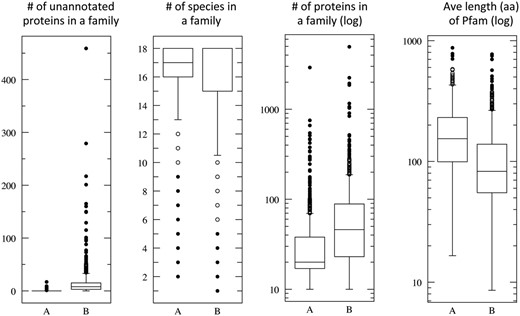
Quantitative attributes of ProtoBug families. Each panel summarizes the statistics for families according to annotation purity. All ProtoBug PL70 families (4504 with ≥10 proteins each) were ranked by the CS and the top and bottom 800 families (18%) are defined as group A and B, respectively. The statistics is presented as Plotbox with the bottom and top of the box shows the first and third quartiles, and the line inside the box shows the median. The whiskers cover the extreme 5% of the quartiles and the outliers are indicated by the dots. Note that the scale for some of the attributes is logarithmic.
The pure families (group A, Figure 4 ) are also characterized by being mostly represented by 18 and 17 species. ProtoBug ID 552854 is a family characteristic for ‘7tm odorant receptor’ with 1630 proteins and no false positives. Despite the size of the family, it is confirmed to be a genuine insect specific. Indeed, ProtoBug ID 552854 does not include D. pulex proteins. In all the cases that only 17 species were included in the family, the proteins from D. pulex were missing.
Annotations’ gain in protein families
Within a family, the unannotated proteins are assumed to share the same function as the annotated proteins. We refer to such assignment as ‘annotation gain’. To avoid functional inference with a minimal support, automatic inference was restricted to families with a predetermined level of purity (>0.2 for any specific Pfam keyword). Based on this criterion, we were able to associate Pfam keywords to 57% of all unannotated proteins. This ‘guilt by association’ approach was applied for 77 988 sequences. For example, 123 unannotated proteins that belong to the ‘7tm odorant receptor’ family (ProtoBug ID 552854) can be safely annotated. Similarly, ‘cytochrome P450’, a crucial enzyme in the electron transfer that catalyses the oxidation of organic substances, together with 55 unannotated proteins forms a family of 1749 protein without any false positives (ProtoBug ID 553578). Many other families support the safe annotation inference.
Interesting instances for manual curation task are associated with proteins that were not assigned any other Pfam keyword, and families having little or no false annotations. Table 3 lists a sample of families with a minimum of 40 proteins, a false positive rate that is <5% and a domain average length that is >75 amino acids. Inspecting the table suggests safe annotations for hundreds of proteins. The gain in annotation applies for enzymes, receptors and structural functions. Interestingly, the majority of these families are not represented by all species. The same scale of annotation gain applies to families denoted by ‘Domain/Protein of Unknown Function’ (DUFs). As a guideline for experimental and manual curation task for complete proteomes, we proposed to set filters according to the parameters studied in Figure 4 (e.g. the Pfam domain average length).
Annotation gain in ProtoBug PL70 clusters having <40 proteins each
| Family ID | Pfam acc (PF) | Pfam name | No. of gain | No. of TP | No. of FP |
|---|---|---|---|---|---|
| 552114 | 13 359 | DDE superfamily endonuclease | 142 | 316 | 6 |
| 550859 | 1757 | Acyltransferase family | 109 | 254 | 0 |
| 553707 | 75 | RNase H | 32 | 105 | 4 |
| 552319 | 640 | Phosphotyrosine interaction domain (PTB/PID) | 23 | 115 | 2 |
| 529077 | 2949 | 7tm Odorant receptor | 38 | 85 | 0 |
| 552416 | 2145 | Rap/ran-GAP | 29 | 91 | 2 |
| 546351 | 6477 | Protein of unknown function (DUF1091) | 34 | 71 | 1 |
| 549834 | 3175 | DNA polymerase type B, organellar and viral | 37 | 63 | 3 |
| 549781 | 149 | Calcineurin-like phosphoesterase | 24 | 65 | 0 |
| 551188 | 722 | Glycosyl hydrolases family 16 | 20 | 62 | 0 |
| 553621 | 11 018 | Pupal cuticle protein C1 | 20 | 61 | 0 |
| 552272 | 380 | Ribosomal protein S9/S16 | 13 | 36 | 0 |
| 541523 | 12 736 | Cell-cycle sustaining, positive selection | 13 | 34 | 0 |
| 520563 | 5050 | Methyltransferase FkbM domain | 12 | 35 | 0 |
| 552405 | 115 | Cytochrome C and Quinol oxidase polypeptide I | 10 | 31 | 0 |
Seeking stable families by following a tree branch
The hierarchical property of the ProtoBug tree raises the challenge of finding a most informative level in the ProtoBug tree that will represent reliable and stable families. The PL70 was selected as a preferable level for partition the data to families.
Figure 5 shows 4 of such families for the 100 top families according to the CS score. Several observations are evident for most of the families: (i) the PL70 families capture the maximal CS for the selected keyword. (ii) From the perspective of the CS score, there are numerous clusters that have a similar performance, suggesting a set of stable clusters ( Figure 5 C and D, insets). (iii) All clusters show a drastic drop in their CS score that occurs in late stages of the clustering. (iv) Information on the consistency of functional family is captures within the top 100 clusters ( Figure 5 ) and for the majority of the cases within the top 20 clusters (in view of the CS score).
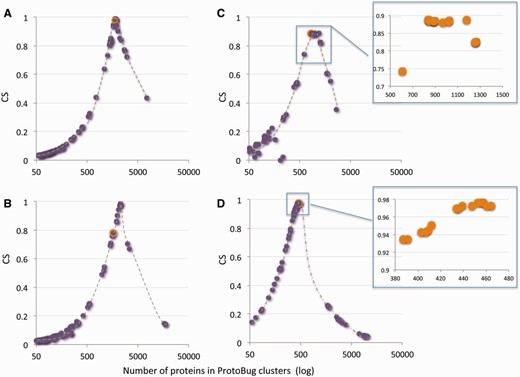
A keyword-centric view for ProtoBug families according to CS and the number of proteins. Representatives of Pfam keywords are: (A) Cytochrome P450; (B) Ligand-gated ion channel; (C) 7tm odorant receptor; (D) Cadherin domain. Each plot shows the 100 clusters with the highest CSs versus the cluster size (log scale). In most instances the PL70 family and the maximal CS for this keywords coincides (orange symbol in A–D). Insets for C and D show a zoom for the top 15 clusters. For all the keywords, a sharp drop in CS and a substantial increase in the size of the family mark the deterioration in the cluster quality towards the root of the Protobug tree.
For a selected keyword, following the evolvement of a family identifies ‘interim-stable clusters’ along the process. These interim-stable clusters often coincide with a partition to subfamilies. Families that contain multiple subfamilies are observed by having a not trivial fitting curve (not shown).
Website properties
Many features on the ProtoBug website are based on the generic platform on the ProtoNet tree. ProtoNet was designed for all protein sequences irrespectively of their taxa or completeness of the proteomes. We describe the capacity of ProtoBug platform. Some will be operated only in the ‘advanced’ mode ( Figure 6 ). A Cluster page is shown at the mode of ‘viewing the proteins’ ( Figure 6 , proteins/features).
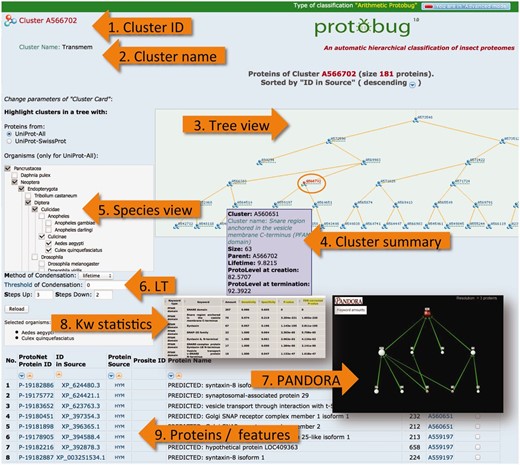
ProtoBug cluster page and several viewers from the simplified and advanced modes. The advanced mode is selected at the top right corner of the page. The cluster A566702 includes 181 proteins. A cluster is uniquely identified by its ID ( 1 ). Cluster name ( 2 ) is provided for clusters that show a minimal degree of consistency with the different resources for keyword (Pfam, Phobius, Clantox and Taxonomy). Tree viewer ( 3 ) is sensitive to the selection of the species ( 5 ) and the compression of the tree according to the LT ( 6 ). Family annotation is analysed using PANDORA viewer ( 7 ) and statistical significance ( 8 ). The proteins of the clusters are listed ( 9 ) with their immediate attributes (length, source and association to their child clusters).
Browsing cluster by keyword
Clusters’ names are available for browsing ( Figure 6 , Cluster name). One can choose a keyword of interest and view all the clusters that are named by it. For example, there are 4380 clusters in ProtoBug with a keyword of ‘7tm odorant receptor’. The total number of proteins with this keyword is 1930. We provide a tabular summary for all the 4380 clusters sorted by the associated CS score. Detailed listing of True positives, True negatives, False positive and False negatives for the selected keyword can be used for an off-line analysis. In ProtoBug there are ∼6300 families that are named by at least one Pfam keyword (excluding singletons).
Summary of a cluster
Each ProtoBug cluster carries a large number of properties that include the source of protein, the position in the ProtoBug tree and the LifeTime (LT). The later defines as the difference between the termination and creation time of the cluster. The PL determines the granularity. In addition, the fraction of proteins that are named putative/hypothetical is reported. We provide a list of all these numerical properties in a summary table ( Figure 6 , Cluster summary).
Tree resolution
The ProtoBrowser page zooms in on the tree in the vicinity of the cluster that is being analysed. A selected branch is shown in the context of related neighboring branches. The user hovers the mouse over a cluster to display essential (minimal) information such as the cluster size. An example of such ProtoBrowser tree view is shown ( Figure 6 , Tree view). ProtoBug is constructed as a binary tree. However, the user can apply the LT filter to accept proteins that meet the value of the selected LT parameter. In the ‘Advanced mode’, the user can select to investigate any level of the clustering tree (PL0–PL100).
Species tree viewer
The user can select to view the ProtoBug tree for a subset of the 18 complete proteomes. The tree viewer highlights the selected branches ( Figure 6 , Species view). This option can be reset at any step of the analysis. The branches that include proteins from an organism (or a clade) become visible; though all ‘faded’ clusters can still be analysed. By activation the species viewer, the partition of the proteins in the cluster according to the selected organisms is provided. For example, the ProtoBug ID 544862 (397 proteins) includes transporters from the Major Facilitator Superfamily from all 18 analysed species. However, there are twice as many proteins from T. castaneum with respect to A. mellifera and almost 2.5 folds more than found in mosquitoes.
Navigation in an advance mode
The advance mode provides user control on the parameters for visualization and navigation. The user can choose to activate the ProtoBrowser at a different resolution. In a simplified mode two levels above and below the selected cluster (red font in the tree) are shown by default. In the ‘advanced mode’, the number of layers to be presented is a user-selected parameter ( Figure 6 ). By moving up the tree one observes how the cluster grows in size and becomes more diverse. The user can change the tree resolution by modifying the parameters of the tree condensation protocol. The parameter of LT is controlled. A value of zero is applicable for a binary tree ( Figure 6 , LT). Other capacity of the ‘advanced mode’ allows retrieving the clusters at any selected PL. A careful biological interpretation of the clusters is beyond the scope of this research.
Multiple annotation sources
ProtoBug 1.0 includes the assignment of Pfam keywords (using the PfamScan protocol) as the major functional annotation resource. Evidently, the annotations of protein families are not limited to a single expert system. We applied Phobius predictor ( 21 ) to tag proteins for the presence of the transmembrane domains (TMDs) and signal peptide. About ∼20% proteins from the analysed proteomes are positively predicted by Phobius. Additional annotations concern a unique subset of secreted proteins that resemble ion channel blockers and cell modulators. These are positively predicted by ClanTox (CLassifier of ANimal TOXins) ( 22 ). Clantox identifies 0.7% of the ProtoBug proteins.
Integration of annotations
A functional analysis of a family is performed using the PANDORA ( 23 ) visualization. PANDORA platform allows in-depth analysis of ProtoBug clusters by supporting the direct export from the cluster page. PANDORA allows assessing the relatedness and overlapping of any of the multiple assignment of Pfam keyword to the family members (it is applicable to any type of annotation). The protein family is forwarded to the PANDORA analysis tool. The results from the PANDORA tool include: (i) The statistical significance of the keywords that are assigned to the proteins ( Figure 6 , KW statistics) ( 23 ). (ii) A visualization of the inter-relations of the keywords ( Figure 6 , PANDORA).
Towards function—a user’s test case
We illustrate a routine use of ProtoBug platform. The starting point is a sequence named hypothetical protein KGM_11510 from the butterfly, Danaus plexippus ( 24 ). Applying the function ‘Paste your sequence ’ with the default parameters finds this sequence in ProtoBug ID 481476 (17 out of the 21 proteins are named ‘synaptosomal-associated protein’). The cluster name is SNAP-25 (CS score 0.96). Navigating in the tree reveals the interconnection to a group of 16 related sequences that belong to SNAP-29, another synaptosomal-associated protein (19 proteins, ProtoBug 491190). ‘Climbing’ in the ProtoBug tree identified a cluster of 16 uncharacterized proteins (ProtoBug ID 502509) that cannot be assigned to any Pfam or other annotation. Based on the reliability of the connections (not shown) and using a structural modeling approach, we confirm this cluster as synaptosomal associated that carries the characteristics of t-SNARE domains. The higher level in the ProtoBug tree (PL90) suggests a natural partition of two stable clusters with 118 proteins (ProtoBug ID 559197) and 63 proteins (ProtoBug ID 560651). ProtoBug ID 559197 includes limited types of syntaxin proteins (Syntain 6, 8, 10) while ProtoBug ID 560651 accounts for the Golgi SNAP receptor complex (with proteins carry features of v-SNARE and t-SNARE). A stable cluster of 181 proteins contains t- and v-SNARE proteins. The merge of this cluster and additional stable one that consists mainly of syntaxins (161 proteins, ProtoBug ID 566383) creates a unified SNARE-related cluster with 342 proteins (ProtoBug ID 569983). The reliability of the superfamily as a superfamily of SNARE Arthropods is evident (CS of 0.69). Note that ∼50% of the proteins carry non-informative names (e.g. species identifier number, hypothetical). Among them, ∼50 sequences explicitly named ‘putative uncharacterized protein’.
Maintenance and Updating
ProtoBug 1.0 incorporated improvements that will benefit automation for future updates and release versions. ProtoBug will be updated once a year. A partition in UniProt to the sections of UniProt/Swiss-Prot and UniProt/TrEMBL was implemented. This will allow the users to focus, as needed, on all the proteins or on a subset that are manually curated. Future releases will incorporate additional annotation resources. To provide the user with a control over the confidence level, the annotations evidence (e.g. experimental, inferred) will be added based on the scheme adopted by the GO consortium. The next version of ProtoBug will include additional complete genomes that are underrepresented (with emphasize on butterfly and moth).
Acknowledgements
We thank Nati Linial and the ProtoNet team for many years of support. We thank Samuel Sayag for his help in maintaining and improving the database. We thank Solange Karsenty for her long-term support in the design of the web interface. N.R. is a recipient of the 2014 Clore PhD excellence Fellowship.
Conflict of interest. None declared.
References
Author notes
Citation details: Rappoport,N. and Linial, M. ProtoBug: functional families from the complete proteomes of insects. Database (2015) Vol. 2015: article ID bau122; doi:10.1093/database/bau122
