


Abstract
The Carbon Reduction Potential Evaluation (CaRPE) tool is a web-based interactive tool that integrates two databases for the USA collected at county/multi-county scales to visualize and estimate the climate benefits of implementing a variety of conservation practices on croplands and grazing lands. The COMET-Planner tool provides county/multi-county carbon sequestration and greenhouse gas emission reduction coefficients associated with the adoption of climate-smart agricultural management practices. The CaRPE tool couples these coefficients, reported in tonnes of carbon dioxide equivalents (CO2e) per acre per year, with county-level cropland and grazing land acres extracted from the US Agricultural Census. The CaRPE graphical user interface allows users to quickly and easily build and export scenarios of new conservation practice adoption on desired acreages and locations at state, regional or national scales. Results are in tonnes CO2e per year, and each scenario can be exported in tabular and map formats at the selected scales. Existing county-level cropland acreage data provide the upper boundaries for acres of adoption and can be modified based on specific goals established by the user.The output may be used to develop potential targets of adoption and help inform decisions related to resource prioritization and planning efforts. In collaboration with local experts and farmer-led organizations, the results can provide a key starting block to prioritize practices and areas that contribute to climate benefits. As the underlying databases and models are updated and improved, CaRPE can be revised accordingly to increase accuracy and enhance applicability. The CaRPE tool and the user guide are available at:
Database URL: https://carpe.shinyapps.io/CarpeTool/
Introduction
According to the US Environmental Protection Agency, agriculture contributed 11% of total 2020 US greenhouse gas (GHG) emissions (1). The main sources of agricultural emissions include nitrous oxide (N2O) from soil management practices primarily involving nitrogen fertilizers and the production of methane (CH4) and N2O from manure management and enteric fermentation in livestock. In addition to the numerous efforts underway targeting reduction of these GHG sources (2, 3), additional pathways exist using cropland and grazing land conservation management practices to increase the amount of carbon that plants can capture and ultimately store in the soil through soil carbon sequestration (4–7). Many of these practices also directly and indirectly influence the nitrogen cycle and the amount of N2O emitted from soils (8–10). Agricultural practices that may increase carbon sequestration and reduce GHG emissions are often referred to as climate-smart farming practices and include planting cover crops, adopting reduced till or no-till, managing nitrogen fertilization and increasing the frequency of perennial crops in the cropping rotation (11, 12). Grazing land practices include incorporating trees and woody shrubs in grasslands and optimizing grazing management. Additionally, converting portions of annual cropland into perennial grasses or woody vegetation increases carbon sequestered in soils and aboveground biomass. These strategies serve as one element in meeting national climate mitigation goals on working lands by the USA after rejoining the Paris Agreement in 2021 (13).
Land managers and policymakers must balance the need to produce enough food and fiber to feed a growing population with the possible climate mitigation potential associated with conservation practices (14). To do so, they need to have estimates of such mitigation potentials. Agricultural conservation practice implementation has the potential to provide short- and long-term climate benefits, but how these practices differ in their mitigation potential and scale over the landscape is not easily estimated. State and national policymakers and program staff need data on an accessible and flexible platform that allows them to estimate historical and future climate benefits from the implementation of these practices. This is necessary to compare regions, rank practices and identify and leverage areas where adoption levels have proven successful. Furthermore, because programs and policies often cross local and state borders, the data should be acquired using standardized methodologies and be easily scalable.
To meet these needs, the Carbon Reduction Potential Evaluation (CaRPE) tool was developed. CaRPE couples data from two US databases collected at county/multi-county scales to estimate the climate benefits of implementing a variety of conservation practices on croplands and grazing lands. The first database extracts information from COMET-Planner, which is currently the only national, public planning tool for agricultural carbon dioxide equivalent (CO2e) reduction potential (http://comet-planner.com). The reported CO2e reduction potentials represent the net estimates of carbon sequestration and GHG emissions from the adoption of multiple conservation practice standards established by the United States Department of Agriculture (USDA) Natural Resources Conservation Service (USDA-NRCS). The second database is from the Census of Agriculture (AgCensus), collected every 5 years by the USDA National Agricultural Statistics Service (NASS) (https://www.nass.usda.gov/AgCensus/). This adds the necessary acreages of cropland and grazing lands at the county level across the USA.
Program description
The CaRPE tool is a web-based graphical user interface (GUI) tool that was designed for users to quickly visualize and estimate net GHG emission reduction and carbon sequestration potential resulting from the implementation of a suite of cropland and grazing land management practices. CaRPE integrates acreage data from the AgCensus and user-defined scenarios of new conservation practice adoption to calculate and scale CO2e reduction estimates for cropland and grazing land at county, state or regional scales (Figure 1). The current version of CaRPE is only available for the 48 conterminous US states.
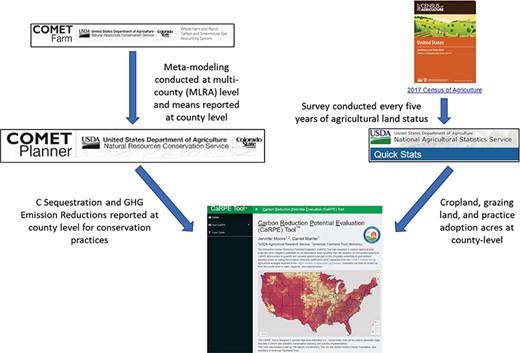
A graphical overview of the input databases used in the CaRPE tool.
The CaRPE tool expands on the current functionality of COMET-Planner, which allows users to explore generalized estimates on a county-by-county basis. Enhanced functions of CaRPE include the following:
The integration of AgCensus acreage data, which
establishes boundaries for estimating maximum technical (i.e. 100% adoption) practice adoption based on the desired land use acreages
may be used to estimate historical and future practice adoption.
Estimate (and map) climate benefits for each practice scenario that can be scaled up to state, multistate, regional and national levels.
Export maps and tabular data to create custom reports for each scenario at the selected scale.
Estimate implementation costs using user-defined values or the national average NRCS Environmental Quality Incentives Program payment schedule rates (https://www.nrcs.usda.gov/wps/portal/nrcs/detailfull/national/programs/financial/?cid=nrcseprd1853230).
Methods
AgCensus data
County-level AgCensus data (2012 and 2017 only) were downloaded from the USDA’s NASS Quick Stats application programming interface (API) using the rnassqs package (15) in R (Table 1). In the Quick Stats API, NASS replaces reported data with ‘(D)’ for some counties to protect privacy when there are few farms reporting. All masked county data in CaRPE were set to zero, which may result in slightly different state and regional values calculated in CaRPE compared to those reported directly from NASS.
Acreage data directly downloaded from the AgCensus (USDA’s NASS Quick Stats API) or calculated in CaRPE
| CaRPE namea | Description |
|---|---|
| Cropland | AG LAND, CROPLAND—ACRESb |
| Cropland irrigated | AG LAND, CROPLAND, HARVESTED, IRRIGATED—ACRESb |
| Cropland non-irrigated | Cropland − cropland irrigated |
| Grazing land | AG LAND, PASTURELAND, (EXCL CROLAND & WOODLAND)—ACRESb |
| Grazing land irrigated | AG LAND, (EXCL HARVESTED CROPLAND), IRRIGATED—ACRESb |
| Grazing land non-irrigated | Grazing land − grazing land irrigatedc |
| Fallow | AG LAND, CROPLAND, (EXCL HARVESTED & PASTURED), CULTIVATED SUMMER FALLOW—ACRESb |
| Idle | AG LAND, CROPLAND, (EXCL HARVESTED & PASTURED), IDLE—ACRESb |
| Fallow_idle | Fallow + idlec |
| Commodity/crop | See Supplementary Appendix A for details |
| NT | PRACTICES, LAND USE, CROPLAND, CONSERVATION TILLAGE, NO-TILL—ACRESb |
| RT | PRACTICES, LAND USE, CROPLAND, CONSERVATION TILLAGE, (EXCL NO-TILL)—ACRESb |
| IT | PRACTICES, LAND USE, CROPLAND, CONVENTIONAL TILLAGE—ACRESb |
| UT | Cropland − NT − RT − ITc |
| Cover | PRACTICES, LAND USE, CROPLAND, COVER CROP PLANTED, (EXCL CRP)—ACRESb |
| Hay | HAY—ACRES HARVESTEDb |
| Haylage | HAYLAGE—ACRES HARVESTEDb |
| Cropland pastured | AG LAND, CROPLAND, PASTURED ONLY—ACRESb |
| Available for cover crop | Cropland − cover − hay − haylage − cropland pasturedc |
NT = acres reported as no-till; RT = acres reported as reduced tillage; IT = acres reported as intensive tillage; UT = unknown/non-reported tillage acres.
Query string used to download AgCensus data using the rnassqs package in R.
Equation used by CaRPE to calculate acreage.
Previous practice adoption
In 2012 and 2017, the AgCensus queried participants about the number of acres under cover crop and under three tillage practices (no-till, reduced till and intensive till). These data provide a unique opportunity to explore the spatial distribution of adoption and CO2e reduction potential associated with previous adoption and where to prioritize future expansion (16). For example, counties with relatively high adoption levels of cover cropping or conservation tillage can be targeted to determine the key drivers of success and then used as models to help expand adoption within that county or neighboring counties with similar cropping systems All other practices do not have information on practice adoption at the county level in the AgCensus. As a result, existing adoption acreages and percentages are not calculated in CaRPE.
A cover crop as defined in the AgCensus is a crop planted primarily to manage soil erosion, soil fertility, soil quality, water, weeds, pests and diseases (17). In CaRPE, percent cover crop adoption was calculated by excluding pastured cropland, hay and haylage acres from total cropland acres since it is not practical to apply a cover crop to these perennial acres. We attempted to remove conservation reserve program (CRP) acres from the total cropland available for cover crops because this is the land previously converted to perennial systems However, when we evaluated the data at the county level, subtracting CRP acres occasionally resulted in unrealistic adoption levels (>100% adoption and/or no available acres). According to the AgCensus instructions, CRP acres may be reported in cropland categories such as ‘cropland harvested or cropland idle’ (17). We were unable to consistently correct these errors and did not adjust these acres when estimating percent cover crop adoption. Although cover cropping is most common during the winter following fall harvest, it is possible to plant a cover crop on winter wheat (18, 19); thus, these acres also remain in the denominator used in CaRPE.
Current percent no-till, reduced tillage and intensive tillage adoption were calculated using the sum of the reported tillable acres from the AgCensus report (Figure 2). The categories included (i) acres in no-till, (ii) acres in reduced tillage and (iii) acres in intensive tillage. The AgCensus defines these tillage practices according to the level of disturbance and the amount of residue remaining on the soil surface (17). In general, no-till is cropland where the soil is not disturbed through tillage other than what occurs during planting. Reduced tillage refers to management that leaves at least 30% residue cover on the soil and intensive tillage inverts or mixes 100% of the soil surface leaving less than 15% of crop residue. The difference between reported tillable acres and total cropland acres did not equal zero; thus, a fourth category ‘unknown tillage acres’ is included. We hypothesize that many of these acres were part of those reported as hay and haylage acres, but no further information is provided in the AgCensus, so users should proceed with caution when including these acres in any estimates.
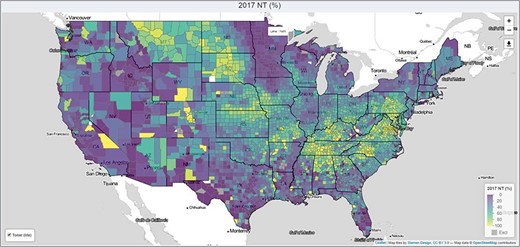
2017 no-till adoption (%) as reported in CaRPE.
COMET-Planner data
COMET-Planner emission reduction coefficients (ERCs) were downloaded on 5 August 2020 directly from the website (http://comet-planner.com/) and as of the time of writing, are the most current estimates. A subsection of practices for cropland (Table 2) and grazing land (Table 3) were selected and used in CaRPE. A brief description of the approach used by COMET-Planner to generate the ERCs is provided later, and additional descriptions for the quantification methods can be found in the COMET-Planner companion report (20). The COMET-Planner ERCs for each of the conservation management practices were estimated using a sample-based, metamodeling approach with COMET-Farm (https://comet-farm.com/), which employs USDA entity-scale inventory methods (21) to estimate the average impact of a conservation practice compared to baseline conditions, over a range of soils, climate and cropland management (e.g. see Tables 2 and 3 for baseline and new conditions for selected practices). Although ERCs are reported by county, the modeling effort was scaled to multi-county regions as defined by the USDA-NRCS Major Land Resources Areas (MLRAs). MLRAs are geographically associated land resource units that have similarities in physiography, geology, climate, soils, biological resources and land use (22).
The six cropland management and five cropland conversion conservation practices used in CaRPE, including a summary of the baseline and new condition assumptions as described in COMET-Planner
| Management category | Conservation practicea | COMET baseline condition | COMET new condition |
|---|---|---|---|
| Cropland management | Cover cropb | No cover | Addition of legume seasonal cover crop with 50% fertilizer N reduction |
| No cover | Addition of seasonal non-legume cover with 25% fertilizer N reduction | ||
| Residue and tillage managementb | Intensive tillage Intensive tillage | Reduced tillage No-till/strip tillage | |
| Reduced tillage | No-till/strip tillage | ||
| Organic nitrogen applicationb,c | Only synthetic N fertilizer | 20% of synthetic N replaced by organic N source over 5 years (4% reduction per year) | |
| Conservation crop rotation | Fallow or no perennials in rotation | Addition of perennials in the rotation and (in the west) decreasing duration of fallow | |
| Mulching | No mulch added | Mulch applied to cropland (such as straw or crop residues) | |
| Strip croppingb | Only annual crops grown | Addition of grasses, legumes or other perennial cover grown in strips with annual crops | |
| Cropland conversion | Alley/multi-storey cropping | Conventionally managed and fertilized annual cropland field | Replace 20% of cropland with unfertilized, woody plants |
| Hedgerow planting | Conventionally managed and fertilized annual cropland | Replace a strip of cropland with one row of unfertilized, woody plants | |
| Tree/shrub establishment | Conventionally managed and fertilized annual cropland | Cropland replaced with unfertilized, woody plants | |
| Cropland to herbaceous coverd | Conventionally managed, irrigated or non-irrigated, annual cropland | Cropland converted to permanent unfertilized grass cover | |
| Conventionally managed, irrigated or non-irrigated, annual cropland | Cropland converted to permanent unfertilized grass/legume cover | ||
| Forage and biomass plantingb | Conventionally managed, irrigated or non-irrigated, annual crop rotation | Cropland converted to continuous unfertilized grass/legume forage/biomass crops |
Practice names were modified from those originally reported by COMET-Planner.
Emission reduction coefficients vary depending on irrigated or non-irrigated land.
COMET-Planner refers to this practice as ‘nitrogen management’. It was renamed in CaRPE to better reflect the assumptions used. The organic sources of N to partially replace synthetic N include beef feedlot, chicken broiler, chicken layer, dairy, sheep or swine manures and compost with C:N ratios of 10, 15, 20 or 25.
COMET-Planner lists multiple options under this practice (20). However, the baseline and new conditions as implemented by COMET are the same and resulted in the same ERC.
The four grazing land management and three grazing land conversion conservation practices used in CaRPE, including the baseline and new condition assumptions as described in COMET-Planner
| Management category | Conservation practice | COMET baseline condition | COMET new condition |
|---|---|---|---|
| Grazing land management | Silvopasture | Existing unfertilized grazing land without trees/shrubs | Tree/shrub planting on grazed grasslands |
| Prescribed grazinga | Degraded grazing lands with extensive pasture management (60% forage removal) | Intensively managed grazing (40% forage removal) at 21-day intervals | |
| Range planting | Degraded or native conditions | Seeding forages to improve rangeland conditions | |
| Organic nitrogen applicationa,b | Only synthetic N fertilizer | 20% of synthetic N replaced by organic N source over 5 years (4% reduction per year) | |
| Grazing land conversion | Alley cropping | Rangeland or managed pasture | Replace 20% of grazing land with unfertilized, woody plants |
| Hedgerow planting | Rangeland or managed pasture | Replace a strip of grazing land with one row of unfertilized, woody plants | |
| Tree/shrub establishment | Rangeland or managed pasture | Grazing land replaced with unfertilized, woody plants |
Emission reduction coefficients vary depending on irrigated or non-irrigated land.
COMET-Planner refers to this practice as ‘nitrogen management’. It was renamed in CaRPE to better reflect the assumptions used. The organic sources of N to partially replace synthetic N include beef feedlot, chicken broiler, chicken layer, dairy, sheep or swine manures and compost with C:N ratios of 10, 15, 20 or 25.
Within a given practice, baseline conditions represent common management practices that include minimal use of conservation-focused management practices (e.g. the baseline condition for cover crop would be an annual row crop under fallow). Within the 227 MLRAs in the conterminous USA, approximately 100 points per cropland and grazing land categories were used and translated to modeling over 17 000 and 16 000 cropland or grassland points, respectively. Crop rotations (information needed in the COMET-Farm tool) were constructed from the cropping sequence extracted from the Cropland Data Layer (https://nassgeodata.gmu.edu/CropScape/). Other sources of data for the modeling effort included nitrogen fertilizer rates for major crops, planting and harvest dates and tillage and residue management (https://www.nass.usda.gov). The COMET-Planner team then modeled scenarios in COMET-Farm through an API. An example of a COMET-Farm API input file is also found in the study by Swan et al. (20).
The full mitigation potential of each practice is the combined effect of GHG emissions and soil carbon sequestration changes and is expressed as net tonnes of CO2e acre−1 year−1. A positive value indicates a net climate benefit, whereas a negative value indicates a net loss of carbon and/or increased GHG emissions. Reported estimates represent field emissions and carbon sequestration only (e.g. carbon sequestered in soils and woody biomass) and do not include off-site emissions (e.g. from transportation, processing, etc.).
CO2e reduction potentials are a global warming potential weighting, based on radiative forcing over a 100-year time scale, resulting from the release of 1 kg of a substance as compared to 1 kg of CO2 (23). In COMET-Planner, the two main GHGs reported for each conservation practice are CO2 and N2O. CO2 has a global warming potential of 1 and is used as the reference, and N2O has a global warming potential of 298 (1). It is assumed by COMET-Planner, and therefore CaRPE, that once a practice is implemented, it remains in place to realize its full potential. However, increases in soil carbon stocks do not continue indefinitely; thus, a 10-year duration is recommended, although longer periods may be necessary to reach a new equilibrium condition (20). Net values, as reported by COMET-Planner, were estimated over a 10-year duration and reported on an annual basis by dividing the total model-estimated changes by 10.
Because the ERCs for most of the cropland management, cropland to herbaceous cover and two of the grazing land practices differ on irrigated and non-irrigated lands (Tables 2 and 3), we calculated a weighted ERC (wERC) for each relevant practice to account for the distribution of irrigated cropland or grazing land. The resulting wERCs are then applied to the appropriate acreages selected in the various user-defined scenarios of CaRPE. In addition to irrigation status, several practices in COMET-Planner have multiple ERCs depending upon the practice options selected (e.g. legume or non-legume cover crops). Once the user selects the acreages to be applied to each practice option, the appropriate ERCs are applied to those acres (Figure 3).
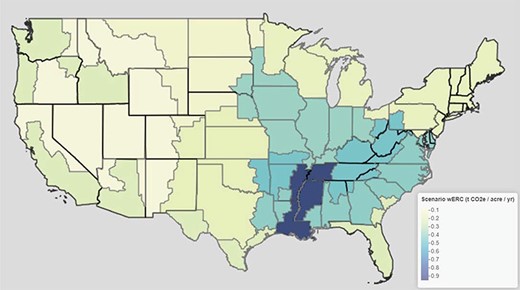
Cover crop wERCs with default scenario options.
Scaling options
The CaRPE tool allows users to select acres based on the land use category and vary the percentage of cropland or grazing land that implements a conservation management practice to meet specific objectives, address local limitations, etc. The tool provides multiple levels to synthesize and visualize results. The following options are available:
Users select an area of interest:
All 48 US conterminous states
An individual state or multiple states (regardless of region)
A geographic region or multiple geographic regions
Can also be refined to certain states within any given region
A Farm Resource Region (FSR) or multiple FSRs
Can also be refined to certain states within any given region. It should be noted that some states fall under one or more FSR. When users filter data by FSR, only those portions of the state associated with the selected FSR will be displayed and tabulated.
Acres may be limited to those under a given commodity or multiple commodities. Any combination of these acres may be selected in CaRPE and used as the available acreages for practice adoption (Figure 4).
Once an area of interest is selected, users choose to aggregate results at county, state or regional levels (e.g. Figure 5).
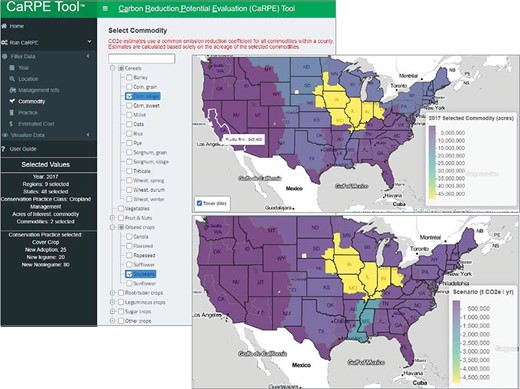
CaRPE screenshot showing an example of limiting acres to grain corn and soybeans, a map pooled by region showing the distribution of those acres across the nine FSRs and the distribution of the tonnes of CO2e reduction potentials resulting from a cover crop scenario using the default settings.
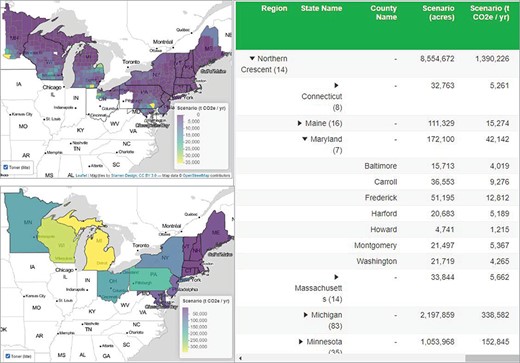
Map of the Northern Crescent region viewed at county and state pooling levels with tabular data reported at the county level. Scenario settings included adoption of 25% available cropland adopting a cover crop (20% legume and 80% non-legume) and assumed that 2017 acres in cover crop were composed of 10% legume and 90% non-legume.
Users may choose from four geographic regions (northeast, Midwest, southern and western) or nine FSRs. The FSRs were defined by the USDA Economic Research Service and align with the geographic distribution of US farm production (24). The boundaries for these regions cross state lines and represent areas where dominant commodities are produced with similar physiographic, soil and climatic traits. The nine FSRs are (i) Basin and Range, (ii) Fruitful Rim, (iii) Northern Great Plains, (iv) Prairie Gateway, (v) Heartland, (vi) Mississippi Portal, (vii) Northern Crescent, (viii) Eastern Uplands and (ix) Southern Seaboard.
Only one practice may be used at a time, and results are generated in tabular and map outputs and may be downloaded in .csv (tabular) or .png (map) format, respectively. A description of the CaRPE graphical user interface (GUI) and more details on navigating the functions in CaRPE are found in Supplementary Appendix B and the user guide available in the CaRPE tool website (https://carpe.shinyapps.io/CarpeTool/).
Considerations for running scenarios
While CaRPE allows users to run scenarios on all available acres (i.e. 100% of total cropland acres) and can provide theoretical and technical maximums, we recommend users consider the following when developing an ambitious plan to ensure that it is grounded in achievable and practical boundaries:
Not all conservation practices may be suitable or practical to all land use types. County- or region-based agricultural experts (e.g. university extension, soil and water conservation districts, NRCS, certified crop consultants and other agricultural consultants) should be consulted to establish achievable yet ambitious goals and ensure that implementation meets the stated assumptions by COMET-Planner.
When selecting commodity or crop-specific acres, note that acreage data for conservation practices are not commodity-specific, so 2012 and 2017 practice adoption acreages and percentages were not calculated in CaRPE.
Target levels should be set at an appropriate timescale based on factors such as available resources, incentive programs and regulations.
Review the current adoption levels of reported practices such as cover cropping and tillage. Take into consideration the total acreage in each county as 100% adoption may occur in counties with low crop acreage. Identify areas of high adoption and areas of relatively low adoption where similar cropping systems and growing conditions exist.
Equalize the area of interest by increasing the adoption levels to that of the best-performing areas. When determining the target level, it is important to consider the area size and any outliers. Alternatively, levels can be set to exceed these (e.g. double the acres under cover cropping across the region).
The interpretation of CO2e reduction potential for 2012 and 2017 cover crop and conservation tillage acres must take into consideration that some of the reduction potential may have already been realized and should not be included when scaling over time. For example, conservation tillage practices have been used for multiple decades beyond the 10-year modeled estimate used to generate the ERCs.
For other practices where current adoption levels are unknown, setting adoption at 15, 25 and 50% of total acres is a good starting point.
Practices under cropland conversion and grazing land conversion take land out of production; thus, it is suggested to limit the maximum conversion to 25% of total acres (Figure 6).
For the organic N application practice, select the manure or compost that best represents availability across the state. For example, states that have large dairy operations could select replacing 15% of synthetic N with dairy manure.
Although CaRPE does not estimate commodity-specific reduction potentials, limiting acres based on a commodity or multiple commodities may aid in selection of appropriate adoption levels.
For example, it may be desired to restrict acres to major row crops (e.g. cereals, oilseed crops and cotton). Levels of practice adoption that are more relevant to these crops (e.g. cover cropping, conservation crop rotation and conservation tillage practices) can then be assigned.
Other crops can be selected to run practices that are more appropriate for a smaller amount of acreage. For example, adding compost, manure and mulches might be implemented at a higher percentage in vegetable and other specialty crops compared to major row crops.
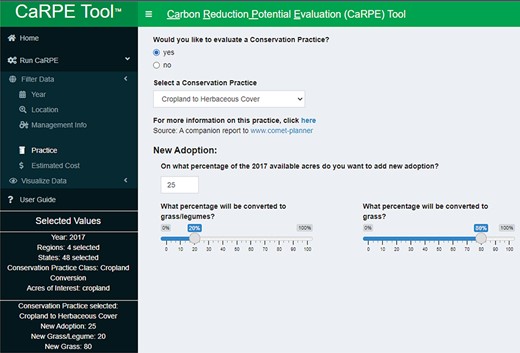
Example of the cropland to herbaceous cover practice illustrating user-defined variables for percent new adoption and what percent will be converted to grass/legume or grass. Because conversion options remove cropland or grazing land from production, it is recommended to not exceed 25% new adoption without adequate justification.
Conclusion
The CaRPE tool is a GUI-driven, interactive, web-based tool that allows users to scale potential GHG emission reductions and carbon sequestration benefits from multiple cropland and grazing land conservation practices consistently across the USA. CaRPE currently relies on data generated from national modeling efforts (i.e. COMET-Planner) and agricultural inventory (i.e. AgCensus) sources, and as these databases are updated, CaRPE will be updated accordingly. We recognize that modelled estimates, especially those conducted across a multi-county region, represent a broad range of expected values and are not intended to be used beyond general planning purposes. As databases and modeled estimates are updated and improved, CaRPE can easily be revised accordingly to improve accuracy and applicability. The multiple scaling features of CaRPE provide the ability for user-defined boundaries to be set to address local to regional goals and limitations. By giving users the ability to conduct their own scenarios at different spatial–temporal scales, CaRPE offers the ability to help decision makers develop potential targets of adoption and their potential outcomes that can inform decisions related to resource prioritization and planning efforts.
Supplementary material
Supplementary material is available at Database online.
Data Availability
CaRPE Tool is available at: https://carpe.shinyapps.io/CarpeTool/.
Conflict of interest
None declared.
References
Author notes
The findings and conclusions in this publication are those of the authors and should not be construed to represent any official USDA or US Government determination or policy.
