


Abstract
Major depressive disorder (MDD) is a pressing global health issue. Its pathogenesis remains elusive, but numerous studies have revealed its intricate associations with various biological factors. Consequently, there is an urgent need for a comprehensive multi-omics resource to help researchers in conducting multi-omics data analysis for MDD. To address this issue, we constructed the MDDOmics database (Major Depressive Disorder Omics, (https://www.csuligroup.com/MDDOmics/), which integrates an extensive collection of published multi-omics data related to MDD. The database contains 41 222 entries of MDD research results and several original datasets, including Single Nucleotide Polymorphisms, genes, non-coding RNAs, DNA methylations, metabolites and proteins, and offers various interfaces for searching and visualization. We also provide extensive downstream analyses of the collected MDD data, including differential analysis, enrichment analysis and disease-gene prediction. Moreover, the database also incorporates multi-omics data for bipolar disorder, schizophrenia and anxiety disorder, due to the challenge in differentiating MDD from similar psychiatric disorders. In conclusion, by leveraging the rich content and online interfaces from MDDOmics, researchers can conduct more comprehensive analyses of MDD and its similar disorders from various perspectives, thereby gaining a deeper understanding of potential MDD biomarkers and intricate disease pathogenesis.
Database URL: https://www.csuligroup.com/MDDOmics/
Introduction
Major depressive disorder (MDD) is a globally prevalent psychiatric disorder characterized by persistent episodes of depressed mood and/or loss of pleasure in activities for long periods (1). The World Health Organization’s 2023 statistics report states that 3.8% of the global population suffers from MDD, including 5% of adults and 5.7% of adults older than 60 years (2). In addition, MDD is a severely disabling disorder (3, 4). Different from the general population, individuals diagnosed with MDD are more inclined to self-harm, suicidal behaviours and concurrent illnesses, which severely affect their daily lives. Since MDD can manifest in multiple forms with different combinations of heterogeneous symptoms, it remains a challenge for accurate clinical diagnosis and treatment, especially in the context of other illnesses (5, 6). As a result, there is growing attention to this disorder among the public. However, no exact pathological theory can independently account for its pathogenesis (7). An increasing amount of evidence indicates that both genetic and environmental factors contribute to MDD (8, 9), affecting patients at multiple omics levels. For example, genome-wide association studies (GWAS) conducted on diverse populations have identified many SNP loci related to MDD (10, 11). Differential analysis of diverse tissue samples has found specific differentially expressed genes and methylation sites in MDD patients (12–14). Studies on metabolites and proteins in urine and blood also revealed numerous potential biomarkers for MDD (15, 16).
A significant portion of current research on MDD is based on single-omic data (17). Single-omics data analysis is valuable in specific research scenarios, but it has limitations in capturing the intricacy of complex disorders (like MDD, which involves myriad factors) from a singular perspective. Integrative multi-omics data analysis has been proven to be capable of offering a more in-depth and comprehensive solution for diseases (18–20). ProMENDA (21) is a comprehensive repository that integrates all known metabolomic and proteomic data related to MDD. It collected 18 164 differential metabolite entries from 1018 studies, as well as 19 553 differential protein entries from 207 studies. Despite its breadth, ProMENDA does not provide analytical results or visualization interfaces for its collected data, and its scope is confined to the above two types of omics data. Consequently, there is an urgent need to provide a more comprehensive multi-omics resource to assist researchers in their multifaceted analyses for MDD.
In this paper, we have established a database platform named ‘MDDOmics’ (Major Depressive Disorder Omics, https://www.csuligroup.com/MDDOmics/), which integrates 41 222 multi-omics data entries and several original datasets related to MDD, sourced from published studies and public databases and complemented by our analytical results. This comprehensive compilation spans a series of omics data, including SNPs, genes, non-coding RNAs (ncRNAs), DNA methylations, metabolites and proteins. To facilitate a deeper understanding of this data, MDDOmics is equipped with a suite of visualization interfaces, which allow researchers to explore and interpret complex datasets intuitively. We have employed various computational methods to analyse the public data, including differentially expressed gene analysis, differential methylation analysis and enrichment analysis. Moreover, MDDOmics offers prediction results of potential MDD-associated genes and ncRNAs generated using a network impulsive dynamics-based approach. Considering the clinical challenges in distinguishing MDD from similar psychiatric disorders, MDDOmics also collected multi-omics data on schizophrenia, bipolar disorder and anxiety disorder, which may help to discern these intricate disorders with greater precision.
Materials and methods
Public data sources
There are three types of public data sources used to extract MDD-related data in this study: the comprehensive databases for disease-related entities (22) (e.g. DisGeNET (23) v7.0, RNADisease v4.0 (24), CircR2Disease v2.0 (25) and LncRNADisease v3.0 (26)), the disease-specific databases (e.g. SZDB v2.0 (27), SZGR v2.0 (28) and dbBIP (29)) and the authoritative literature related to MDD.
Regarding the comprehensive databases, we have extracted most of the related SNP and gene data from DisGeNET v7.0 (23), as well as the related ncRNA data from DisGeNET (23) v7.0, RNADisease v4.0 (24), CircR2Disease v2.0 (25) and LncRNADisease v3.0 (26). In addition, we collected MDD-related expression and methylation data from the NCBI’s Gene Expression Omnibus (GEO) (12, 30–33) database for differential analysis. For the disease-specific databases, we have extracted the MDD-related metabolites and proteins from the ProMENDA (21) database, the schizophrenia multi-omics data from SZDB v2.0 (27) and SZGR v2.0 (28), as well as the bipolar disorder data from dbBIP (29). Data manually retrieved from the literature account for a minor portion of the total multi-omics data, which was obtained by querying PubMed using disease-related keywords and handpicking several essential findings from recent years.
We curated and annotated the collected data with the help of publicly available knowledge. We employed the HUGO Gene Nomenclature Committee (HGNC) (34) database to harmonize the gene symbols. For the annotation of genes and SNPs, we considered such databases as Gene (35) and dbSNP (36), as well as R packages like biomaRt (37) and clusterProfiler (38). As for the ncRNA data, we used the LNCipedia (39) database for lncRNAs, the Circad (40) and circBase (41) databases for circRNAs and the miRBase (42) database for miRNA.
In order to enrich visualization information, we leveraged data from the STRING (43) database and WashU EpiGenome Browser (44). To assist in downstream analyses, we also utilized network data from STRING (43), RNAInter (45), the Biological General Repository for Interaction Datasets (46), HumanNet (47), TissueNet (48) and HumanBase (49), as well as several datasets mentioned in the Weighted Enrichment Analysis Tool (WEAT) (50) method.
In addition to research-related entries, we also collected several original multi-omics datasets related to MDD to facilitate further study by researchers. We collected expression and methylation datasets from the GEO (33) database, GWAS results from organizations like Psychiatric Genomics Consortium (10, 11, 51–53), CONVERGE (54), iPSYCH (55), etc. (56), and metabolite and protein level data from Metabolite Workbench (57) and ProteomeXchange (58), respectively.
Differential analysis
We retrieved several credible MDD-related methylation and expression datasets from the GEO database, focusing on brain tissue and blood samples. Some datasets were subsequently segmented by tissue (e.g. different brain regions) or batch, in order to maximize the specificity of various tissues and reduce the biases caused by batch effects.
We primarily used the R package ‘ChAMP’ (59) to analyse the methylation data. To minimize inaccuracies introduced by experiments and samples, we did normalization and corrected batch effects on covariates affecting the data. Subsequently, we employed the provided functions to identify the differential methylation sites and regions between control and case groups. For the gene expression datasets, we mainly used the R package ‘limma’ (60) for analysis, which has been a widely recognized tool for gene discovery through differential expression analysis. Similarly, we adjusted the covariates such as age, gender, brain pH value, etc. The results of the analysis were all integrated into the MDDOmics.
Enrichment analysis
We have conducted the enrichment analysis of the Kyoto Encyclopedia of Genes and Genomes (KEGG) pathway and the Gene Ontology (GO) term on the collected MDD-related genes and subsequently integrated the results into the database. Initially, we adopted the conventional method based on the hypergeometric distribution, which is a prevalent approach for enrichment analysis. This method treats each gene in a set with equal significance. However, in practical scenarios, different genes corresponding to biological pathways and terms often vary in their contributions and importance. This suggests that the classical method may lead to biased results. To address this, we turned to the WEAT (50) method, a weighted functional enrichment method based on the hypergeometric test by introducing a prior weight to each gene. This method prioritizes GO terms or KEGG pathways based on a higher essentiality score from hitting genes rather than the sheer number of hits.
First, we standardized all MDD-related genes collected in our database into the form of Entrez IDs and entered them into the R package clusterProfiler (38) for the conventional enrichment analysis and the WEAT (50) online website for the weighted functional enrichment analysis. Regarding the essentiality score, we used the disease-gene association score from the DisGeNET (23) database, where a higher score for a gene indicates a stronger association with MDD. Additionally, we selected the gene essentiality score derived from expression profiles of the blood and brain tissues in GTEx, which was derived from the WEAT method study (50, 61). This decision is based on the pivotal role of these tissues in MDD research: the brain is the primary site of MDD disorder pathology, while blood serves as a minimally invasive source that can reflect molecular changes related to MDD, such as immune and inflammatory molecules (17, 62–65).
Disease-gene prediction
In MDDOmics, we have predicted MDD-related candidate genes and ncRNAs by conducting a network propagation process—network impulsive dynamics on a comprehensive biological network, which has been demonstrated to be highly effective in the case study of MDD (66). We constructed the comprehensive network by integrating multiple types of associations, including disease-gene and ncRNA associations from MDDOmics, as well as the protein–protein interactions (PPIs) (43, 46–49), ncRNA-gene (45) associations and so on. We also chose the text-mining-based method (67) to construct a disease similarity network using disease symptoms. Several PPI networks are integrated as options, which include comprehensive and tissue-specific PPI networks. We selected the comprehensive PPI networks from STRING (43), BIOGRID (46) and HumanNet (47) databases, along with the brain tissue-specific networks sourced from the TissueNet (48) and HumanBase (49) databases.
Of particular note, in order to speed up the algorithm, we have applied certain filtering to large networks. When using the ncRNA-ncRNA/gene networks from the RNADisease (24) database, we only used edges with strong interactions. For large networks from HumanBase and STRING, we set thresholds of 0.2 and 0.4 to filter out low-confidence edges. In addition, to construct a heterogeneous network among different types of networks, we uniformly converted all the nodes’ names to gene symbols using the HGNC (34) online tool.
Visualization
For the collected MDD-related genes, we constructed a comprehensive protein–protein physical interaction network by using data from the STRING (43) database. This network not only enables users to gain insight into the molecular-level interactions of these genes but also assists in identifying potential essential genes through the core nodes, which could be crucial for understanding the biological mechanism underlying MDD.
Additionally, to highlight the similarities and differences between MDD and related disorders, we developed a visualization interface to showcase the cross-analysis of these four psychiatric disorders from the perspectives of both diseases and biological factors.
To clearly visualize the exact chromosomal locations of potential biological factors related to MDD, our platform displays the chromosomal coordinates of all related SNPs, genes, ncRNAs and DNA methylations. This helps researchers swiftly locate their areas of interest, greatly facilitating subsequent experimental planning. Furthermore, we have integrated two tracks from the WashU EpiGenome Browser (44), providing users with more detailed annotation information.
Results
Database summary
MDDOmics has integrated a total of 80 429 biological entries and several datasets from six omics across four psychiatric disorders, with a primary focus on MDD. Figure 1 displays the framework of the database, detailing the organization of its various pages. The primary data are displayed through the ‘Browse’ and ‘Search’ sections. The ‘Analysis’ section presents a suite of analytical results pertaining to collected MDD data, encompassing GO and KEGG pathway enrichment analyses using both conventional and WEAT (50) methods, as well as differential expression and methylation analyses, and the prediction of MDD-related candidate genes and ncRNAs. The ‘Visualization’ section includes three interfaces: ‘PPI’, ‘Relation’ and ‘Location’, offering interactive graphical representations. Furthermore, users can access data downloads, instructional guides and other database information on the ‘Download’, ‘Tutorial’ and ‘About’ pages, respectively.
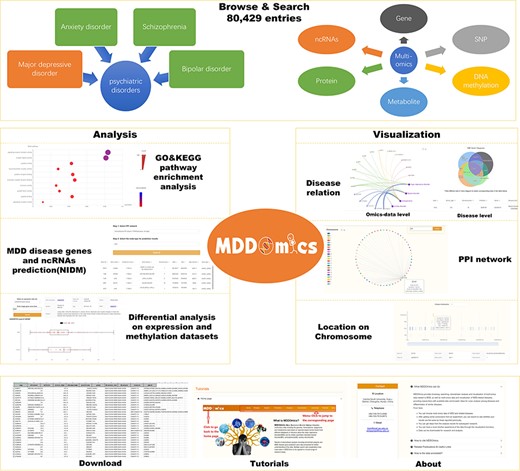
MDDOmics overall framework, which includes seven types of interfaces to the database.
Web implementation
The website overall adopts a front-end and back-end separation framework, utilizing an efficient and flexible technology stack. The front end uses Vue2 (https://v2.vuejs.org/) as the core framework, providing a data-driven view layer that efficiently manages dynamic updates to the user interface. By integrating Axios (https://github.com/axios/axios), the project achieves asynchronous HyperText Transfer Protocol communication with back-end services. It also uses the Element-UI (https://element.eleme.io) framework, which supplies a comprehensive set of pre-defined components. Moreover, it incorporates two powerful visualization toolkits, ECharts (https://echarts.apache.org) and highcharts (https://api.highcharts.com), for constructing highly interactive data visualization charts. The back end adopts the SpringBoot (https://spring.io/projects/spring-boot) framework, using its auto-configuration feature to simplify the configuration work. Moreover, MyBatis (https://blog.mybatis.org) and MyBatis-Plus (https://baomidou.com) are used for data persistence operations. The database system employs MySQL (https://www.mysql.com) as the storage solution, which is responsible for holding all multi-omics data.
The website is freely available to all without the need for registration or login. Designed for cross-platform compatibility, it ensures a user-friendly interface across computers, smartphones and tablets for broad accessibility.
Data statistics
As shown in Table 1, we collected 41 222 entries about MDD from various public databases and literature. Most SNP and gene data were sourced from the DisGeNET (23) database. The majority of ncRNA entries were from DisGeNET (23) and RNADisease (24) databases. DNA methylation data, limited in number, were exclusively collected from manually curated literature. The relevant protein and metabolite entries were entirely sourced from the ProMENDA (21) database. Besides, we have also collected several publicly available original datasets from studies on human MDD. These include 39 gene expression datasets, 13 ncRNA level datasets, 6 DNA methylation datasets, GWAS results from 4 organizations, 8 protein level datasets and 7 metabolite level datasets. Links to these datasets are provided on the ‘Download’ page for further investigation.
MDDOmics data statistics
| Disease | Omics | Source | Number of entries | ||
|---|---|---|---|---|---|
| MDD | SNP | DisGeNET v7.0 (76) | 1469 | 1474 | 41 222 |
| Manual retrieval | 45 | ||||
| Gene | DisGeNET v7.0 | 1209 | 1396 | ||
| Manual retrieval | 245 | ||||
| ncRNA | DisGeNET v7.0 | 59 | 369 | ||
| RNADisease v4.0 (77) | 309 | ||||
| CircR2Disease v2.0 (78) | 5 | ||||
| LncRNADisease v3.0 (79) | 5 | ||||
| Methylation | Manual retrieval | 501 | 501 | ||
| Metabolite | ProMENDA (80) | 18 039 | 18 039 | ||
| Protein | ProMENDA | 19 443 | 19 443 | ||
| Bipolar disorder | SNP | DisGeNET v7.0 | 874 | 2944 | 10 839 |
| dbBIP (81) | 2081 | ||||
| Manual retrieval | 21 | ||||
| Gene | DisGeNET v7.0 | 1112 | 6837 | ||
| dbBIP | 6246 | ||||
| ncRNA | DisGeNET V7.0 | 48 | 1058 | ||
| RNADisease v4.0 | 77 | ||||
| dbBIP | 939 | ||||
| LncRNADisease v3.0 | 5 | ||||
| Schizophrenia | SNP | DisGeNET V7.0 | 2933 | 3131 | 27 369 |
| SZDB2.0 (82) | 402 | ||||
| Gene | DisGeNET V7.0 | 2649 | 11 478 | ||
| SZDB2.0 | 10 336 | ||||
| SZGR2.0 (83) | 1323 | ||||
| ncRNA | DisGeNET V7.0 | 120 | 662 | ||
| SZDB2.0 | 463 | ||||
| SZGR2.0 | 6 | ||||
| RNADisease v4.0 | 146 | ||||
| CircR2Disease v2.0 | 5 | ||||
| LncRNADisease v3.0 | 2 | ||||
| Methylation | SZDB2.0 | 11 616 | 12 098 | ||
| SZGR2.0 | 482 | ||||
| Anxiety disorder | SNP | DisGeNET V7.0 | 169 | 169 | 999 |
| Gene | DisGeNET V7.0 | 795 | 795 | ||
| ncRNA | DisGeNET V7.0 | 21 | 35 | ||
| RNADisease v4.0 | 14 | ||||
Additionally, MDDOmics includes 10 839 entries of bipolar disorder, 27 369 entries of schizophrenia and 999 entries of anxiety disorder, with a substantial portion sourced from the DisGeNET (23) database. Moreover, for bipolar disorder, the primary data source was the dbBIP (29) database, whereas schizophrenia-related entries were primarily derived from the SZDB (27) and SZGR (28) databases.
Search and analysis
To better accommodate users’ requirements, we designed a variety of detailed search ways according to different omics. Taking the SNP search as an example, users can not only search via the SNP ID but also leverage the gene name, disease phenotype and the range of SNP locations. Similarly, for metabolite searches, users have the flexibility to search using the Human Metabolome Database ID, PubChem ID, metabolite name, metabolite category and experiment tissue.
To ensure that users can access the required information more efficiently and conveniently, we have refined our search tools, incorporating several user-friendly features. For example, recognizing that some genes may possess multiple aliases, the database is configured to search simultaneously by both the gene names and their corresponding aliases. In addition, the database employs a fuzzy matching strategy for some complex attributes like protein and metabolite names, significantly improving the search flexibility.
In the differential analysis interface, we have curated four datasets as detailed in Table 2. These datasets encompass gene expression and methylation profile data derived from blood and brain tissue samples of MDD patients and their corresponding controls. Box plots with scatter overlay are employed to visualize the gene expression and methylation levels across samples in the collected GEO datasets. Additionally, the interface provides the results using differential analysis tools for users’ reference. It allows users to set custom thresholds and filter criteria, facilitating the rapid identification of differentially expressed genes, methylation sites and methylation regions of interest.
Collected GEO datasets for differential analysis
| Data type | GEO accession | Tissue | Participant count |
|---|---|---|---|
| Gene expression | GSE98793 (84) | Whole blood-batch 1 | Case: 64 Control: 32 |
| Whole blood-batch 2 | Case: 64 Control: 32 | ||
| GSE102556 (85) | Cingulate gyrus 25 | Case: 13 Control: 15 | |
| Orbitofrontal | Case: 26 Control: 22 | ||
| Anterior Insula | Case: 26 Control: 22 | ||
| Dorsolateral prefrontal cortex | Case: 26 Control: 22 | ||
| Nucleus accumbens | Case: 26 Control: 22 | ||
| Subiculum | Case: 24 Control: 19 | ||
| Methylation | GSE201287 (86) | Blood | Case: 40 Control: 40 |
| GSE88890 (87) | Cortex, Brodmann area 11 | Case: 20 Control: 20 | |
| Cortex, Brodmann area 25 | Case: 17 Control: 18 |
In the enrichment analysis interface, MDDOmics integrates the KEGG pathway and GO enrichment analysis results, derived from both conventional and WEAT (50) methods. Furthermore, the database presents the top 10 terms from these enrichment results in a bubble plot, aiding users in gaining a more intuitive grasp of potential MDD-related pathways, biological processes, cellular components and molecular functions. Notably, the outcomes of our enrichment analysis are largely consistent with existing findings. For instance, the ‘Neuroactive ligand-receptor interaction’ pathway, which consistently ranks at the forefront in all our KEGG pathway analyses, has been frequently implicated in association with MDD (68–71). In addition, the biological process term ‘superior temporal gyrus development’ ranks uniquely high in the enrichment analysis results using the gene essentiality score derived from blood expression profiles. This result is in alignment with many studies that have suggested the association between the volume of the superior temporal gyrus and MDD (72–75).
The prediction interface provides the users with selectable PPI networks and types of prediction targets, allowing them to obtain the prediction results for potential MDD-related genes, lncRNAs and miRNAs, excluding the significant MDD-related factors already in the database.
Visualization
For the collected public data, MDDOmics offers three types of visualization interfaces for users to understand MDD more graphically and vividly.
The network from the ‘PPI’ interface illustrates the PPI interaction relationships of collected MDD-related genes. The nodes provide gene-related annotation information, while edges offer scores from the STRING (43) database, representing the degree of association between two genes in the network. Users can select the chromosomes of interest for their analyses. Additionally, by inputting a gene name, users can access and explore the corresponding sub-network in detail.
In the ‘Relation’ section, we show the similarities and differences of the biological factors among different disorders. From the disease perspective, we use a Venn diagram to show the intersection of the four disorders across four omics (Figure 2A). From the perspective of the omics data, we employ a relationship network to show associations between disorders and the biological factors provided by users (Figure 2B). In this network, nodes show the biological factor’s annotations (Figure 2C), while the edge thickness signifies the degree of disease-factor association as measured in DisGeNET (23) (Figure 2D).
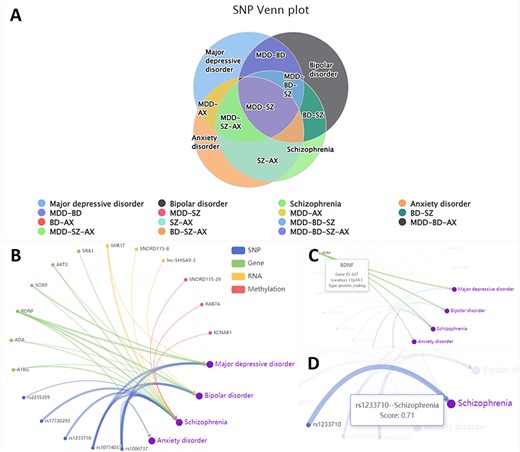
The ‘Relation’ interface shows the overlap of various omics data among different disorders by Venn plots (A). We also display the relationship between different entered omics data and disorders by the relationship network (B). Hover over nodes (C) and edges (D) to view specific information.
The ‘Location’ interface graphically presents the chromosomal locations of biological factors from four omics related to MDD. It enables users to swiftly compare the locations across different omics, facilitating the identification of regions for in-depth exploration (Figure 3A). By clicking on a biological factor in the visualization, users will be provided with detailed annotations from the MDDOmics database, as well as from the refGene and gencodeV39 tracks hosted by WashU (44) (Figure 3B).
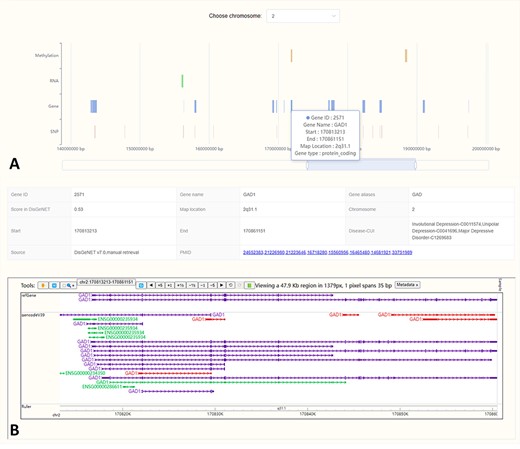
In the location visualization interface, we showed the locations of MDD-related biological factors on different chromosomes (A). Click the region of interest in the plot and the corresponding detailed annotations will be displayed below (B).
Conclusion
Considering the significant danger and widespread prevalence of MDD, there is an urgent need for a systematic platform to integrate multi-layered data from various sources. In response to this need, we developed MDDOmics, a comprehensive multi-omics database of MDD. The database integrates a large number of MDD-related entries and datasets, including SNPs, genes, ncRNAs, DNA methylations, metabolites and proteins. Several types of search and visualization interfaces are provided to make data easier to understand. It also integrates multi-omics data on schizophrenia, bipolar disorder and anxiety disorder, which are prone to clinical misdiagnosis with MDD. Several downstream analyses are conducted on the collected public data, including differential analysis, enrichment analysis and potential disease-gene predictions.
While this study has achieved progress in the field, it still has some limitations that provide important directions for future research. First, we attempted to ensure the accuracy and diversity of our assessments by retaining original correlation scores between biological factors and disorders from various sources. However, developing new scores based on a unified standard could give a more consistent perspective of data evaluations. Second, we currently rely on a limited amount of data retrieved manually from literature. Enhancing such collection efforts in the future will substantially expand the database’s comprehensiveness. Finally, our investigation into the correlations among different omics data was not deep enough. Future research should focus more on this for a more in-depth exploration and analysis to fully understand the mechanisms of MDD.
Overall, MDDOmics enables researchers to access rich, uniformly formatted multi-omics MDD data simultaneously and provides a feasible solution for the joint analysis of multi-omics data on MDD and MDD-similar disorders. It helps to develop subsequent MDD identification and stratification methods, providing researchers and clinicians with a clearer understanding of the intricate disease pathogenesis.
Conflict of interest
None declared.
Funding
The National Natural Science Foundation of China
Data Availability
All data relevant to this study are incorporated into the article or available online in the MDDOmics (https://www.csuligroup.com/MDDOmics).
Acknowledgements
This work was supported by the National Key Research and Development Project of China (Grant no. 2019YFA0706202). This work is also supported in part by the High Performance Computing Center of Central South University.
