


Abstract
Analysis of transcriptional regulatory interactions and their comparisons across multiple species are crucial for progress in various fields in biology, from functional genomics to the evolution of signal transduction pathways. However, despite the rapidly growing body of data on regulatory interactions in several eukaryotes, no databases exist to provide curated high-quality information on transcription factor–target gene interactions for multiple species. Here, we address this gap by introducing the TFLink gateway, which uniquely provides experimentally explored and highly accurate information on transcription factor–target gene interactions (∼12 million), nucleotide sequences and genomic locations of transcription factor binding sites (∼9 million) for human and six model organisms: mouse, rat, zebrafish, fruit fly, worm and yeast by integrating 10 resources. TFLink provides user-friendly access to data on transcription factor–target gene interactions, interactive network visualizations and transcription factor binding sites, with cross-links to several other databases. Besides containing accurate information on transcription factors, with a clear labelling of the type/volume of the experiments (small-scale or high-throughput), the source database and the original publications, TFLink also provides a wealth of standardized regulatory data available for download in multiple formats. The database offers easy access to high-quality data for wet-lab researchers, supplies data for gene set enrichment analyses and facilitates systems biology and comparative gene regulation studies.
Database URLhttps://tflink.net/
Introduction
Gene regulation in eukaryotes is complex, with many layers of regulation including transcription factors that are the key protein regulators of gene expression. Phenotypic evolution is closely linked to changes of gene regulation. To explore the evolution of gene regulatory networks, first we need to study and understand the individual regulators and the evolution of their interactions (1). Thus, the accurate identification of transcription factor–target gene interactions and transcription factor binding sites in multiple species is of paramount importance for studying gene regulation.
During the last two decades, our knowledge on transcriptional regulation has substantially expanded, owing to the wide utilization of experimental assays, including small- and large-scale approaches. Small-scale experimental methods can be used to verify an interaction between a specific transcription factor and its potential target gene on a case-by-case basis (see the methods in Table 1). Therefore, these methods can provide information on both the location and the nucleotide sequence of the binding site for a particular transcription factor. Large-scale methods are utilized to identify potential transcription factor–target gene interactions and transcription factor binding sites in a high-throughput manner. In vitro methods can identify protein binding events on entire nucleotide libraries, while in vivo methods are exploited to characterize transcription factor binding on the whole genome.
Small- and large-scale experimental methods to explore transcription factor–target gene interactions or transcription factor binding sites
| Evidence type | Method name | Reference |
|---|---|---|
| Small-scale | DNase-I footprinting | Galas DJ & Schmitz, 1978 (2) |
| EMSA: electrophoretic mobility shift assay | Garner MM & Revzin A, 1981 (3) | |
| SELEX: systematic evolution of ligands by exponential enrichment | Pollock R & Treisman R, 1990 (4) | |
| Promoter deletion analyses coupled to reporter assays | de Wet JR, et al., 1987 (5) | |
| Large-scale: in vitro | ChIP-on-chip: chromatin immunoprecipitation with DNA microarray | Ren B, et al., 2000 (6) |
| HT-SELEX: high-throughput systematic evolution of ligands by exponential enrichment | Jolma A, et al., 2010 (7) | |
| MITOMI: Mechanically induced trapping of molecular interactions | Rockel S, et al., 2012 (8) | |
| Large-scale: in vivo | ChIP-seq: chromatin immunoprecipitation coupled with high-throughput sequencing | Johnson DS, et al., 2007 (9); Robertson G, et al., 2007 (10) |
While the number of such experiments continue to grow, the results of the available studies are stored in scattered resources. Existing transcription factor databases either (i) capture only a few species: e.g. TRRUST (human and mouse) (11), REDfly (fruit fly) (12) or YEASTRACT (yeast) (13) (see more examples in Supplementary Table); (ii) contain a mixture of high-quality small-scale and less accurate large-scale experimental data without clear labelling: e.g. HTRIdb (14), ORegAnno (15) and YEASTRACT or (iii) fail to associate the interactions with the binding sites of transcription factors: e.g. TRRUST, YEASTRACT or JASPAR (16). The lack of a curated, large, multispecies database of transcription factor–target gene interactions and transcription factor binding sites makes comparative studies of transcription factors difficult and labour-intensive. Here, we introduce TFLink, a gateway that integrates experimental transcription factor data from a benchmarked list of existing databases (Table 2). TFLink uniquely provides highly accurate information on transcription factor–target gene interactions, genomic locations and nucleotide sequences of transcription factor binding sites for human and six eukaryotic model organisms: mouse (Mus musculus), rat (Rattus norvegicus), zebrafish (Danio rerio), fruit fly (Drosophila melanogaster), nematode (Caenorhabditis elegans) and yeast (Saccharomyces cerevisiae).
Source databases of TFLink
| Source database | Original URL | Version | Downloading date | Type of dataa | Nr. of integrated entries | Organismsb |
|---|---|---|---|---|---|---|
| DoRothEAc | https://saezlab.github.io/dorothea/ | 2 | 19/06/2020 | SS interactions | 3453 | Hs |
| GTRD | http://gtrd.biouml.org/ | 20.06 | 02/07/2020 | LS interactions | 10 685 122 | Hs, Mm, Rn, Dr, Dm, Ce, Sc |
| HTRIdb | http://www.lbbc.ibb.unesp.br/htri/d | 1 | 29/04/2017 | SS interactions | 2020 | Hs |
| LS interactions | 47 140 | |||||
| JASPAR | http://jaspar.genereg.net/ | 2020 | 22/07/2020 | SS binding sites | 3048 | Hs, Mm, Rn, Dm, Ce |
| LS binding sites | 8 567 469 | |||||
| ORegAnno | http://www.oreganno.org/e | 3 | 24/05/2017 | SS interactions | 1979 | Hs, Mm, Rn, Dm, Ce, Sc |
| LS interactions | 160 096 | |||||
| SS binding sites | 47 304 | |||||
| LS binding sites | 705 121 | |||||
| REDfly | http://redfly.ccr.buffalo.edu/ | 6.0.2 | 16/06/2020 | SS interactions | 683 | Dm |
| LS interactions | 90 | |||||
| SS binding sites | 2240 | |||||
| LS binding sites | 27 | |||||
| ReMap | http://remap.univ-amu.fr/ | 1.2 | 16/07/2018 | LS interactions | 2 933 177 | Hs |
| TRED | http://rulai.cshl.edu/cgi-bin/TREDf | – | 08/06/2018 | SS interactions | 8693 | Hs, Mm |
| TRRUST | https://www.grnpedia.org/trrust/ | 2 | 30/07/2018 | SS interactions | 16 570 | Hs, Mm |
| Yeastract | http://www.yeastract.com/ | 2020 | 20/07/2020 | SS interactions | 5349 | Sc |
| LS interactions | 188 072 |
Abbreviations: SS: small-scale experiments; LS: large-scale experiments.
Abbreviations: Hs: Homo sapiens, Mm: Mus musculus, Rn: Rattus norvegicus, Dr: Danio rerio, Dm: D. melanogaster, Ce: Caenorhabditis elegans and Sc: Saccharomyces cerevisiae.
TFLink also indicates the original source of the interactions downloaded from DoRothEA (when available), see chapter 2 in Supplementary Notes for the details.
HTRIdb is no longer available at its original website, nor in other databases, making the TFLink the only source for this data. We downloaded the content of HTRIdb in 2017, when it was still available.
There is no working website, only data can be downloaded in the form of TSV files.
TRED is no longer available at its original website; we were able to download its data from the third party via RegNetwork (24) in 2018.
Materials and methods
Data sources
We examined the available transcription factor databases (altogether 66 databases, see Supplementary Table), and integrated data from those that comply with all of the following criteria: (i) include clearly labelled experimental data of transcription factor–target gene interactions and/or transcription factor binding sites, (ii) provide information about the experimental methods or the corresponding publications, (iii) are—at least partially—the primary source of the data and (iv) are freely accessible and can be redistributed. Based on these criteria 10 databases were selected for integration: DoRothEA (17), GTRD (18), HTRIdb (14), JASPAR (16), ORegAnno (15), REDfly (12), ReMap (19), TRED (20), TRRUST (11) and Yeastract (13) (see Table 2 for details). By exploiting these database sources, we integrated accurate, small-scale experimental data and the results of large-scale experiments. We did not synthetize all the available data from the source databases, but only those entries that fulfil the rigorous criteria listed above.
Data processing, curating and database construction
To establish a database of well curated data, only the information matching with the above criteria were integrated from the source databases. We also filtered out incomplete or potentially incorrect data: for example, transcription factor binding sites with a nucleotide content of over 1500 bp (21) were excluded from the TFLink database. Data were converted to uniform formats, and the different gene or protein identifiers and names (applied by the source databases) were mapped to UniProt IDs. Besides the UniProt IDs which were applied as the main identifiers of genes or proteins in the database, we established unique TFLink IDs (starting with ‘TFLink’, followed by SS or LS indicating the small- and large-scale experiments correspondingly, and a unique number) for each transcription factor binding site, which makes the identification of binding sites unambiguous. In the integrated dataset, each interaction is present only once, while the original annotation data from all sources are preserved.
We updated the coordinates of transcription factor binding sites to the newest genome version available in any of the source databases (these were hg38 for human, mm10 for M. musculus, rn6 for R. norvegicus, dm6 for D. melanogaster, ce10 for C. elegans and saccer1 for S. cerevisiae) using the online tool, LiftOver of UCSC Genome Browser (https://genome.ucsc.edu/cgi-bin/hgLiftOver). This step ensures that the user finds reliable data on binding sites, confirmed by multiple experiments and databases (Figure 1). We identified the orthologs of the transcription factors and target genes with the Sherlock platform (22), using the ortholog table downloaded from the OMA orthology resource (23).
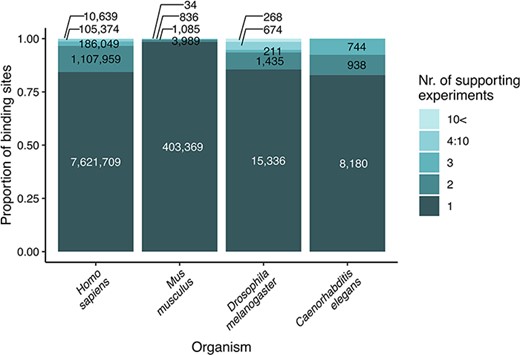
Strength of evidence (number of supporting experiments) for each transcription factor binding site, referring to the number of binding sites (for a particular transcription factor) that overlap (in at least one nucleotide length) with the investigated binding site. The original data are included as binding site tables in the download parts of the TFLink database.
TFLink was built by using static pages hosted on github (https://github.com/), on a dedicated server of the research group. The source code of the website is freely available at https://github.com/korcsmarosgroup/TFlink. We are planning to update the content of TFLink, biennially, to include the latest versions of the source databases, or even include more species and databases, as well as to translate the transcription factor binding site locations using the newest genome versions.
Results
Content
TFLink is a curated, comprehensive, non-redundant database that contains data on 3984 transcription factors, 110 808 target genes, 31 486 regulatory interactions identified by small-scale experiments and 11 826 489 interactions from large-scale experiments. It also contains 9 290 526 binding site locations and 9 325 209 corresponding binding site sequences (for species-specific statistics and explanation, see Table 1 in Supplementary Notes).
Web interface and usage
TFLink is publicly available at https://tflink.net/ without registration. The user can ‘Browse’, search and ‘Download’ all the data, find a short description and summary statistics on the main page and get the answers for ‘frequently asked questions’ at the detailed ‘FAQ’ part.
The ‘Browse’ page
After selecting the organism, the user can browse and search within the dataset. The results can be filtered by gene name, UniProt ID, NCBI Gene ID, function (e.g. ‘transcription factor’, ‘target gene’ or ‘transcription factor and target gene’) and according to evidence type (small- or large-scale experiments). TFLink differentiates between ‘transcription factor’ and ‘transcription factor and target gene’ functions based on whether the transcription factor protein regulating the gene for the particular transcription factor is known (present in the TFLink database) or not. Information on the number of interactions a particular gene or protein is involved in is also provided. After selecting an entry (gene or protein) from the Browsing table, an ‘entry page’ is opened. (Links to example entry pages are provided in chapter 3.2 of the Supplementary Notes and in the FAQ part of the TFLink gateway).
Entry pages
Each entry page contains basic information about the transcription factor protein or target gene: gene name, UniProt ID (linked to the corresponding UniProt protein page (25)), NCBI Gene ID (linked to the corresponding NCBI Gene site (26)), organism (the scientific name of the species), its function (transcription factor, target gene or both), the number of its interactions and its orthologs (species name and UniProt ID)—when there are any (Figure 2A). In case the ortholog is also available in the TFLink database, a link is provided to the related entry page. Binding site nucleotide composition frequency matrices (27) and sequence logos (28) of the transcription factors are also available through the JASPAR website to facilitate the prediction of more binding sites.
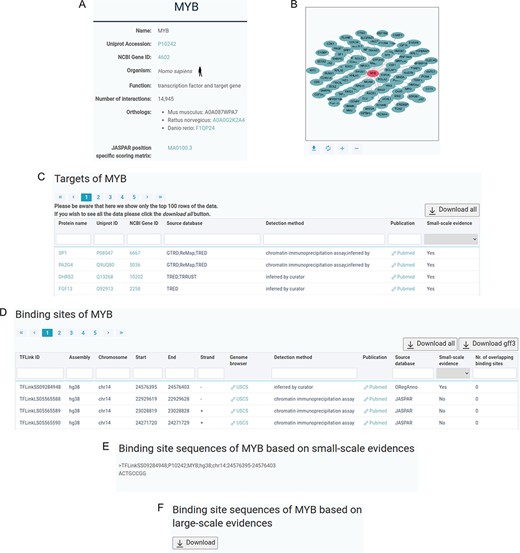
Sample content of a TFLink entry page. (A) Basic information about the transcription factor or target gene. (B) Visualization of the interaction network of the transcription factor (red) and its target genes (green). (C) Table containing information about the target genes. (D) Table containing genomic location of the binding sites. (E) Transcription factor binding site sequences in FASTA format, based on small-scale evidences. (F) Downloadable FASTA file containing transcription factor binding site sequences based on large-scale evidences.
Below the basic information section, the user may visualize three layers of information (if available) about the selected transcription factor: (i) target genes of the transcription factor (Figure 2C) and/or (ii) transcription factors for the target gene and (iii) binding sites of the transcription factor. In the target gene and transcription factor tables, the user finds details on gene names (linked to corresponding TFLink entries), UniProt IDs (linked to corresponding UniProt protein pages), NCBI Gene IDs (linked to corresponding NCBI Gene sites), name of the source database(s), method(s) of detection, cross-links to the original publications (when available) and to the publications of the databases at NCBI PubMed (29), and indications of the evidence type (small- or large-scale experiments). Along with these tables, interactive network visualizations are presented, demonstrating the interactions between the transcription factor(s) and target gene(s) (indicated by green and red colours, respectively; Figure 2B) to facilitate the visual inspection of the interactions.
Besides the TFLink ID, the name of the source database(s), the method(s) of detection, the link to the original publications and the indication to clarify whether the evidence is based on a small- or a large-scale experiment, the binding site table also presents information about the genomic location: genome assembly version, chromosome, the coordinates of the start and end points of transcription factor binding sites and the number of overlapping binding sites for the particular transcription factor (Figure 2D). To make the visual exploration of the genomic context easier, each binding site is linked to its particular genomic location at the UCSC genome browser website (30).
In case there are >100 interactions or binding sites available for a particular entry in the TFLink gateway, we only show the first 100 targets/transcription factors/binding sites in the tables on the website, and make the full information available in the form of downloadable table (and in case of binding sites: GFF3 annotation) files.
The sequences of binding sites based on small-scale evidence are shown below the tables in FASTA format. The header of the sequences contains the TFLink and the UniProt IDs, gene name, genome assembly version, chromosome name and the start and end point coordinates of the binding sites (Figure 2E). Some data downloaded from the JASPAR database refer to binding sequences without exact localization, for example, in cases when random sequences were investigated with SELEX. The binding sequences revealed by large-scale experiments are available from the entry pages as downloadable FASTA files (Figure 2F).
The ‘Download’ page
After selecting the organism of interest, the user can download transcription factor–target gene interaction files in various formats, the transcription factor binding site tables and binding site sequence files combined, and also the data based on small- and large-scale experiments separately. The interaction table is a TSV (tab separated value) file that can be opened by any spreadsheet editors as well as by the Cytoscape software (31) and the igraph R package (32) to visualize the interactions. The interaction MITAB files contain transcription factor–target gene interactions in a standardized MITAB 2.8 format (as defined by the Human Proteome Organization—Proteomics Standards Initiative, HUPO-PSI (33)), which can be used as an input to various software tools, including Cytoscape. Interaction GMT (Gene Matrix Transposed) is a tab delimited file format, which describes gene sets (target genes of a transcription factor) in each row, allowing the user to calculate gene set enrichment (by applying e.g. the GSEA software (34)) or to execute overrepresentation analysis (by applying e.g. the MulEA R package, https://github.com/koralgooll/MulEA) to answer questions like ‘which transcription factors regulate the differentially expressed genes in this experiment?’. The information on transcription factor binding sites is available in TSV format and the sequences of binding sites are provided in FASTA file format. We have also created GFF3 (General Feature Format, version 3) annotation files from the binding site tables, which can be opened by various software tools for NGS analysis, e.g. with the IGV genome viewer (35). For a detailed description of these downloadable file formats, please see chapter 3.3 in the Supplementary Notes. Files over the size limit of 100 Mb are compressed by the very effective 7z algorithm.
Summary of the results
On the TFLink website one can search and browse among the species-specific datasets of transcription factors and target genes. Each of these proteins and genes has its own entry page with information about interactions, binding sites, orthologs and hyperlinks to other TFLink pages and external sources: the UniProt, NCBI Gene, PubMed, JASPAR databases and the UCSC genome browser website. Known binding sites are also indicated here and are available for download as FASTA files as well. Furthermore, the interaction network (containing a maximum of 100 nodes) is also visualized on each entry page. Species-specific datasets are downloadable in TSV, MITAB 2.8, GMT, GFF3 and FASTA formats (see chapter 3.3 in the Supplementary Notes for details), allowing direct analysis in widely-used software tools.
TFLink is a FAIR (36) compliant database, since it provides easy access to transcription factor, target gene and binding site data by offering sufficient metadata, user-friendly browsing and file download in standard formats. TFLink is the only source for the data previously available on the HTRIdb. Moreover, TFLink is the only resource with a working graphical interface for data downloaded from the ORegAnno database. Therefore, our gateway facilitates the distribution of plenty of biological data.
Discussion
Here, we have introduced the TFLink database, which uniquely provides comprehensive and highly accurate information on transcription factor–target gene interactions, nucleotide sequences and genomic locations of transcription factor binding sites for human and six eukaryotic model organisms. To establish the TFLink web resource (https://TFlink.net), we have integrated data from 10, mostly unconnected, resources, translated the names and identifiers, created standard downloadable files, visualized the regulation networks and cross-linked several other webpages containing related or supplementary information about the interactions, binding sites, sources or genomic contents.
Comparison with other databases
We have established a gateway, which is considered gap-filling for several reasons: (i) unlike numerous other transcription factor databases (e.g. Cistrome DB (37), DoRothEA (17), hTFtarget (38), HTRIdb (14), REDfly (12), ReMap (19) and 18 others we have investigated during our search for databases worth being integrated into the TFLink, see Supplementary Table), TFLink is a multispecies gateway. Therefore, TFLink facilitates the investigations into the evolutionary changes in transcription factors, their binding sites and target gene repertoire. (ii) Unlike AnimalTFDB (39) and TRANSFAC (40) all data in TFLink are available for download in easily accessible formats, thereby allowing even less experienced users to analyze large amounts of gene regulation data. (iii) While AnimalTFDB, ScerTF (41), YeTFaSCo (42) and Yeastract only provide the consensus sequences or matrices of transcription factor binding sites, TFLink includes the actual binding sequences, thus it allows the user to identify the binding sites in resequenced genomes, compare the binding sites across different transcription factors and design specific experiments to enhance or suppress gene expression. (iv) While AnimalTFDB and PlantTFDB (43) focus more on the sequence and structural properties of the transcription factors themselves, TFLink provides functional information on transcription factors, besides being cross-linked to the corresponding UniProt protein sites.
Limitations and updating plans
We note that the actual version of TFLink has some important limitations: it covers only seven taxa and it only contains data that were already available from other scattered resources. We also note that in some cases TFLink does not contain all the known target genes of a specific transcription factor due to limited availability of small-scale experiments. In contrast, TFLink may overestimate the set of target genes when considering large-scale data due to the presence of false-positives. Combining TFLink data with tissue-specific gene expression measurements from databases, such as Encode (44), GEO (45) or the SRA (46), can ameliorate this issue. Therefore, besides updating TFLink regularly by integrating new data posted in the original resources, in the next few years we plan to collect transcriptional regulation information not only from transcription factor databases, but also from other resources, like research papers and ExTRI text mining transcription regulation database (47).
General applications
TFLink is a useful resource for wet-lab researchers, since it provides easy access to high-quality transcription factor–target gene interaction and transcription factor binding site data, with cross-links to several other databases. TFLink is also a long-awaited resource for bioinformaticians, as it contains large quantities of standardized, downloadable regulatory data in multiple formats. The provided interaction tables can be used as input data for the Cytoscape software or to the igraph package to perform systems and network biology studies. The GMT files are useful for gene set enrichment and overrepresentation analyses. Binding site tables allow the user to investigate the genomic location of binding sites. Users can apply the GFF3 binding site annotation files in various NGS analyses, for example when investigating the mapped RNA-seq reads with IGV genome viewer. The binding site sequences can be applied in binding site predictions, binding site matrix calculations, as well as for investigations of the rate of evolution of transcription factor binding sites. Therefore, TFLink will facilitate benchmarking experiments in several fields of gene regulation research.
Use cases
To facilitate the application of TFLink, we provide some examples on how to use and process the data available at the gateway in form of descriptions, R scripts and unix shell commands:
Here we want to check and visualize the common target genes of two transcription factors. We describe how to find transcription factors that share common target genes. We cluster transcription factors based on their common target genes. We create a transcription factor–target gene interaction graph of the STAT5A and STAT5B transcription factors using the igraph R package. We also show how to create the same transcription factor–target gene interaction graph by using the Cytoscape software (Supplementary Use Cases, TFLink use case 1).
Here we investigate the functional diversity of target genes of a nuclear hormone receptor transcription factor, the unc-55 in human and a nematode species. We perform Gene Ontology overrepresentation analyses of the target genes in the two species in order to identify shared functional roles that likely represent the ancestral function of unc-55. Furthermore, this comparison will yield insights into the potentially divergent roles unc-55 play in these two distant animal groups (Supplementary Use Cases, TFLink use case 2).
Here, we investigate the binding sites of the EGR1 transcription factor. After converting the TFLink binding site table to BED and BAM files, we calculate the ‘coverage’ to reveal the strength of evidence (number of supporting experiments) for each binding site. Then, we plot the binding sites on the human chromosomes, indicating the number of supporting evidences each binding site has. Finally, we investigate specific binding sites using the IGV genome viewer tool (Supplementary Use Cases, TFLink use case 3).
Conclusions
TFLink is a gap-filling, novel, curated, multispecies gateway on eukaryotic transcription regulatory networks and transcription factor binding sites. It provides experimentally determined, highly accurate information collected from scattered third party databases. On the TFLink website (https://tflink.net/) the user can browse and download tables and files containing detailed information on transcription factor–target gene interactions and transcription factor binding sites. All the identifiers, names and files available on the TFLink gateway are provided in a standardized way or format to allow bioinformaticians to process these data easily. Besides being a practical resource for computational biologists, TFLink also targets wet-lab researchers with interactive network visualizations, cross-links to the original publications and to the UniProt database and allows the visual exploration of the genomic content around each binding site via links to the UCSC genome browser. We have established TFLink to facilitate the reuse of high-quality gene expression regulation data in an effective way, to provide an easy to use web interface and downloadable files, as well as to let the researchers launch comparative gene regulation studies.
Supplementary data
Supplementary data are available at Database Online.
Acknowledgements
We are grateful to Tibor Vellai for his valuable comments on the TFLink gateway. We thank Dóra Bokor, PharmD, for proofreading the manuscript.
Funding
This work was supported by the National Research, Development and Innovation Office, Hungary (NKFIH) grant PD [grant number 131839 to E.A.]; an NKFIH KKP [grant number 129814 to B.P.]; GINOP iChamber [grant number 2.3.2-15-2016-00026 to B.P.]; and The European Union’s Horizon 2020 research and innovation programme under grant agreement [grant number 739593 to B.P.]; a Biotechnology and Biological Sciences Research Council (BBSRC) Core Strategic Programme Grant [grant number BB/CSP17270/1 to T.K.]; and a BBSRC ISP grant [grant number BB/R012490/1 to T.K.].
Conflict of interest
None declared.
