


Abstract
DBH2H collects head-to-head (h2h) gene pairs identified from human, mouse, rat, chicken and fugu genomes, and distinguishes the ortholog mapping relationship among them. The gene pairs in DBH2H are annotated with sequential features including single nucleotide polymorphisms, CpG islands and transcription factor binding sites, as well as functional terms and genetic disorders. In addition, the expression correlation information based on 117 microarray datasets is included. By providing user-friendly access to these data, DBH2H represents a valuable resource for further analyses of this important gene arrangement in terms of transcriptional regulation mechanisms, evolutionary conservation, disease relevance, etc.
Database URL:http://lifecenter.sgst.cn/h2h/
Introduction
A ‘Head-to-head’ (h2h) or ‘bidirectional’ gene pair describes a genomic locus in which two adjacent genes are divergently transcribed from opposite strands of DNA, and the region between the two transcription start sites (TSSs) is commonly designated as a putative bidirectional promoter (1,2). Adachi and Lieber (2) reported that the transcription units in most bidirectional loci are within 1000 bp; Trinklein et al. (3) restricted their analysis of h2h pairs to those within 1000 bp of each other. Subsequent studies (4–6) followed this rule to define an h2h pair as two divergently adjacent genes with the TSSs separated by <1000 bp.
After an increasing number of h2h genes had been identified in human, hamster, rat or mouse by individual experiments, a series of computational analyses were performed, reporting that >10% of human genes were organized in this manner and finding bidirectional gene organization to be a common architectural feature of the human genome (2,3). In 2006, we reported a systematic analysis of this gene organization focusing on structural features, chromosomal distribution, evolutionary conservation, expression correlation and functional association among involved genes (4). It was revealed that h2h gene organization is conserved during vertebrate evolution, and it tends to subject functionally related genes to correlated transcriptional regulation. The existence of co-expression, mutually exclusive expression and alternative expression correlation suggested that the underlying mechanisms could be more intricate than previously thought. Since these pioneering computational analyses of h2h pairs, more and more efforts have been devoted to exploring this gene organization in terms of bidirectional promoter characteristics (5), disease association (7) and evolutionary conservation (8,9). It was found that specific cis-motifs were over-represented in bidirectional promoters compared with unidirectional promoters (5), and that the co-regulation of bidirectional genes may involve different h2h pairs (7). Statistical evidence proved that bidirectional promoters were enriched in somatic cancer genes, especially breast cancer genes (7), and methylation of bidirectional promoters was observed in cancerous tissues (10). Other studies were focused on the emergence of h2h organization in genome evolution and its stability over evolutionary time spans (6,9). According to these findings, the h2h, or bidirectional gene organization, seems to have an important biological significance in vertebrate genomes.
Two years after our systematic analysis of this gene organization (4), we updated our data and expanded the analyses, giving rise to the h2h database (DBH2H, http://lifecenter.sgst.cn/h2h/) containing information on sequential features, expression correlations, disease associations and orthologous relationships. By providing user-friendly access to these data, DBH2H represents a valuable resource for further analyses of these important gene arrangements.
Methods
H2h pairs, block sequences and cross-species linkage
The reference assemblies of five genome annotation projects, including human, mouse, rat, chicken and fugu, were downloaded to make the initial gene pools for h2h pair identification. Mitochondrial genomes were ignored in this work because their organization is far more compact than that of the nuclear genome and hence h2h gene pairs therein are not comparable with those in nuclear genomes. A handful of genes, mapped to contigs but not chromosome regions, were also excluded from our analysis. The coordinates of gene ‘starts’, as given in the reference assemblies, were taken as the TSSs of genes. H2h gene pairs, with their TSSs <1000-bp apart, were determined for human, mouse, rat, chicken and fugu.
With the classification of orthologous genes provided by OrthoDB (http://cegg.unige.ch/orthodb) (11), h2h pairs were screened for the orthologous gene pairs that retain h2h gene organization in multiple species. In OrthoDB, an orthologous group comprises a set of best-best-hit proteins (identified with Ensembl protein IDs) out of all-against-all sequence comparisons. Mapping from Ensembl protein IDs to Entrez Gene IDs was carried out with Ensembl BioMart tool (http://www.ensembl.org/biomart/martview).
For human, mouse, rat and chicken, the DNA sequences between 3′-endpoints of each pair of h2h genes—termed a ‘block sequence’—were extracted from reference chromosome sequences (ftp://ftp.ncbi.nih.gov/genomes/).
Annotation of h2h pairs: sequential features, functional roles and disorder relevance
A single nucleotide polymorphism (SNP) is a DNA sequence variation occurring when a single nucleotide in the genome differs between members of a species. We marked our h2h blocks with the reference SNPs deposited in dbSNP (http://www.ncbi.nlm.nih.gov/projects/SNP/).
CpG islands (CGIs) are short stretches of genomic DNA (∼1000 bp) enriched with CpG (∼1 per 10 bp), which provides a gene transcription regulation mechanism via methylation (12). Bidirectional promoters have been found to frequently co-localize with CGIs (2). The genome coordinates of predicted CGIs for human, mouse, rat and chicken (‘seq_cpg_islands.md.gz’ files) were downloaded from the mapview subdirectory of their respective genomes at ftp://ftp.ncbi.nih.gov. The original datasets included both ‘strict’ and ‘relaxed’ CpGs (see http://www.ncbi.nlm.nih.gov/mapview/static/humansearch.html#cpg for more explanation), but as the ‘strict’ was thought to be of higher quality than the ‘relaxed’ (12), only the ‘strict’ CpGs with precise coordinates on the reference chromosomes were mapped to the h2h blocks.
TRANSFAC is a database on transcription factors (TFs) and their genomic binding sites (13). The ‘gene.dat’ file, describing TF target genes in plain text, was parsed to extract the gene names from the Short Description (SD) lines and the Entez Gene IDs from the DR lines. An h2h pair was related to a TF if either gene of the pair matched one of the TF's targets by Entrez Gene ID, official symbols or gene synonyms. Then, the h2h blocks were highlighted with TF binding sites (TFBSs) with which the TF binds were matched. As the original TFBS coordinates were described by the distance relative to the TSS, we transformed the relative coordinates to absolute chromosome coordinates. The transformations are explained in detail at http://lifecenter.sgst.cn/h2h/helpPage.do.
For functional characterization, the h2h genes were annotated using Gene Ontology (GO, http://www.geneontology.org/), KEGG pathways (www.genome.jp/kegg/) and Online Mendelian Inheritance in Man (OMIM, http://www.ncbi.nlm.nih.gov/sites/entrez?db=omim). While OMIM disorders were reported for each gene in an h2h pair independently, GO terms and KEGG pathways were assigned to h2h pairs only when they were shared by both genes. More details on GO annotations are available at http://lifecenter.sgst.cn/h2h/helpPage.do.
Finally, we provided large-scale expression correlation results for h2h pairs. Forty-three GDS datasets profiled with Affymetrix GeneChip Human Genome U133 Plus 2.0 Array and 74 GDS datasets with Affymetrix GeneChip Mouse Genome 430 2.0 Array were obtained from the Gene Expression Omnibus (GEO, http://www.ncbi.nlm.nih.gov/geo/), and used to study the expression correlation of h2h pairs for human and mouse. Both the Pearson correlation coefficients (PCCs) and the Spearman correlation coefficients (SCCs) were calculated [see (4) for methods].
Results
A public resource of h2h pairs and their annotations
H2h pairs were identified in human, mouse, rat, chicken and fugu with the overall statistics shown in Table 1 and the chromosome-wise statistics at http://lifecenter.sgst.cn/h2h/staticsTss.do.
Statistics of h2h gene pairs in DBH2H
| Species | Genomic data version | Gene total | h2h pair total | h2h gene total | h2h gene rate (%) |
|---|---|---|---|---|---|
| Human | NCBI_Build_36.2 | 28 924 | 1447 | 2835 | 9.80 |
| Mouse | NCBI_Build_37.1 | 32 496 | 1431 | 2764 | 8.51 |
| Rat | RGSC_v3.4 | 26 936 | 931 | 1856 | 6.89 |
| Chicken | NCBI_Build_2.1 | 15 876 | 1046 | 2083 | 13.12 |
| Fugu | FUGU 4.0 | 22 421 | 403 | 800 | – |
Of all 5258 h2h gene pairs from five species, 1002 were conserved across at least two species, mapping to 379 orthologous pairs. The numbers of orthologous pairs conserved across two, three, four and five species were 207, 109, 54 and 9, respectively (Supplementary Material 1).
For human, mouse, rat and chicken, h2h pairs were associated with sequential features, including SNPs, CGIs and TFBSs. GO and KEGG terms were linked to mammalian h2h pairs, and OMIM genetic disorders were linked to human ones. In addition, expression correlation analyses were performed for human and mouse h2h pairs. A brief summary of these annotations is shown in Table 2. More detailed summaries with respect to each different annotation are included in Supplementary Material 2.
Statistics of annotations of h2h gene pairs in DBH2H
| Species | Ortholog pairs | SNPs | TFBSs | CGIs | OMIM gene disease | GO terms | KEGG pathways | Microarray datasets |
|---|---|---|---|---|---|---|---|---|
| Human | 262 | 429 483 | 172 | 1863 | 241 | 1495 | 12 | 43 |
| Mouse | 275 | 511 486 | 70 | 1330 | 0 | 1464 | 12 | 74 |
| Rat | 219 | 1926 | 15 | 914 | 0 | 316 | 6 | 0 |
| Chicken | 186 | 141 749 | 0 | 1399 | 0 | 0 | 0 | 0 |
| Fugu | 60 | 0 | 0 | 0 | 0 | 0 | 0 | 0 |
Implemented using an oracle relational database and JavaEE technology, the online database of h2h pairs (DBH2H, http://lifecenter.sgst.cn/h2h/) provides a simple way to access the h2h pairs and their annotations.
First, DBH2H provides overviews of h2h pairs in various perspectives. Statistics in summary tables (http://lifecenter.sgst.cn/h2h/staticsTss.do) are hyper-linked to groups of h2h pairs, such as those located on a chromosome, or implicated in a particular biological process. Specifically, the histograms of human, mouse and rat h2h pairs are aligned side-by-side in a clickable plot (Figure 1), allowing a rapid comparison of the distribution patterns of the three species.
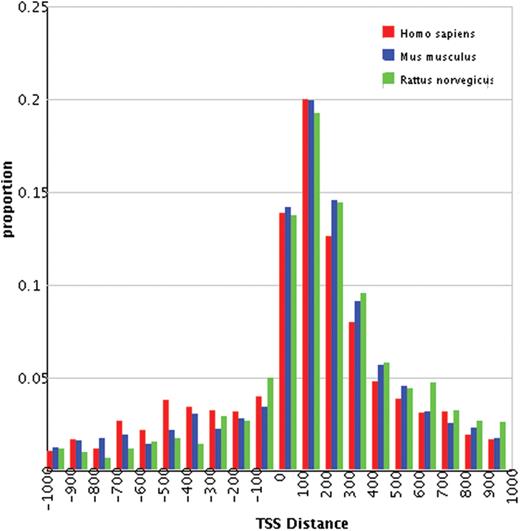
Distributions of distances between TSSs of h2h pairs.
Secondly, DBH2H provides combinatorial searches for particular h2h pairs. Once key words on h2h pairs (gene symbols, species, chromosomes, etc.) or their annotations (the regulating TFs and the associated disorders) are filled in (Figure 2), a list of matched h2h pairs will be shown. On the page detailing annotations for each h2h pair, pair identity, sequential features (TFBSs, CGIs and SNPs), OMIM associations, functional annotations (from GO and KEGG) and expression correlation information are reported in detail (Figure 3). Sequential features are marked proportionally in a linear picture of the block sequence, so as to present a global view of the h2h genomic region; the positive and negative expression correlation values are represented as proportional red and green colour shades, respectively, with dataset IDs linked back to the GEO database (Figure 3).
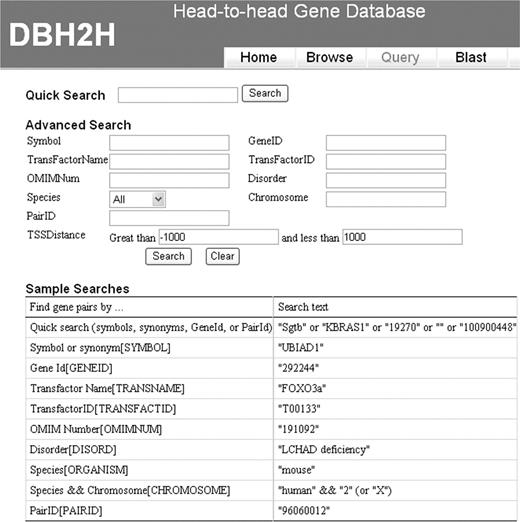
Combinatorial keyword search for particular h2h pairs.
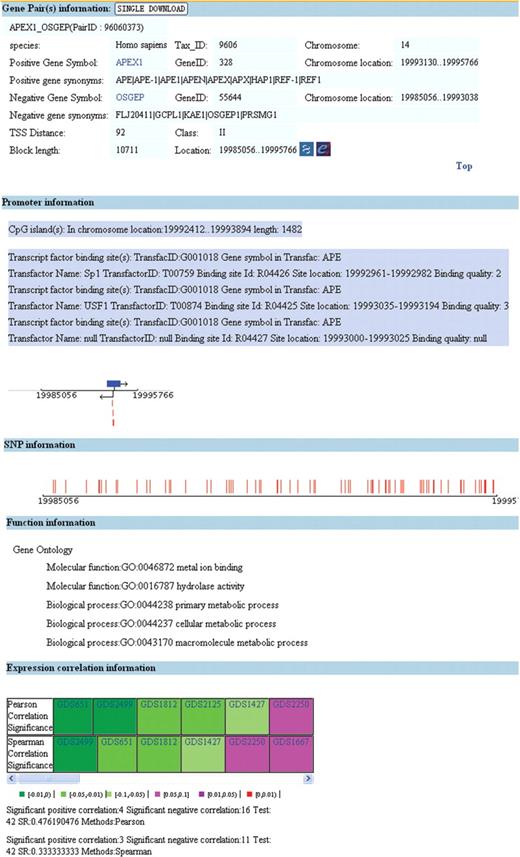
Annotations of an h2h pair.
Lastly, DBH2H maintains a BLAST service against the h2h block sequences and offers a bulk data download option (ftp://down:lsbi@lifecenter.sgst.cn:2121/h2h/h2h.zip). These two facilities increase the usefulness of DBH2H for computational biologists, who may conduct in silico analyses of h2h pairs with our data.
Further in silico analyses of h2h pairs
Our previous research reported 1262 human h2h pairs based on NCBI Build 35.1 of the human genome assembly (4). In this study, we re-performed the identification workflow with Build 36.2, and retrieved 1447 pairs. Out of the total 1447 pairs, 830 (57.4%) were found in the old list, 101 (7.0%) had one gene of the pair replaced and 516 (35.7%) were brand new (Supplementary Material 3). Similarly, h2h pairs were re-identified in mouse, rat, chicken and fugu. Compared with our previous report, the proportions of h2h genes increased exclusively in the three mammals. Remarkably, the number of rat h2h pairs almost doubled (from 491 to 931) due to a significant accumulation of rat sequence data. Despite the massive updates of h2h pairs, the distributions of TSS distances had a pattern essentially identical to that described earlier (4). A significant accumulation of rat sequence data squeezed the TSS distance distribution to a sharpened peak in the 1- to 400-bp region (Figure 1), consistent with our prediction (4).
Although the discrepancy between the two batches of h2h pairs is mostly attributed to updates of gene coordinates, 28 new human h2h pairs involving 27 microRNA genes came to light as a consequence of the extensive attention this new type of regulatory genes has received. The majority of these microRNA genes (22 of 27) formed independent h2h pairs with their divergent partners, while the other five microRNAs were embedded in 5′-UTRs of larger genes sharing partners with them. For more information on these 28 microRNA-related h2h pairs, see Supplementary Material 4.
To investigate the expression correlation of h2h pairs in different microarray datasets, we calculated PCCs and SCCs, which measure linear and rank correlations, respectively. Each PCC or SCC underwent a corresponding significance test and was deemed as statistically significant if the P-value was <0.05. Hence we obtained three statistics for each gene pair: the number of GDS datasets marked with positive correlation (SP), the number of GDS datasets with negative correlation (SN) and the number of GDS datasets where correlation was tested (Tested). We believe that both positive correlation and negative correlation of an h2h gene pair imply biological significance, so we used the statistic Significance Ratio SR = (SP + SN)/Tested to rank h2h gene pairs. We found that the top-scoring h2h gene pairs in both human and mouse had SRs > 90%, suggesting that these pairs are always correlated in transcription. Around a half of the surveyed pairs had their SRs >50%, suggesting these pairs were transcriptionally correlated in many cellular contexts. Finally, we found 80 (human) or 79 (mouse) pairs appearing in both the top-100 PCC and top-100 SCC scores, indicating that PCC and SCC agreed on a simlar set of highly correlated h2h gene pairs. All correlation-related results can be downloaded from DBH2H (ftp://down:lsbi@lifecenter.sgst.cn:2121/h2h/h2h.zip).
Preliminary exploration of the DBH2H data has revealed sets of h2h pairs worthy of attention, such as those involving microRNAs and those that seem to consistently display expression correlation. Additionally, we found that conserved h2h pairs seem to be stable despite data update, since 41 of the 42 human h2h pairs conserved in chicken and fugu in the previous report [see Supplementary Material of (4)] were retained in the current list. An in-depth analysis of these stable, conserved h2h pairs is in process.
Discussion
The h2h gene pair driven by a bidirectional promoter is a unique structural motif in eukaryotic genomes, whose universality has been revealed by recent technological innovations (14). With the advancement of our understanding of eukaryotic genomes, lists of h2h pairs in model organisms need to be updated correspondingly, calling for a professionally constructed database with continual and flexible updates. In this work, we describe the initial efforts to collect h2h pairs and their annotations for five vertebrate genomes, and have provided access to these data with a user-friendly interface. As the genes in h2h pairs are all selected from NCBI Entrez entries, DBH2H data are seamlessly integrated with the abundant sequence level and function level information in the NCBI databases, and will be regularly updated. Complete version information is also stored to support traceability back to the original source data.
The versatile annotations of h2h pairs in DBH2H could be integrated to support related studies on potential mechanisms underlying this intriguing gene organization. For example, Yang et al.'s (7) expression analyses of human ovarian cancer genes and h2h genes could be easily extended to other mammalian genomes in search of consensus combinations of TFBSs. Additionally, the expression correlation values of h2h pairs calculated across more than 100 microarray datasets enable a second-order correlation analysis of h2h pairs (15), through which we may get closer to deciphering the transcription regulation mechanism of h2h organization.
Funding
National ‘973’ Basic Research Programs (2006CB0D1203, 2006CB0D1205); National Key Technologies R&D Programs (2007AA02Z331, 2006AA02Z330); National Natural Science Foundation of China (30770497); and Shanghai R&D Public Service Platform of Shanghai Municipal Science and Technology Commission (07DZ22901).
Conflict of interest. None declared.
ACKNOWLEDGEMENTS
We would like to thank Dr Alex Michie for editorial help; Dr Kang Tu and Dr Zhi-Qiang Ye for technical assistance; Yun Li and Ling-Yi Lu for data preparation; and Dr Guohui Ding for critical comments.
