


Abstract
Prion diseases reflect conformational conversion of benign isoforms of prion protein (PrPC) to malignant PrPSc isoforms. Networks perturbed by PrPSc accumulation and their ties to pathological events are poorly understood. Time-course transcriptomic and phenotypic data in animal models are critical for understanding prion-perturbed networks in systems biology studies. Here, we present the Prion Disease Database (PDDB), the most comprehensive data resource on mouse prion diseases to date. The PDDB contains: (i) time-course mRNA measurements spanning the interval from prion inoculation through appearance of clinical signs in eight mouse strain-prion strain combinations and (ii) histoblots showing temporal PrPSc accumulation patterns in brains from each mouse–prion combination. To facilitate prion research, the PDDB also provides a suite of analytical tools for reconstructing dynamic networks via integration of temporal mRNA and interaction data and for analyzing these networks to generate hypotheses.
Database URL:http://prion.systemsbiology.net
Introduction
With advances in high-throughput measurement technologies, huge amounts of global datasets have been generated to study various human complex diseases. By analyzing these global datasets, systems biology approaches are being attempted to gain new insights into the pathophysiology of human diseases (1–3). Among the complex diseases, prion diseases, which are fatal neurodegenerative disorders found in humans and animals, are experimentally tractable diseases with the availability of animal models (inbred, transgenic and congenic mice), and thus they can be studied effectively using systems biology approaches. Prion diseases are caused by prions composed of misfolded isoforms of the prion protein and characterized by the following neuropathophysiological features: (i) PrP replication and accumulation, (ii) microglial and astrocyte activation, (iii) synaptic degeneration and (iv) neuronal cell death (4,5). Prion pathology and the incubation times (the interval between infection and disease) are varying in different mouse strains (Table 1). In addition to genetic influences on incubation time, there are distinct strains of prions that determine disease duration, distribution of lesions in the brain, and clinical signs. These strain differences reflect structural differences in PrPSc isoforms. To unravel the fundamental mechanisms underlying these complex behaviors in prion diseases, there has been a need for a wide spectrum of global datasets obtained from various mouse strains infected by multiple prion strains.
Eight mouse strain-prion strain combinations
| Mouse-prion strain combination | Mouse strain | Prion strain | Mouse Prnp genotype | Time point (week) | Incubation time (days/weeks) |
|---|---|---|---|---|---|
| 1 | C57BL/6J (B6) | RML | a/a | 2, 4, 6, 8, 10, 12, 14, 16, 18, 20, 22 and 23 | 161/23 |
| 2 | C57BL/6J (B6) | 301V | a/a | 6, 8, 12, 16, 20, 24, 28, 32, 36 and 41 | 287/41 |
| 3 | C57BL/6.I-1 (B6.I) | RML | b/b | 4, 8, 12, 16, 20, 24, 28, 32, 36 and 48 | 336/48 |
| 4 | C57BL/6.I-1 (B6.I) | 301V | b/b | 2, 4, 6, 8, 10, 12, 14, 16 and 18 | 126/18 |
| 5 | FVB/NCr (FVB) | RML | a/a | 2, 4, 6, 8, 10, 12, 14, 16, 18, 20 and 22 | 154/22 |
| 6 | Tg(MoPrP-A)B4053 (Tg4053) | RML | >30a | 1, 2, 3, 4, 5, 6, 7 and 8 | 56/8 |
| 7 | (FVB x FVB.129-Prnptm1Zrch) F1 (Prnp0/+) | RML | a/0 | 4, 8, 12, 16, 20, 24, 28, 32, 36, 40, 46, 48, 52 and 56 | 392/56 |
| 8 | FVB.129-Prnptm1Zrch (Prnp0/0) | RML | 0/0 | 4, 8, 12, 16, 20, 24, 28 and 51 | 357/51 |
The eight mouse–prion strain combinations comprise several mouse strains with two known Prnp alleles (a and b) infected by two prion strains (RML strain derived from a sheep with scrapie, and 301V strain originated in cattle). The incubation time is defined as the interval from prion inoculation to the end point in our experiments. With the exception of 0/0 mice, all animals at the end points were at the terminal stages of disease when euthanized for brain harvest. For each combination, a set of mice was inoculated with brain homogenate from normal mice and brains harvested at the same time points as prion-infected mice. Brains from three mice were taken at each time point.
Although several microarray studies have been performed using different mouse models (6–8), the datasets from these independent studies have been limited in their information contents (i.e. lack of a broad range of incubation times, a few mouse and prion strains, different array platforms, etc.) and also have not been systematically normalized and stored in a database for effective comparative and integrative analyses across datasets from different studies. Also, these studies have been limited to identifying genes and cellular processes perturbed by prion disease and have not exploited these findings to reconstruct dynamical biological networks representing temporal activation of these processes and their interactions. To resolve these problems, we have recently applied a systems approach to prion diseases (9), which involved: (i) generation of a comprehensive time-course gene expression dataset as well as temporal histoblots representing PrPSc accumulation across brains in eight mouse–prion strain combinations; (ii) an integrated collection of multiple layers of data including protein interactions for network reconstruction, GO annotations, KEGG/Biocarta pathways, and tissue specificity information; and (iii) integration of a suite of systems biology tools for reconstructing dynamic networks that describe fundamental processes perturbed during the course of prion disease and their interactions.
Here, we present the Prion Disease Database (PDDB), the most comprehensive data resource on mouse prion diseases to date, which contains both the data generated in our previous study (9) and provides an array of systems biology tools we used during the analysis. The availability of primary experimental data from a comprehensive study is the key attribute that distinguishes the PDDB from other neurodegenerative disease databases such as AlzGene (10) for Alzheimer's Disease, HDBase (11) for Huntington's Disease and PDGene (12) for Parkinson's Disease, which focus on meta analysis of published manuscripts and data sets to identify candidate disease genes.
The PDDB is a web-based resource for research in prion disease and also for potential use in research on other complex human diseases. It contains time-course data from over 450 microarrays and histoblots showing temporal PrPSc accumulation patterns in brains from eight mouse–prion strain combinations, as well as basic data exploration tools and systems biology tools. The key tools integrated into the PDDB are: (i) a search function coupled with two visualization tools (heatmap and profile viewers) enabling efficient exploration of temporal gene expression patterns for sets of genes (e.g. a set of differentially expressed genes); (ii) tools for network analyses linking the sets of genes to protein interactions via Cytoscape and its plugins and statistical and other systems biology tools supporting the Gaggle interface (13); (iii) web-interfaces linking the genes of interest to comprehensive annotations such as NCBI gene page information and KEGG pathways as well as tissue specificity information; and (iv) a function to construct and store user-defined sets of genes, allowing the users of the PDDB to employ the tools and data of the PDDB for their own research questions. Collectively, the temporal gene expression and histoblot data and the suite of tools support diverse types of studies: from simple studies inferring gene expression levels for a particular set of genes to comprehensive systems biology studies involving integration of data from the PDDB with new data and network analysis of the integrated data.
Database
Database and website infrastructure
We based the PDDB on the GDxBase system developed for the T1DBase (14), which comprises a relational database management system (RDBMS) for data storage and integration with external data sources as well as a web-based user interface for data exploration and visualization. The GDxBase system also provides support to integrate external data analysis tools. The database back-end consists of several MySQL databases that are queried through the Perl-driven web front-end that dynamically generates HTML pages. Histoblots and protein-interaction networks are located in the file system of the webserver, whereas expression data is stored in one of the MySQL databases. Both public and private, i.e. user-specific, gene sets are stored in the database back-end as well and can be used to query the PDDB for a predefined collection of genes. Data are loaded into the database by administrators through a collection of tools implemented in Perl. Affymetrix probe identifiers of all probes on the microarray type used in our project have been integrated with data from external data sources such as Ensembl, dbSNP and NCBI Entrez. The corresponding data is stored in the database back-end and can be retrieved at the gene level.
Although most of the features of the PDDB are based on the GDxBase framework, we have modified and adapted some aspects of the functionality of the framework to meet the requirements of the PDDB. To improve the response time of the database when gene expression profiles are searched for, we have optimized the database schema for this type of query. As visualization of gene expression profiles is one of our main concerns, we have implemented our own version of the heatmap and profile plot visualizations. We added the possibility to view expression data on either the gene- or the probe-level as an additional feature. The PDDB also provides interfaces to the Gaggle environment (13) through the Firegoose Firefox browser extension (15). Both lists of identifiers and expression data can be exchanged directly with tools and other resources that support the Gaggle environment. Export of data is facilitated through provision of the data in the Gaggle microformat on search results pages. Import of identifier lists is possible through a specialized website handler that is used by the Firegoose to send data to the PDDB.
Additional gene expression data sets can be loaded into the PDDB if probe annotation for the corresponding microarray platform is available. Beyond gene expression data the database framework and interface of the GDxBase can handle other data types as well. For instance, integration of protein expression levels under different conditions into the database is straightforward as long as annotation for the measured proteins is provided. Relevant quality and statistical measures on the expression profile level can be deposited as well and retrieved through the web interface.
Transcriptomic profiling and data analysis
We selected eight mouse–prion strain combinations with two genetic backgrounds [C57BL/6J (B6) and FVB/NCr (FVB)] and two alleles of Prnp [Prnpa (B6 and FVB), Prnpb (B6.I)] in mouse as well as two prion strains (RML and 301V; Table 1). The mice were inoculated intracerebrally with brain homogenate from clinically ill mice with prion strain for diseased samples. A description of the methods used to generate the experimental data is available in our recent paper (9). For time-course gene expression profiling, we have used the Affymetrix Mouse Genome Chip 430 2.0 Array platform to measure mRNA abundance changes in the brains of mice from the eight mouse–prion strain combinations. Measurements were taken at 8–14 time points where the harvest interval and the frequency of measurements were dependent on incubation time as indicated in Table 1. The log2-transformed time-series data of each prion–host combination were normalized using gcRMA normalization available in BioConductor (http://www.bioconductor.org). A Monte Carlo simulation-based parametric statistical testing method was then applied to determine whether the gene is differentially expressed in a consistent pattern over time (9). All log2-transformed expression levels, P-values, additional measures resulting from the aforementioned statistical test as well as quality control flags (present/absent calls) are stored in the database and can be retrieved through queries for the associated genes. Overall the database contains roughly 20 million data points for a total of about 45 000 probes, measured in triplicate under approximately 180 different conditions.
Generation of histoblots showing PrPSc accumulation
The brain histoblot images contained in the PDDB were brain slices transferred to nitrocellulose, PK-digested and stained with human Fab D18 anti-PrP to display brain-regional distribution of PrPSc during the progress of the prion disease (9). PK resistance is a widely used surrogate marker for detecting PrPSc. Both time-series and end-point histoblots of coronal and sagittal brain sections are presented for the prion–host combinations. All time-series histoblots are coronal sections with the exception of FVB-Tg(PrP-A)B4053. The earliest time point presented in each case is the last one that was indistinguishable from a control, uninfected brain section processed at the same time. While all prion inoculations were done in the right hemisphere targeting the thalamus, we have brain sections created from both the left and the right hemisphere during the course of disease progression. End-point histoblots are available for sagittal sections taken from the mid-line brain moving out laterally from several regions for each prion–host combination in high resolution. The histoblots are available as either JPEG or PNG images.
Construction and maintenance of gene sets
Regular users of the PDDB have the option to create a user account to get access to the ‘My PDDB’ feature. This feature enables the creation of sets of genes that can be used for instance to search the expression data or to generate a hypothetical protein interaction network for exploration in Cytoscape. Through the My PDDB interface the user may examine and edit user-defined and the public pre-defined lists. This feature is useful to store the results of analyses such as we have done for example with the top differentially expressed genes in our study. Alternatively, genes involved in a certain pathway or biological process can be stored as a set as well as collections of genes that are the result of an analysis performed by the user. While our sets of top differentially expressed genes are publicly available the sets created by users are private but can be made public if desired. In future sessions the user will then be able to quickly retrieve previously created sets of genes and corresponding expression profiles or interaction networks. This contributes greatly to more efficient data exploration and analysis with the PDDB.
Software
Overview of the web interface of the PDDB
The goal of the PDDB is to provide not only fundamental dynamic molecular and histological data, but also data exploration tools for generation of network-driven hypotheses in systems biology research on prion diseases. The web interface of the PDDB provides several entry points to the data contained in the database (see the menu bar indicated by the arrow in Figure 1). In the ‘Search’ submenu, the menu item ‘Microarray Data’ provides access to advanced search interfaces for gene expression patterns across the whole collection of time-course microarray data (Table 1). To facilitate the search, the PDDB also provides ‘Connect the Dots’, a GDxBase tool (14) that can convert one type of gene or protein identifier into another to be used for the search (see an example in Supplementary Figure 1).
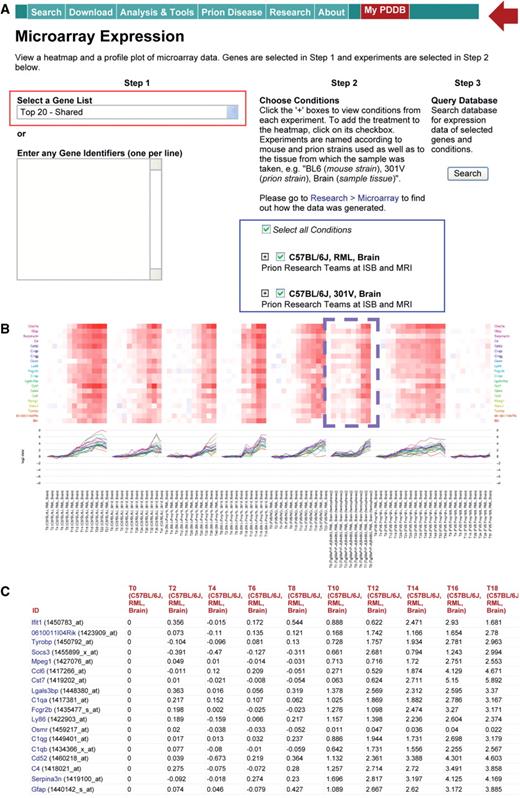
Exploration of temporal gene expression profiles. (A) Gene expression search comprising (i) selection of a predefined set of genes (top 20 shared DEGs) or entering of a set of the genes to be explored and (ii) selection of a set of mouse–prion strain combinations to be searched. (B) Heatmaps and profile plots showing temporal gene expression patterns of the top 20 shared DEGs in all mouse–prion strain combinations. (C) Log2 fold changes of the top 20 shared DEGs in the combinations (only the fold changes in BL6-RML are shown).
The ‘Download’ submenu provides access to raw gene expression data files (Affymetrix CEL files; Supplementary Figure 2). The ‘Analysis & Tools’ section gives an overview of several computational and network analysis tools that can be employed to investigate functional roles of a set of genes using biological networks. The tools are categorized as follows (Supplementary Figure 3): (i) Network Analysis-Cytoscape (16) and BioTapestry (17) to analyze protein and gene regulatory networks, respectively; (ii) Pathway Analysis- DAVID (18) for pathway enrichment analysis and KEGG for pathway exploration; (iii) Visualization and Statistical Analysis- Mayday (19) and Prequips (20) to visualize and analyze gene expression and proteomics data, respectively; and (iv) Transcription Factor Analysis- MotifMogul [http://xerad.systems-biology.net/MotifMogulServer (21)] for in silico gene regulatory network analysis. Also, a brief overview of the history, background and pathology of prion disease as well as mouse brain histoblots are provided in the ‘Prion Disease’ section (Supplementary Figure 4). The ‘Research’ section contains additional details on our systems biology approach to prion diseases (Supplementary Figure 5). The ‘My PDDB’ section allows users to create an account where they can store their own sets of genes and use them to explore the data in the PDDB more efficiently (Supplementary Figure 6).
Search and visualization of temporal gene expression patterns for data exploration
As the most comprehensive data resource on prion diseases, the PDDB contains mRNA expression datasets generated from the following eight mouse–prion strain combinations involving two prion strains and six lines of mice that exhibited different prion disease phenotypes: (i) five mouse strains infected with two prion strains of RML and 301V-BL6-RML, BL6.I-RML, BL6-301V, BL6.I-301V and FVB-RML; and (ii) three FVB transgenic mouse strains infected with RML-Tg4053-RML, FVB(0/+)-RML and FVB(0/0)-RML (see Table 1 for further details). To effectively explore temporal gene expression patterns for a particular set of genes in such datasets, the PDDB provides a search function coupled with two visualization tools—heatmaps and profile plots. Performing a search involves the following steps (Figure 1): (i) first enter a list of genes into the ‘Enter Any Gene Identifiers’ section using gene symbols or Entrez IDs or selection of a predefined set of genes: for example, the top 20 differentially expressed genes (DEGs) shared in the five aforementioned mouse–prion strain combinations (see the red box in the ‘Step 1’ panel of Figure 1A) and (ii) select a set of mouse–prion strain combinations from which expression data are to be retrieved (see the ‘Step 2’ panel in Figure 1A and Supplementary Figure 7A). Figure 1B shows the retrieved expression patterns for the top 20 shared DEGs both as heatmap and profile plot (see also Supplementary Figure 7B). The expression pattern shows that the expression changes were similar across all strain combinations and highly correlated within each combination. However, the time point at which the expression levels of the shared genes began to increase is different in each combination—the genes in the mouse–prion combinations (BL6-RML, BL6.I-301V and FVB-RML) with short incubation times were changed earlier than those in the combinations with long incubation times (BL6-301V and BL6.I-RML). One can reconstruct a dynamic network for the shared DEGs to predict biological relevance of such differences in prion pathogenesis.
For genes represented by multiple probesets on the microarray the PDDB provides three different options to display its temporal expression levels in the heatmap and profile plot (see the blue box in Supplementary Figure 7B): (i) an averaged expression profile of all probesets of the gene (‘Average Probeset’ mode), (ii) an expression profile of the probeset with the lowest P-value (‘Top P-value Probeset’ mode), or (iii) the expression profiles of all probesets (‘All Probesets’ mode). The user can also review the search results in tabular form. Figure 1C shows two tables, one with the temporal fold changes (Supplementary Figure 7C) and the other with the statistical measures (Supplementary Figure 7D) computed by the method used determine the DEGs (9). The fold changes and P-values can be downloaded by clicking the links to tab-delimited text files for further analysis in external tools (see the red box in Supplementary Figure 7C).
Network reconstruction and exploration tools
The PDDB provides access to tools for reconstruction and exploration of hypothetical networks describing essential cellular processes implicated in prion diseases, leading to generation of network-driven hypotheses about fundamental principles of prion pathogenesis. The PDDB provides access to two tools for network analysis; Cytoscape and BioTapestry (see ‘Network Analysis’ in the green box of Figure 2A). Note that network modeling using BioTapestry is possible through the Gaggle while network analysis using Cytoscape is possible within the PDDB and also via the Gaggle (see below). For network analysis using Cytoscape within the PDDB, we first select a set of genes (e.g. top 20 shared DEGs), choose ‘Start with: Your own list of Human Entrez Gene IDs’ option (see the blue box in Figure 2A), and enter Entrez IDs of these selected genes. Then, a subnetwork for these genes can be reconstructed using protein interactions queried from several databases such as BIND and HPRD by clicking the ‘Start’ button. Users can specify which interaction databases are to be used and choose a network depth, e.g. ‘1’ for the first neighbors of the genes (Supplementary Figure 8).
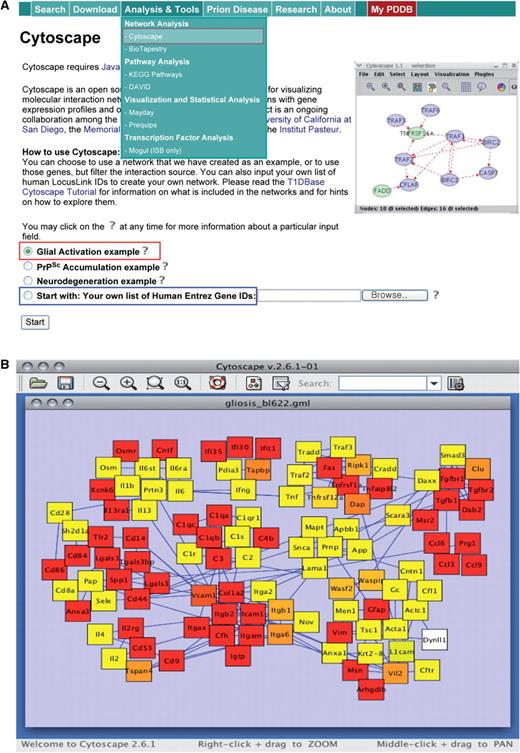
Reconstruction and exploration of hypothetical networks. (A) Network reconstruction involving either selection of a predefined network from our study or entering a set of genes for which a network can be built. (B) A glial activation network describing diverse immune responses to prion accumulation (see the text for further details). This example network can serve as a platform network to build more comprehensive networks by expanding particular network modules to include relevant cellular processes.
Instead of reconstructing a hypothetical network for a user-defined set of genes, the PDDB also provides three predefined networks closely related to prion pathogenesis: (i) Glial Activation (see the red box in Figure 2A), (ii) PrPSc Accumulation and (iii) Neurodegeneration networks. Figure 2B shows the ‘Glial Activation’ network describing immune responses to PrPSc accumulation, including complement activation, cytokines/chemokines, and cell adhesion molecules. These predefined networks can serve as platform networks that can be expanded further into more comprehensive networks using Cytoscape plugins [cPath and MiMI (22,23)]. Using these Cytoscape plugins, the PDDB allows us to perform various types of network exploration (Supplementary Figure 9): for a hypothetical network reconstructed using a set of genes, (i) GO enrichment analysis for all network nodes using BiNGO (24), (ii) clustering of network nodes using MCODE (15) to identify network modules, (iii) identification of active network modules using jActiveModules (25) and (iv) expansion of an existing network using MiMI.
Statistical and systems biology analysis using external tools integrated into the PDDB via the Gaggle
The integration of the PDDB into the Gaggle environment allows the users to directly exchange data between a wide range of systems biology applications. The Gaggle makes exploration of complex, heterogeneous data sets more efficient and enables the user to analyze the data within the PDDB with external analysis tools without any administrative overhead such as reformatting of data files. Figure 3 illustrates an exemplary workflow of how we can use the external tools in the PDDB through the Gaggle. An interaction network is created within the PDDB and loaded into Cytoscape through Java Webstart (Figure 3A). The gene symbols of all nodes in the network are then sent back to the PDDB through the CyGoose plugin (Figure 3B). The PDDB receives the list of gene symbols from the Firegoose and automatically populates the query form in the Microarray Expression page (Figure 3C). The query results page provides heatmaps and profile plots of the retrieved expression matrices (Figure 3D). The results are then broadcast to Cytoscape where the expression levels are used to color the network nodes (Figure 3E). This allows the user to identify co-expressed, interacting proteins, e.g. by looking for clusters of nodes that have the same color or through analysis of the network with a Cytoscape plugin. At the same time the expression data can be sent to TIGR MeV (26), where clustering is performed to find genes that are co-expressed over all conditions in the expression matrix (Figure 3F). At this point the user could send identifiers from a particular cluster back to the PDDB to query their expression levels under further conditions and then broadcast those to Cytoscape to visualize this data on the interaction network.
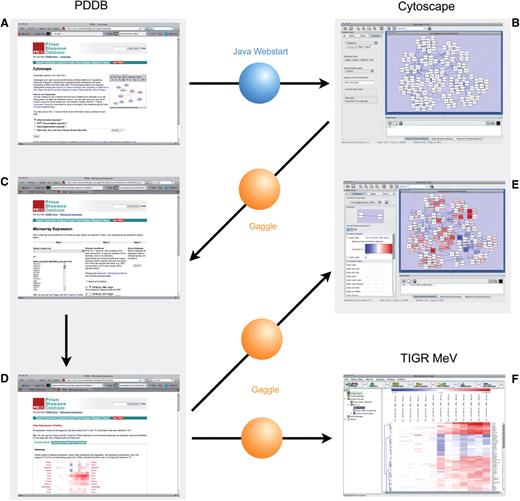
Exchange of data between the PDDB and external tools through the Gaggle. (A) Network reconstruction within the PDDB. (B) Loading the network into Cytoscape through Java Webstart. (C) Broadcasting the gene symbols corresponding to the network nodes back to the PDDB through the CyGoose. (D) Querying the PDDB for the list of gene symbols from CyGoose in the Microarray Expression page. (E) The retrieved expression matrices can be broadcast back to Cytoscape through the Firegoose and be used to provide node colors using VizMapper. (F) The expression matrices can be also broadcast to other tools such as the TIGR MeV for further analyses (e.g. clustering). See the text for further details.
Integration of heterogeneous types of data to support network exploration
Mapping dynamic changes of expression levels of genes belonging to key network modules into those of PrPSc accumulation is critical in evaluating their relevance to and also predicting their functional roles in prion pathogenesis. To assist in the mapping of dynamic changes in transcriptional patterns and PrPSc accumulation, the PDDB provides time-course histoblots representing PrPSc accumulation in all mouse–prion strain combinations (Table 2). Figure 4 shows an example set of histoblots obtained from left and right hemispheres of Tg4053 mice infected with RML at every week from 4 to 9 weeks during disease progression. PrPSc accumulation became first apparent after 49 days post-inoculation when the expression levels of the top 20 shared DEGs began to increase in Tg4053-RML (see the consistent dynamics between the gene expression changes shown in the dotted box in Figure 1B and the histoblots in Figure 4). This suggests that these genes might play key roles in cellular events (e.g. prion replication) occurring during the early phase of prion infection.
Time-course histoblots representing accumulation of proteinase K-resistant PrPSc in brains infected by prions
| Mouse-prion strain combinations (mouse strain–prion strain) | Histoblots, Sagittal (day post-inoculation) | Histoblots, Coronal (day post-inoculation) |
|---|---|---|
| C57BL/6J (B6)—RML | 154 | Control, 42, 67, 82, 98, 110, 128, 138 and 154 |
| C57BL/6J (B6)—301V | 252 | Control, 111, 138, 167, 196 and 224 |
| C57BL/6.I-1 (B6.I)—RML | 365 | Control, 170, 195, 224, 252, 335 and 365 |
| C57BL/6.I-1 (B6.I)—301V | 126 | Control, 55, 70, 83, 98, 111 and 126 |
| FVB/NCr (FVB)—RML | 154 | Control, 41, 56, 69, 84, 98, 112, 126 and 142 |
| Tg(MoPrP-A)B4053 (Tg4053)—RML | Control, 28, 35, 42, 49, 57, 60, 63 | |
| (FVB x FVB.129-Prnptm1Zrch)F1 (Prnp0/+)—RML | Control, 168, 279, 389 | Control, 54, 85, 111, 168, 195, 223, 252, 279, 319, 336, 362 and 389 |
Histoblots from both sagittal and coronal sections of prion-infected brains were generated from the eight mouse–prion strain combinations. While all prion inoculations were done in the right hemisphere targeting the thalamus, we have brain sections created from both the left and the right hemisphere during the course of disease progression. The earliest time point presented in each case is the last one that was indistinguishable from a control, uninfected brain section processed at the same time. With an exception of Tg4053-RML combination, the PDDB provides time-course coronal histoblots with the similar time intervals used in mRNA studies. However, the PDDB provides only two time-course sagittal histoblots from Tg4053-RML and Prnp0/+-RML combinations while it provides sagittal histoblots at a single time point near the terminal stage for the rest of mouse–prion strain combinations.
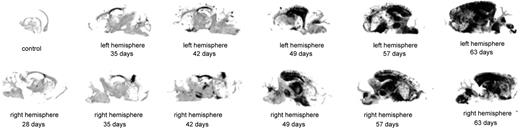
Histoblots representing PrPSc accumulation during the course of prion infection. An example set of histoblots from left and right brain hemispheres of Tg4053-RML showing significant PrPSc accumulation after 49 days.
The PDDB also provides other types of relevant information such as (i) abundances of mRNAs across 30 types of tissues (27) and (ii) so-called ‘Gene Page’ annotation information including Gene Ontology information, protein interactions, KEGG/Biocarta pathways, and genetic association information. The tissue specificity information can be used to support prediction of diagnostic marker candidates indicating physiological changes in a specific target organ (i.e. brain in prion disease) out of a set of DEGs (e.g. top 20 shared DEGs) identified from the time-course gene expression data.
Figure 5A shows the ‘Gene Page’ information for an example gene GFAP. According to KEGG and Biocarta, GFAP is a structural component of intermediate filaments (see the red box in Figure 5A) and is involved in prion disease pathway as an indicator of gliosis, a key early event during prion infection. Also, the brain specific expression pattern of GFAP, as indicated by relatively high abundance in the nervous system as shown in Figure 5B, suggests that it reflects physiological changes occurring during the progress of prion disease. A subset of these nervous systems proteins that can be secreted into the extracellular space and further into the blood stream can serve as excellent candidates for serum diagnostic markers. A network including GFAP can be reconstructed using protein interactions from the ‘Gene Page’ (see the blue box in Figure 5), which suggests a role of glia in prion pathogenesis. Thus, all these resources, including temporal gene expression changes, histoblots and all the ‘Gene Page’ information, coupled with the suite of the analysis tools in the PDDB collectively support various systems biology studies on prion diseases.
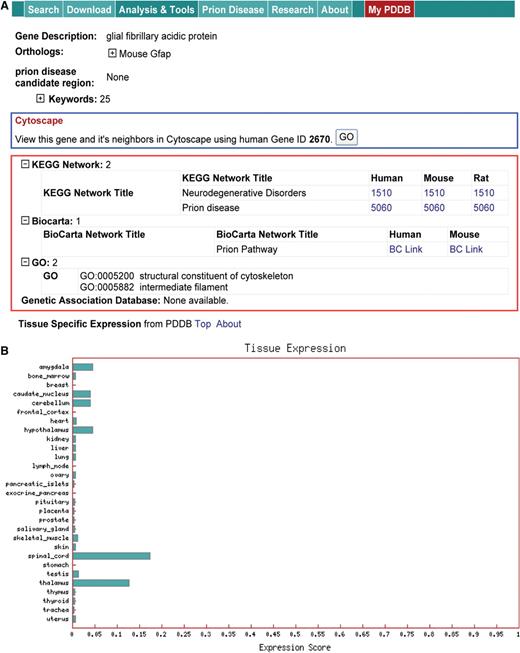
Gene page information. (A) Protein interactions (the blue box), and database information (KEGG and Biocarta pathways and GO information). (B) Tissue specific expression information that can support prediction of diagnostic marker candidates.
Conclusions and outlook
In this article we presented the PDDB, an on-line resource that provides dynamic expression data and histoblots documenting the progression of prion infection in eight different mouse–prion strain combinations, as well as access to a suite of tools for data visualization, exploration, and network reconstruction and analysis. Since the GDxBase software and all other tools used in the construction of the PDDB are freely available, the PDDB can serve as an example for authors of other systems biology studies, who are considering making their data and methods readily available to the community. As we have shown, generic frameworks such as the GDxBase can be extended into custom solutions that provide more functionality than for instance public data repositories, which typically hold only one type of data.
The integration of data and tools in the PDDB helps scientists explore relationships in the data efficiently and collectively evaluate the data. This will make it easier to formulate or cross-check quickly both knowledge-driven hypotheses and hypotheses generated from the data in individual laboratories about key factors involved in fundamental cellular events occurring during the progress of prion disease using both the data and the tools of the PDDB. For instance, it could be used to determine whether a gene plays a role in or its expression level is affected by the progression of prion disease. A gene whose expression levels exhibit (i) consistent increase or decrease during the progress of the disease in any of the five standard mouse–prion strain combinations from Table 1, (ii) increase in the transgenic mice overexpressing Prnp [FVB-Tg(PrP-A)B4053], and 3) no significant increase in the other transgenic mice lacking both alleles of the Prnp gene (FVB.Prnp0/0) is likely to be involved in or affected by prion replication during the early phase of prion infection. Also, the expression data search function can be used to quickly check if a particular set of genes that a user found from his/her own studies using different prion–host combinations is also differentially expressed also in the eight prion-mouse combinations in the PDDB for their general validity. Thus, we believe that the PDDB serves as a public data repository from which a wide spectrum of researchers studying prion and other neurodegenerative disease will benefit as it represents a comprehensive context that can be utilized for interpretation of their own data.
We plan to extend the PDDB in the future to include (i) more types of data (e.g. proteomic data from serum samples from prion infected mice, microRNA data, additional mRNA profiles from peripheral blood mononuclear cells (PBMCs) and spleen and other types of inbred mice, congenic and transgenic mice, etc.) that we have accumulated; and (ii) publicly available data (e.g. mRNA profiles previously published and proteomic data) that we have been collecting.
Funding
National Prion Research Program of the United States Department of Defense [DAMD17-03-1-0321, DAMD17-03-1-0425]; the National Institutes of Health [NS41997], the Korean Food & Drug Administration [08152KFDA412 to D.H.], National Institutes of Health National Center Grant for Systems biology [P50 GM076547]. Funding for open access charge: National Institutes of Health [NS41997].
Conflict of interest. None declared.
The authors wish it to be known that, in their opinion, the first three authors should be regarded as joint First Authors.
Acknowledgements
The authors are extraordinarily grateful for the support of the T1DBase team at the Institute for Systems Biology, in particular Erin Hulbert and Nathan Goodman. We also thank Eric Deutsch and Kerry Deutsch for their support in setting up the database and webserver, as well as Christopher Bare for help with the integration of the Gaggle.
