


Abstract
High-throughput technologies led to the generation of a wealth of data on regulatory DNA elements in the human genome. However, results from disease-driven studies are primarily shared in textual form as scientific articles. Information extraction (IE) algorithms allow this information to be (semi-)automatically accessed. Their development, however, is dependent on the availability of annotated corpora. Therefore, we introduce RegEl (Regulatory Elements), the first freely available corpus annotated with regulatory DNA elements comprising 305 PubMed abstracts for a total of 2690 sentences. We focus on enhancers, promoters and transcription factor binding sites. Three annotators worked in two stages, achieving an overall 0.73 F1 inter-annotator agreement and 0.46 for regulatory elements. Depending on the entity type, IE baselines reach F1-scores of 0.48–0.91 for entity detection and 0.71–0.88 for entity normalization. Next, we apply our entity detection models to the entire PubMed collection and extract co-occurrences of genes or diseases with regulatory elements. This generates large collections of regulatory elements associated with 137 870 unique genes and 7420 diseases, which we make openly available.
Database URL: https://zenodo.org/record/6418451#.YqcLHvexVqg
Introduction
In recent years, it has become increasingly clear that alterations in regulatory DNA are associated with disease (1, 2). The advent of new sequencing technologies induced a sharp increase in the number of studies delivering data on regulatory elements and features, especially on: enhancers, promoters and transcription factor binding sites (TFBSs). The studies can be divided into two main categories: (i) large-scale hypothesis-free and genome-wide approaches (e.g. FANTOM (3) or ENCODE (4)) and (ii) hypothesis- or disease-driven ones. While many results of the first category can be accessed as large web-based databases (5, 6), those of targeted experiments are primarily shared as text via scientific articles (7). Systematizing and making this information accessible is crucial to derive or test hypotheses on the molecular basis of diseases in cases where deep sequencing has not yet led to a molecular diagnosis (8, 9).
One of the largest archive of biomedical literature, PubMed (https://pubmed.ncbi.nlm.nih.gov/) (10), provides citations for more than 33 million articles. However, finding specific information by querying PubMed, for instance regarding the genes regulated by a specific enhancer, is difficult due to the large variability in naming enhancers, genes and their mutual relationships (see below). Information extraction (IE) algorithms can (semi-)automatically extract valuable new knowledge to be incorporated into existing resources central to research. High-quality annotated corpora are of utmost importance for the development of IE systems. To the best of our knowledge, no other corpora for regulatory elements are available. Therefore, here we present the RegEl (Regulatory Elements) corpus, the first annotated corpus with mentions of regulatory DNA elements.
To create the corpus we selected 305 PubMed abstracts reported in EnDB (11), a literature-curated database of experimentally validated enhancers. Three annotators with a background in biology/bioinformatics and familiar with the topic of regulatory elements annotated the abstracts in two phases: a preliminary step to develop the annotation guidelines and a second for the bulk of the annotation. The final inter-annotator agreement (IAA) for regulatory elements reached a moderately low 0.46 phrase-level F1 score. This prompted us to perform an extensive error analysis, leading to the re-annotation of the entire corpus. The disagreement was mostly caused by the variety (and vagueness in the worst cases) of the expressions describing regulatory elements. Additionally, normalization, i.e. the process of grounding textual mentions to a reference ontology (genomic coordinates in this case), was feasible only in limited cases. Nevertheless, our corpus enables the training of models for large-scale mining of the scientific literature. Identified putative mentions can be evaluated by human experts in order to (i) assure their validity and (ii) determine further necessary information, a process called expert curation (12).
The RegEl corpus (https://zenodo.org/record/5 776 679) and the code to reproduce our experiments (https://github.com/reg-el/regel-corpus) are freely available. Furthermore, we publicly release the entity detection models trained on RegEl, which can be used to annotate arbitrary documents (https://huggingface.co/regel-corpus). We also make available the annotations computed by these models over >20 million PubMed abstracts and their co-occurrences with genes and diseases (https://zenodo.org/record/6 418 451). For instance, considering articles referencing the gene TP53, we find 1345 articles that also mention an enhancer, 7.745 with a promoter and 4.272 with a TFBS, at an estimated precision—on a random sample—of 0.34, 0.78 and 0.50, respectively.
The rest of the paper is organized as follows. In Section ‘Materials and methods’ we outline the pipeline for the creation of the corpus and the biomedical IE models. In Section ‘Results’ we present the results of the annotation process, the corpus statistics and the outcome of the IE experiments. After discussing our findings in Section ‘Discussion’ we conclude the paper in Section ‘Conclusion’.
Materials and methods
Document selection
Randomly drawing abstracts for annotation from PubMed would result in a low fraction of relevant documents. Given the fairly recent interest in the non-coding space, we selected the initial pool of abstracts from an existing regulatory resource, i.e. EnDB (11). EnDB is a recent literature-curated database of experimentally validated enhancers. This generates a certain bias (see Section ‘Entity statistics’), since there are more mentions of regulatory elements in this corpus than in a randomly drawn sample from PubMed. However, the models we learn and provide are still useful as they are capable of generalizing to new text and do not simply learn to find a regulatory element in every document. In Section ‘Regulatory element models: error analysis’ we estimate the drop in precision that can be expected when applying them to arbitrary documents. Another option is to use them on sets of pre-selected documents, for instance those identified by a query enriching for regulatory elements.
Entity annotation
We annotated a total of eight biomedical entities with the ‘brat’ annotation tool (13): enhancer, promoter, TFBS, tissue, gene, disease, species and variant. As common practice, ‘entities’ denote categories covering all elements to which words or phrases, ‘mentions’ from now on, can refer. For instance, in the sentence ‘Mismatch repair deficiency is a hallmark of Lynch syndrome’, ‘Lynch syndrome’ is a mention of the disease entity. For a complete overview of regulatory elements we refer the interested reader to (14). In the following, we briefly discuss our annotation strategies and refer the reader to the annotation guidelines in Supplementary Material 1 for details.
Regulatory element entities
We first focus on regulatory elements, as RegEl is the first corpus to annotate such entities. Promoters are DNA sequences located in the 5’ region of genes near the transcription start site (TSS). Binding of a transcription factor (TF) to a gene promoter is required for transcription. Enhancers can be located thousands of base pairs away from the promoter, but they form DNA loops that bring them closer to the promoter region. TFs bound to the enhancer can interact with those bound to the promoter and hence regulate gene expression. Because the binding of TFs is required to activate promoters and enhancers, we include binding sites (TFBSs) as well in our annotation.
Regulatory elements are an active area of research, thus codifying the instructions to annotate these entities is nontrivial. Mentions of enhancers and promoters are often in the form ‘X enhancer/promoter’ where X is the name of a gene, e.g. ‘Pdx-1 gene promoter’. We annotated any additional text that further defines the element, e.g. its location (‘-6.4 kb relative to the transcriptional start site’) or the tissue in which it is active (‘arcuate nucleus-specific’). If the additional information is in itself a mention (e.g. a gene or a tissue), this is annotated as well with its corresponding entity, meaning that RegEl contains nested annotations.
We also accepted elements described to have an enhancer or promoter ‘function’/‘activity’, e.g. ‘enhancer function for HRE1’ as they may still be indicative of a regulatory DNA sequence. In a preliminary phase, for the TFBS entity we developed a list of trigger words ([binding site, motif, response element, consensus sequence]) which, in combination with a TF, might signal a valid mention. References to ‘binding sites’ (plural) were admitted too, since they are motifs that can be identified across locations, i.e. they are specific to a TF or a family of TFs.
We accepted only those mentions to which, in principle, it would be possible to assign genomic coordinates, thus excluding the frequent cases where regulatory elements are discussed as a category, as opposed to a specific DNA sequence, e.g. ‘Enhancers can contact a rhythmic promoter […]’. We did however annotate entities referring to multiple regions, e.g. ‘Igkappa gene enhancers’, since, hypothesizing a perfect knowledge of the genome, it would be possible to enumerate all the enhancer regions of the given gene.
Other entities
As they govern the spatiotemporal expressions of genes, activity of regulatory elements is highly tissue-specific (4). Therefore, information on where an element is active can be a relevant joint criterion for search. In the annotation set, we include a unique entity, tissue, covering any mention of organs (e.g. ‘liver’) and cell lines (e.g. ‘Pt-K2 cell’).
We also considered four entities found in other corpora (15, 16), namely: gene, disease, species and variant. We based the initial annotation guidelines for the gene entity on those created for the BioCreative V GPRO corpus (17) and on those of tmVar (18) for variant. For disease and species we relied instead on the prior knowledge of the annotators. Nevertheless, we refined the guidelines for all entities according to the cases encountered during annotation.
Under the gene entity, we aggregated official gene names and their abbreviations/variations (e.g. ‘IL6’), proteins and enzymes (e.g. ‘ferrodoxin reductase’) but excluded gene groups and complexes (e.g. ‘NFκB’). We include as well transcription factors (e.g. ‘STAT5’), but do not handle multimeric TFs and co-factors as standard text mining models for genes and gene-related entities lack the sophistication to account for these specific cases.
We annotated any medical condition as disease and any taxonomic rank as species. For variants we included: dbSNP identifiers, notations in Human Genome Variation Society (HGVS) format (e.g. ‘111:987654G>A’) or the distance from the start ATG (e.g. ‘c.-390delA’) where the transcript ID was available. As common practice (19), we pre-annotated all documents with genes, diseases, variants and species with annotations provided by PubTator (20) and asked the annotators to confirm their correctness or amend them when necessary.
Entity normalization
During annotation we performed mention normalization. We linked genes to National Center for Biotechnology Information (NCBI) Gene (21) and species to NCBI Taxonomy (22). We normalized variants to dbSNP (23) whenever possible, otherwise we used the VCF (https://en.wikipedia.org/wiki/Variant_Call_Format) notation. We chose the Brenda Tissue Ontology (BTO) (24) to normalize the tissue entity. Finally, we mapped diseases to MONDO (25), which is a unified terminology also defining equivalence relations between diseases from different resources.
Identifying genomic coordinates of regulatory elements
Normalization of enhancers, promoters and TFBSs is much more involved than for the other entities, because for these types of regulatory elements neither a standard naming convention nor an acknowledged reference database exists. Therefore, we targeted coordinates of the respective genomic region as identifying information, since this allowed to find same or overlapping elements in different publications. Specifically, we used the BED format (https://en.wikipedia.org/wiki/BED_(file_format)), a standard text file format used to store genomic regions as coordinates.
Because EnDB reports the genomic coordinates of the described enhancers for each curated publication, we eased the grounding process by presenting these coordinates to the annotators. For validation, annotators were allowed to use also external resources, such as NCBI Gene. However, to judge extraction quality based exclusively on abstracts, annotators were not allowed to use the full text article or perform searches in the literature. If a coordinate could be confirmed, this was marked specifically during annotation.
However, such a normalization was successful only for a small fraction of regulatory elements (see Section ‘Entity statistics’), because most of the articles do not report coordinates in the abstract. References to a location are almost always only relative to another entity, such as in ‘region -4701 to -7501 bp upstream of IGFBP-1’, and often vague, e.g. ‘6-kb promoter region upstream of the distal TSS’ or ‘enhancer region 17 kb upstream of the Col1a2 gene TSS’. An additional challenge is the frequent lack of an explicit reference to the genome assembly used in the study. These issues are in line with what is reported by authors of literature-curated databases of regulatory elements (7, 11), even when reviewing full text articles.
Therefore, we suggest that it is of high importance to establish a standardized naming convention and a reference database for general regulatory elements. Nonetheless, future versions of our corpus will most likely switch to a more flexible representation of grounding information for these types of entities.
Annotation process
The annotation process was supervised by an annotation leader, who was in charge of preparing documents for annotation, developing annotation guidelines and organizing conflict resolution but did not perform any annotation. Overall, three annotators with a background in biology/bioinformatics and familiar with the topic of regulatory elements worked at the creation of the corpus. The annotation process was split into two stages. The first stage consisted of multiple rounds where all annotators worked on the same small batches (∼10 abstracts each). Each round was followed by a disagreement analysis with the annotation leader. The aim of this process was to iteratively refine the annotation guidelines. It also allowed the annotators to gain experience with the ‘brat’ annotation tool used in the project. This phase initially started with two annotators who worked for three rounds. A third annotator joined the team and after two more rounds we achieved the desired overall agreement (before conflict resolution) of 0.75 phrase-level F1 score (see Section ‘Annotator agreement’ for more detailed numbers).
In the second stage we performed the bulk of the annotation. Each annotator was assigned a set of 90 documents, of which 15 were shared across sets. The overall IAA remained stable: 0.73 at the phrase level. However, we noted a significant decrease for the regulatory element entities, from an average phrase-level ∼60 F1 in the first stage to 0.46. The drop is to be attributed to the high variety of expressions encountered during annotation (see Section ‘Regulatory element entities’). For this reason, we performed a concluding and extensive disagreement analysis in order to identify the major causes of differences.
Eventually this led to the re-annotation of all mentions of regulatory elements in the entire corpus. The re-annotation was performed by the annotation leader in collaboration with all annotators. We did not compute the IAA since this is a final post-processing step aimed to ensure the highest level possible of consistency. Figure 1 depicts an overview of the annotation process.
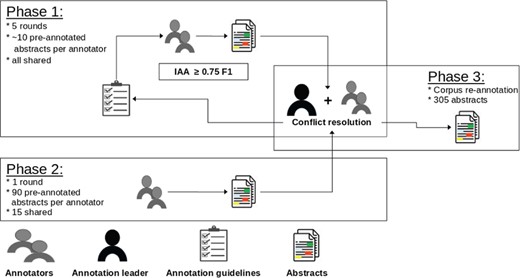
Overview of the annotation process. In each phase we denote how many documents were annotated and how many were shared across annotators. The error analysis is supervised by the annotation leader.
Baseline methods for information extraction
We trained or evaluated models for in-corpus named entity recognition (NER, see Section ‘Named entity recognition’) and named entity normalization (NEN, see Section ‘Named entity normalization’) for all entities in the corpus to judge upon the expected quality of performing IE for regulatory elements. Furthermore, we applied some of these models over all PubMed abstracts and manually evaluated their precision on a randomly sampled set of abstracts (see Section ‘Large-scale co-occurrence analysis’). In Table 1 we report an overview of the software used in each experiment. Unless stated otherwise, we downloaded annotations generated by the tools via the PubTator API (https://www.ncbi.nlm.nih.gov/research/pubtator/api.html).
Overview of the different software used for each entity and experiment: NER, NEN and co-occurrence analysis (COO). † NER only ‡ both NER and NEN.
| NER | NEN | COO | |
|---|---|---|---|
| Enhancer | HunFlair | – | HunFlair† |
| Promoter | HunFlair | – | HunFlair† |
| TFBS | HunFlair | – | HunFlair† |
| Tissue | HunFlair | BioSyn | – |
| Disease | HunFlair | BioSyn | DNorm‡ |
| Gene | HunFlair | GNormPlus | GNormPlus‡ |
| Species | HunFlair | SR4GN | – |
| Variant | tmVar | tmVar | – |
Named entity recognition
For the NER task (also known as entity detection) we used HunFlair (15), a state-of-the-art tagger for biomedical texts. The basic model is a tagger equipped with embeddings pre-trained on PubMed and full texts from PubMed Central (PMC) (https://www.ncbi.nlm.nih.gov/pmc/). We used this model to train the taggers for the regulatory element entities. HunFlair also offers taggers pre-trained on already existing corpora for the following entities: gene, disease and species. For these entities we report the performance both with and without fine-tuning on RegEl.
For the evaluation, we used a 5-fold cross-validation protocol. To mimic the real-word use case in which taggers annotate never-seen documents, each fold comprises 244 abstracts for training and 61 abstracts for testing. In each run, a model was trained for a maximum of 50 epochs with mini-batches of size 32 and an initial learning rate of 0.1. The models were trained with stochastic gradient descent, and the learning rate was halved if the training loss did not decrease for three consecutive epochs. We used the original HunFlair implementation (https://github.com/flairNLP/flair/blob/master/resources/docs/HUNFLAIR.md). The only exception is the variant entity, for which we used tmVar (18) since there is no available HunFlair model for this entity and the amount of training examples is limited (55 sentences).
Named entity normalization
NEN was performed with the following tools: a recently updated version of GNormPlus (19, 26) for genes, SR4GN (27) for species and tmVar for variants. These tools do not allow the use of pre-computed mentions (e.g. those extracted by HunFlair) but rely on an integrated entity detection component.
As there are no readily available tools to link disease and tissue mentions to MONDO and BTO, respectively, we employed a current state-of-the-art method, namely BioSyn (28). This is a dense retrieval model based on BioBERT (29), a language model pre-trained on PubMed and PMC. For training, we used hyper-parameters as specified by the authors. The models were trained with Adam (30) for 10 epochs with a learning rate of 1−5 and mini-batches of size 16. We used the implementation made publicly available by the BioSyn authors (https://github.com/dmis-lab/BioSyn). The same folds used in the NER experiment were used for training and evaluation.
Large-scale co-occurrence analysis
The ultimate goal of IE for regulatory elements is their automatic and precise identification at PubMed scale, preferably together with their regulated genes and the diseases they influence. Toward this goal, we applied our new models for regulatory elements to all abstracts in PubMed and performed a co-occurrence analysis with genes and diseases. This experiment has two purposes. Firstly, we estimate the expected precision of NER based on the manual evaluation of a randomly drawn sample of identified regulatory elements. Secondly, we provide the list of co-occurrences (gene/disease with regulatory elements) together with the sentences and PubMed identifiers for any interested researcher. These lists may help to quickly find enhancers or promoters of genes and/or associated diseases. They could also serve as a basis for the manual curation of databases of regulatory elements.
We first downloaded normalized mentions of genes and diseases from the PubTator FTP server (ftp://ftp.ncbi.nlm.nih.gov/pub/lu/PubTatorCentral). These annotations are generated with GNormPlus for genes (normalized to NCBI Gene) and DNorm for diseases (MeSH). We relied on PubTator annotations because running our HunFlair (for NER) and BioSyn (for NEN) models for genes and diseases over the entire PubMed collection would have been prohibitively time-consuming. We then selected all abstracts containing at least one mention of a gene or a disease and split the abstracts into sentences with SciSpacy (31).
For each regulatory element we trained a HunFlair model on the entire RegEl corpus for a maximum of 100 epochs and used it to annotate these abstracts. For quality control, we randomly sampled 50 mentions (and sentences in which they appear) for each regulatory element, each one coming from a different abstract in order to maximize the sample coverage. We manually verified their correctness and used these numbers to estimate the model’s precision.
Results
We first report the estimated quality (Section ‘Annotator agreement’) and frequencies (Section ‘Entity statistics’) of annotated entities in RegEl. Next, we highlight the performance of our different models for NER and NEN in Section ‘Named Entity Recognition’ and Section ‘Named entity normalization’, respectively. In Section ‘Co-occurrences of genes and diseases with regulatory elements’ we eventually describe the result of our co-occurrence experiment.
Annotator agreement
The IAA assesses the consistency and quality of the annotations in the corpus. The scores reported in this section are the ones computed with the set of 15 shared abstracts processed during the second phase of the annotation before conflict resolution (see Section ‘Annotation process’). We consider this to be the effective IAA, since the corpus re-annotation (Phase 3 in Figure 1) was a post-processing collaborative effort of annotators and annotation leader.
Table 2 shows that annotators achieved an overall 0.73 (±0.03) and 0.75 (±0.03) F1 at the phrase and token level respectively, representing a substantial agreement. However, if we take into account exclusively the regulatory elements, IAA drops to a comparably low 0.46 at the phrase level and 0.60 at the token level. The gap between the two, up to ∼16 percentage points (pp) for promoters, suggests that overall the disagreement is not caused by completely misplaced annotations, but by the different choices in regard to which words to include. This also explains the high standard deviation presented at the phrase level by these entities: up to 16 pp for TFBS. We attribute this to the great variety of expressions used to denote regulatory elements, which we were able to codify in higher depth only after a revision of the annotation guidelines (see Section ‘Annotation process’). The perfect agreement on the variant entity is caused by all mentions being dbSNP identifiers.
Phrase- and token-level IAA measured as micro-averaged F1-score for each entity. We distinguish between entities for which pre-annotations were used (‘Pre-annotated’, lower half) and those annotated from scratch (‘New’, upper half).
| Phrase level | Token level | Norm. | |
|---|---|---|---|
| New | |||
| Enhancer | 0.40 (±0.11) | 0.52 (±0.09) | – |
| Promoter | 0.50 (±0.10) | 0.66 (±0.07) | – |
| TFBS | 0.49 (±0.16) | 0.44 (±0.18) | – |
| Tissue | 0.67 (±0.01) | 0.80 (±0.03) | 0.70 (±0.01) |
| Pre-annotated | |||
| Gene | 0.85 (±0.03) | 0.88 (±0.02) | 0.95 (±0.02) |
| Disease | 0.82 (±0.08) | 0.82 (±0.06) | – |
| Species | 0.75 (±0.08) | 0.77 (±0.06) | 0.97 (±0.01) |
| Variant | 1.0 (–) | 1.0 (–) | 1.0 |
| Total: regulatory elements | 0.46 (±0.12) | 0.60 (±0.09) | – |
| Total: all | 0.73 (±0.03) | 0.75 (±0.03) | – |
Normalization scores were computed with the subset of mentions that were identified and normalized by all annotators. We omit scores for the regulatory element entities since it turned out to be unfeasible. Disease scores are missing because this entity was normalized by a single annotator, as we were able to determine a suitable ontology only at the end of the annotation process.
Entity statistics
The EnDB database contains information stemming from 419 documents, of which we annotated 305: totaling 2690 sentences. Notably, 55 annotated abstracts contain no valid mention of regulatory elements according to the definitions of our annotation guidelines. This is due to the fact that for building EnDB, full-text articles were reviewed, while we only considered abstracts. Importantly, the 55 abstracts without regulatory elements compose a significant set of negative examples (∼18% of the corpus), making RegEl more balanced for training.
The prevalent entity type is gene with 4125 mentions. However, in Table 3 we see that the difference in unique mentionsbetween genes and regulatory elements is much smaller (814 vs 1002) than the absolute one (4125 vs 1261). Thus, the predominance is explained by the fact that often the same gene is mentioned multiple times in one abstract, whereas mentions of regulatory elements are usually unique. We note that the latter tend to be considerably longer than all other entities. This reflects the fact that no naming conventions exist yet, leading to the usage of descriptive periphrases, e.g.: ‘intronic enhancer locating between +1719bp and +2453bp from the TSS of the gene’.
For each entity we report: total number of mentions, how many are unique surface forms and the length in number of characters (including white spaces). We include the ratio of normalized mentions and the corresponding numbers of unique entities after linking. Highest and second highest values are in bold and underlined, respectively.
| Annotations | Unique | Mean length | Norm. (%) | Entities | |
|---|---|---|---|---|---|
| Regulatory elements | |||||
| Enhancer | 809 | 508 | 29.28 | 6% (53) | 14 |
| Promoter | 246 | 146 | 18.66 | 4% (11) | 3 |
| TFBS | 206 | 160 | 33.29 | 0% (0) | 0 |
| Total | 1261 | 814 | – | 5% (64) | 17 |
| Other | |||||
| Tissue | 1616 | 740 | 15.15 | 88% (1433) | 308 |
| Gene | 4125 | 1002 | 9.88 | 100% (4125) | 691 |
| Disease | 700 | 293 | 16.09 | 94% (661) | 147 |
| Species | 587 | 59 | 8.51 | 100% (587) | 26 |
| Variant | 80 | 39 | 9.26 | 95% (76) | 34 |
We note that it was possible to identify genomic coordinates in the abstract for only 5% of regulatory elements. As reported in Section ‘Entity normalization’ this is due to (i) limiting the annotation to abstracts and (ii) location information often being insufficiently precise. While all mentions of genes and species were successfully normalized, there were unresolved mentions for tissue, disease and variant. In case of tissues, this was caused by the lack of specific anatomical parts, e.g. ‘second heart field’ and ‘outflow tract’ or cell lines, e.g. ‘V2a precursors’ and ‘ShP51 cells’ in BTO. For diseases, we encountered the problem that general categories such as ‘hypoxia’ and ‘smoking-related disease’ are not contained in MONDO. Ambiguous variants as ‘g.17483576C>G’ and ‘R482W’ could also not be normalized.
Performance of information extraction baselines
Named Entity Recognition
Table 4 highlights the results of the entity detection (NER) experiment. All results are for the HunFlair models except the variant entity. We see that the HunFlair models generalize quite well for the new entities, especially considering the relatively small amount of training data available. The performance of regulatory elements models is higher than the final IAA, showing that the re-annotation step improved the overall consistency of the annotations. The only exception is the TFBS model. We hypothesize that this is due to the particularly small amount of training data (only 159 sentences) paired with the high variety of expressions associated with these entities, e.g. ‘octamer sequence 5’-ATGCAAAT-3’ at -10.2 kb in the hiNOS promoter’ and ‘6-bp cis-element mediating BMP2-dependent transcription’.
Performance of the HunFlair models for all entities except variants, for which we used tmVar. HunFlair results are averaged over 5-folds with standard deviation in brackets (except for the variant entity). The ‘zero-shot’ rows show the result of the entity-specific pre-trained HunFlair models without additional training on the corpus folds. We do not include here the performance of tools for which the NER and NEN steps cannot be separated, which would make a comparison unfair. See Table 5 for their joint results.
| Precision | Recall | F1 | |
|---|---|---|---|
| HunFlair/Enhancer | 0.73 (±0.05) | 0.63 (±0.04) | 0.68 (±0.03) |
| HunFlair/Promoter | 0.83 (±0.06) | 0.78 (±0.09) | 0.80 (±0.04) |
| HunFlair/TFBS | 0.59 (±0.06) | 0.41 (±0.12) | 0.48 (±0.09) |
| HunFlair/Tissue | 0.81 (±0.02) | 0.80 (±0.01) | 0.80 (±0.01) |
| HunFlair/Disease | 0.88 (±0.02) | 0.83 (±0.04) | 0.85 (±0.03) |
| zero-shot | 0.60 (–) | 0.77 (–) | 0.67 (–) |
| HunFlair/Gene | 0.91 (±0.01) | 0.95 (±0.02) | 0.93 (±0.01) |
| zero-shot | 0.65 (–) | 0.74 (–) | 0.69 (–) |
| HunFlair/Species | 0.92 (±0.02) | 0.91 (±0.06) | 0.92 (±0.04) |
| zero-shot | 0.82 (–) | 0.88 (–) | 0.85 (–) |
| tmVar/Variant | 0.90 (–) | 0.89 (–) | 0.90 (–) |
We observe a considerable drop in F1-score when comparing the HunFlair models with and without fine-tuning (zero-shot). While for disease and species performances are comparable to the one reported in the original HunFlair paper (They report 0.65 F1 and 0.76 for the disease and species entity, respectively), the expectation for the gene entity is less clear-cut. On BioNLP 2013 CG (32) (also used for disease and species) they report 0.87 F1, while on the CRAFT corpus (v4.0) (33) they report 0.73 F1. We attribute the lower F1 in our corpus to the fact that we excluded gene groups and complexes from annotation. This is supported as well by the considerable difference between precision (0.65) and recall (0.74).
Named entity normalization
Table 5 shows the performance at the mention level of the combined NER and NEN systems on the RegEl corpus. Models for genes, species and variants perform a joint NER+NEN analysis. All systems but BioSyn have the NER component integrated. Therefore, for the tissue and disease entities we used the mentions extracted by the fine-tuned HunFlair models. The BioSyn models were trained and evaluated with the same 5-folds used in the NER experiments.
Performance of baselines on the NEN task. Results for the tissue and disease entity are averaged over 5-folds.
| Precision | Recall | F1 | |
|---|---|---|---|
| GNormPlus/Gene | 0.88 (–) | 0.81 (–) | 0.85 (–) |
| SR4GN/Species | 0.85 (–) | 0.86 (–) | 0.86 (–) |
| tmVar/Variant | 0.84 (–) | 0.82 (–) | 0.83 (–) |
| BioSyn/Tissue | 0.80 (±0.04) | 0.67 (±0.05) | 0.73 (±0.04) |
| BioSyn/Disease | 0.71 (±0.05) | 0.69 (±0.04) | 0.70 (±0.01) |
Our evaluation shows that the off-the-shelf NEN tools are relatively robust when applied to unseen documents, all achieving an F1-score above 0.80. The BioSyn models perform worse, which is expected, since they were trained only on the four folds of the RegEl corpus.
Co-occurrences of genes and diseases with regulatory elements
At the time of our analysis (November 2021), there were 20 850 853 PubMed abstracts pre-annotated by PubTator with at least a gene or a disease mention. After analyzing them with our HunFlair models, we found that 347 111 also contain a mention of a regulatory element.
These abstracts present >3.3M mentions of genes (∼138K unique identifiers) and >2M mentions of diseases (∼7K unique identifiers). Table 6 shows that although the number of gene identifiers is twice the number of diseases, the ratio of regulatory elements per gene can be as much as 10 times smaller than the one of diseases. This is due to the fact that many diseases are general categories such as ‘Infections’ (D007239), which quickly gather hundreds of co-occurrences.
For each regulatory element we list the number of abstracts containing at least one mention along with their counts. We report the average number of mentions associated with a gene and a disease identifier. For instance, on average, 4.16 enhancer mentions are associated with a gene (Coo. G) and 53.31 with a disease (Coo. D). We include as well the precision estimated on a random sample for each type of regulatory element
| Annotations | Entities | Abstracts | Coo. G | Coo. D | Precision | |
|---|---|---|---|---|---|---|
| Enhancer | 96 490 | – | 68 265 | 4.16 | 53.31 | 0.34 |
| Promoter | 270 040 | – | 156 106 | 13.37 | 146.73 | 0.78 |
| TFBS | 245 342 | – | 161 864 | 10.3 | 92.22 | 0.50 |
| Gene | 3 307 582 | 137 870 | 281 931 | – | – | – |
| Disease | 2 034 179 | 7420 | 248 201 | – | – | – |
In Tables 7 and 8, respectively, we report the top 10 genes and diseases ranked by the number of publications with co-occurring regulatory elements. For instance, we find 1345 publications in which both TP53 and an enhancer appear, or |$12\,292$| (9933) papers where promoters co-occur with breast cancer (colorectal cancer). Notably, both tables are dominated by cancer-related entities, e.g.: (i) ‘Neoplasm’ and its subcategories for diseases and (ii) known cancer genes such as ‘TP53’, ‘MYC’ or ‘TNF’ for genes. Also note that in RegEl ∼40% of the disease entities are cancer-related although EnDB did not specifically filter for diseases when collecting publications. This prevalence reflects a publication bias, as there is a particularly large amount of literature on cancer.
Gene names (with NCBI Gene identifiers in parentheses) presenting the highest number of co-occurrences with regulatory elements (number of publications after semi-colon). For instance, in our annotated collection the gene NFKB1 with NCBI Gene identifier ‘4790’ is co-occurring with an enhancer mention in 1170 publications.
| Enhancer | Promoter | TFBS | |
|---|---|---|---|
| 1 | TP53 (7157): 1345 | TP53 (7157): 7714 | TP53 (7157): 4272 |
| 2 | MYC (4609): 1201 | TNF (7124): 5994 | F2 (2147): 4013 |
| 3 | NFKB1 (4790): 1170 | NFKB1 (4790): 5597 | NFKB1 (4790): 3484 |
| 4 | GAPDH (2597): 1158 | GAPDH (2597): 5459 | MYC (4609): 3417 |
| 5 | TNF (7124): 1131 | MYC (4609): 5132 | LXN (56 925): 3371 |
| 6 | AKT1 (207): 955 | AKT1 (207): 4252 | TNF (7124): 3011 |
| 7 | IL6 (3569): 800 | POTEF (728 378): 4024 | RNU12-2P (26 823): 2706 |
| 8 | INS (3630): 783 | IL6 (3569): 3837 | SNORA75 (654 321): 2695 |
| 9 | EZH2 (2146): 781 | SDHC (6391): 3550 | SNORD33 (26 818): 2692 |
| 10 | CTNNB1 (1499): 767 | TGFB1 (7040): 3409 | SNORD22 (9304): 2691 |
Disease names (with MeSH identifiers in parentheses) presenting the highest number of co-occurrences with regulatory elements (number of publications after semi-colon). For instance, in our annotated collection the disease adverse drug reaction (ADR) with MeSH identifier ‘D064420’ is co-occurring with a promoter mention in 8560 publications.
| Enhancer | Promoter | TFBS | |
|---|---|---|---|
| 1 | Neoplasms (D009369): 11 276 | Neoplasms (D009369): 40 011 | Neoplasms (D009369): 25 437 |
| 2 | Infections (D007239): 6316 | Breast Neoplasms (D001943): 12 292 | Infections (D007239): 7676 |
| 3 | ADR (D064420): 4247 | Infections (D007239): 10 867 | ADR (D064420): 7511 |
| 4 | Death (D003643): 3667 | Inflammation (D007249): 10 561 | Breast Neoplasms (D001943): 7352 |
| 5 | Inflammation (D007249): 3124 | Colorectal Neoplasms (D015179): 9933 | Anodontia (D000848): 6397 |
| 6 | Breast Neoplasms (D001943): 2959 | Carcinoma, Hepatocellular (D006528): 8742 | Genetic Diseases, Inborn (D030342): 5946 |
| 7 | Drug Hypersensitivity (D004342): 2798 | ADR (D064420): 8560 | Inflammation (D007249): 5892 |
| 8 | Diabetes Mellitus (D003920): 2290 | Death (D003643): 7791 | Protein S Deficiency (D018455): 5836 |
| 9 | Colorectal Neoplasms (D015179): 2239 | Carcinogenesis (D063646): 7279 | Colorectal Neoplasms (D015179): 4504 |
| 10 | Carcinoma, Hepatocellular (D006528): 2160 | Prostatic Neoplasms (D011471): 6652 | Death (D003643): 4294 |
Entities ‘Anodontia’ and ‘Protein S Deficiency’ in the TFBS column strike as outliers when comparing their level of granularity with regard to the rest of the entries. We find that this is due to the joint false positives of the TFBS and disease entity detection models: the first is prone to tag chemical formulas (see below) while the second, in publications describing chemicals, annotates as disease expressions as ‘N atoms’ or ‘H atoms’.
Regulatory element models: error analysis
For each regulatory element entity we performed a quality control of the NER models on a random sample of 50 mentions and the corresponding sentences: each from a different abstract. We manually examined this sample and computed their precision. While promoters achieve a relatively high 0.78, TFBSs and enhancers reach only 0.5 and 0.34, respectively. For each regulatory element we report examples of correct mentions and demonstrative examples for the major sources of error (Table 9).
Examples of mentions of regulatory elements detected by the HunFlair models. Sentences marked with a |$\checkmark$| present a correct mention while those marked with a × a wrong one.
| Enhancer: |
|---|
| 1.a) |$\checkmark$|: A polymorphic enhancer near GREM1 influences bowel cancer risk […] |
| 1.b) |$\checkmark$|: Significantly, this enhancer is active specifically in hemogenic endothelial cells […] |
| 1.c) ×: The findings also suggest that IES may be an effective strategy for the prevention of DTI. |
| 1.d) ×: The results showed that Ei-151 produced at least three kinds of acylated homoserine lactone. |
| 1.e) ×: The use of an echo enhancer (Levovist) accentuates these differences […] |
| Promoter: |
| 2.a) |$\checkmark$|: A common mutation (G-455|$\rightarrow$| A) in the promoter region of the beta-fibrinogen gene […] |
| 2.b) |$\checkmark$|: […] failure to recruit chromatin remodeling complexes to the Ifng gene promoter. |
| 2.c) ×: […] three CXXC domains also suppressed unmethylated promoter activities in mammalian cells. |
| 2.d) ×: Luciferase promoter activity and immunocytochemistry of nuclear factor-κB (NF-κB) were investigated. |
| 2.e) ×: The 125-day animals were treated with 2A11 on Postnatal Day 1 (P1), P3 and P6. |
| TFBS: |
| 3.a) |$\checkmark$|: […] a 267-bp fragment that contains putative Sp-1, AP-1, Ets, Stat and other binding sites. |
| 3.b) |$\checkmark$|: Mutation of the ERE half-site in the Hsp 27-derived oligonucleotides […] |
| 3.c) ×: In the title compound, [Nd(NO(3))(3)(C(18)H(12)N(6))(H(2)O)]·2H(2)O, the Nd(3+) ion […] |
| 3.d) ×: […] a construct expressing a Z mutant in zinc-binding site 2 of the RING domain […] |
| 3.e) ×: Proliferation of omega 3 binding sites in the immune organs and leg infiltrate of rats […] |
We observe that many false positives, especially for the enhancer model, are acronyms and abbreviations (see examples 1.c and 2.e) which our models wrongly detect as enhancers. The second major source of error consists of trigger words tagged in the wrong context, e.g. general mentions (example 2.c) or multi-word expressions (examples 1.e and 2.d). Related to trigger words is the erroneous annotation of chemical binding sites by the TFBS model (example 3.d). Example 3.b shows how our models are capable of generalization: the TFBS model correctly tags ‘ERE half-site’ (‘Estrogen Receptor Element’) since it was exposed to ‘ARE’ (‘Androgen Receptor Element’) during training.
Discussion
We introduce the RegEl corpus, the first corpus providing annotations at the mention level of non-coding regulatory elements in the genome. The corpus comprises 305 PubMed abstracts and covers, besides standard entities like genes and diseases, the most well-characterized types of regulatory elements, i.e. enhancers, promoters and TFBSs. We observe that many abstracts mentioning a regulatory element do not describe their specific location, which makes their automatic normalization unfeasible. Nevertheless, the NER developed based on RegEl can quickly guide users to putative mentions of regulatory elements, covering a much wider spectrum of possible descriptions than retrievable by pure keyword search.
As mentioned in Section ‘Regulatory element entities’ regulatory elements are typically described in terms of their relation to genes, e.g. ‘enhancer region of GENE’. Therefore, one option for annotation would be to frame regulatory elements as ‘relations’ , e.g. (region, enhances, gene) as in a ‘event extraction’ (34) task. However, we found it more conceptually effective to frame them as ‘entities’ since (i) these elements are actual regions in the DNA and (ii) we are interested in their normalization, i.e. assigning the corresponding genomic coordinates, for which ‘relations’ are less intuitive to use, with the only minor drawback of introducing nested annotations (e.g. gene within a regulatory element).
The corpus achieves an overall high IAA of 0.73 phrase-level F1-score. Following common practice (19) we used PubTator to all pre-annotated documents with genes, diseases, species and variants, which introduces a bias. When considering only the regulatory element entities, the phrase-level IAA drops to 0.46 F1. This shows that correctly and consistently identifying still evolving (and yet rather vaguely defined) concepts such as regulatory elements is challenging. However, as these entities lack normalization, we consider the token-level IAA to be the most relevant measure. This reached a 0.60 F1, with the overall F1 being at 0.75, suggesting that the annotators in three-quarters of all cases agreed on core text spans. In the final disagreement analysis, we amended all incongruities and re-annotated the entire corpus to ensure the highest possible level of consistency.
We trained specific models for NER using the pre-trained models from the HunFlair library. These fine-tuned models are capable of achieving surprisingly good performances (>0.7 F1) on new entities even with the rather limited data. Expanding the current corpus, however, would most likely greatly benefit these models, since the variety of expressions denoting regulatory elements is currently greatly disproportionate to the amount of available training examples. The effect of this limitation can be observed especially when we apply the entity detection models ‘in the wild’, i.e. over PubMed, where, as expected, we register a notable drop in estimated precision (up to 39 pp for enhancers). However, our error analysis (see Section ‘Regulatory element models: error analysis’) reveals that a significant amount of errors is caused by abbreviations (enhancer) and the overlap with other entities, specifically chemicals (TFBS). These errors could probably be reduced significantly by deploying a more sophisticated IE pipeline, for instance by using abbreviation resolution tools (e.g. Ab3P (35)) and discarding mentions annotated by other entity models.
Our co-occurrence analysis at PubMed scale leads to sets of regulatory elements co-occurring with thousands of genes and diseases, which can be an important foundation for more comprehensive investigations. For instance, researchers focusing on the impact of regulation in diabetes can inspect a selection of ∼2K documents, which could be further filtered with more comprehensive IE pipelines. We observe that results of this analysis reflect those types of diseases for which regulatory elements are known to play a role, namely: (rare) genetic diseases (36) and diabetes (37). This include cancer (38) as well, although it might be an artifact caused by the predominance of the literature on this type of diseases. Ultimately, the annotated documents we provide can assist the expert curation of existing databases on regulatory elements.
Conclusion and Future work
We provide the RegEl corpus, the first biomedical corpus annotated with non-coding regulatory DNA elements. The corpus can be used to train information extraction models to automatically inspect the scientific literature for publications on the topic.
Future work should consider the annotation of full text articles, in order to broaden the number of mentions with linked genomic location. This would open the way to the development of systems to automate the normalization of regulatory elements. A second direction is the annotation of the relation (e.g. effects) between variants in regulatory elements and gene expression. This would allow the training of readily available algorithms to automatically identify this information in the literature.
Supplementary data
Supplementary data are available at Database Online.
Funding
Deutsche Forschungsgemeinschaft via the research unit ‘Beyond the Exome’ (FOR 2841).
Conflict of interest.
There is no conflict of interest.
Author contributions statement
U.L., D.S. and M.S. conceived the study and supervised the work. F.L.-G., S.P. and S.H. performed the annotation and further refined the annotation guidelines. Material preparation and information extraction experiments were performed by S.G. The first draft of the manuscript was written by S.G. All authors reviewed and edited previous versions of the manuscript.
