


Abstract
The All of Us Research Program (“All of Us”) is an initiative led by the National Institutes of Health whose goal is to advance research on personalized medicine and health equity through the collection of genetic, environmental, demographic, and health data from volunteer participants who reside in the USA. The program’s emphasis on recruiting a diverse participant cohort makes “All of Us” an effective platform for investigating health disparities. In this work, we analyzed participant electronic health record (EHR) data to identify the diseases and disease categories in the “All of Us” cohort for which racial and ethnic prevalence disparities can be observed. In conjunction with these analyses, we developed the US Health Disparities Browser as an interactive web application that enables users to visualize differences in race- and ethnic-group-specific prevalence estimates for 1755 different diseases: https://usdisparities.biosci.gatech.edu/. The web application features a catalog of all diseases represented in the browser, which can be sorted by overall prevalence as well as the variance in prevalence across racial and ethnic groups. The analyses outlined here provide details on the nature and extent of racial and ethnic health disparities in the “All of Us” participant cohort, and the accompanying browser can serve as a resource through which researchers can explore these disparities
Database URL: https://usdisparities.biosci.gatech.edu.
Introduction
The US National Institute on Minority Health and Health Disparities (NIMHD) defines health equity as the principle that “all individuals or populations have optimal opportunities to attain the best health possible” and health disparities as “health difference[s] that adversely affect disadvantaged populations” [1, 2]. The causes of health disparities are varied and span a multitude of biological, environmental, and social factors [3]. One way that health disparities can be measured is by quantifying differences in disease prevalence between populations [1]. The discovery and quantification of health disparities in this way is a key first step in advancing health equity [4]. Identification of disparity diseases and impacted populations can help to focus subsequent etiological studies as well as intervention efforts. Knowledge of health disparities among disadvantaged populations, and in the health-care setting, can help to avoid and mitigate the impact of those disparities. The study of health disparities will become increasingly important as countries become more diverse [5].
The All of Us Research Program (“All of Us”) is an initiative that was launched by the US National Institutes of Health (NIH) in 2015 with the goal of accelerating research on personalized medicine and health equity [6]. The program advances this goal through the collection of genetic, environmental, demographic, and health-care data from volunteer participants across the USA. From the outset, “All of Us” emphasized the recruitment of participants from groups that have been historically underrepresented in biomedical research, including minority racial and ethnic groups [7]. As a result of these efforts, “All of Us” has assembled a large and highly diverse participant cohort [8–10], with more ancestral diversity than almost any biobank in the world [11]. Given the size and diversity of its participant cohort, together with the availability of electronic health record (EHR) data, “All of Us” provides an opportunity to discover and quantify health disparities for a wide variety of diseases.
The objective of this study was to characterize the landscape of racial and ethnic health disparities in the “All of Us” cohort via differences in disease prevalence among groups. The systematic identification of health disparities in the “All of Us” cohort represents an important first step, which can enable subsequent studies aimed at characterizing their etiology and can help to focus interventions. We performed a phenome-wide analysis of disease prevalence differences among “All of Us” participant self-identified racial and ethnic (SIRE) groups, and we developed the US Health Disparities Browser to enable researchers to explore these health disparities. The browser presents disease prevalence data for 1755 diseases organized into 18 categories based on the analysis of 237 997 “All of Us” participants across seven different SIRE groups. Users can search, browse, and visualize racial and ethnic health disparities for diseases of interest, with options to sort diseases by overall prevalence and differences in prevalence across SIRE groups.
Materials and methods
Study cohort
The web browser was developed from summary statistics calculated from “All of Us” participant data using the “All of Us” Researcher Workbench, a cloud-based platform through which approved researchers can interface with and analyze individual-level “All of Us” participant data. The web browser does not present any individual-level participant data, and it is not connected to the “All of Us”Researcher Workbench. The “All of Us” volunteer participant body is composed of US adults who enrolled in the program either electronically or through a partnered health-care provider. All participants provided informed consent to participate in the program. The participant inclusion criteria include adults under the age of ≥18 years, with the legal authority and decisional capacity to consent and currently residing in the USA or a territory of the USA. Exclusion criteria exclude minors under the age of 18 years and vulnerable populations (prisoners and individuals without the capacity to give consent). Details on participant recruitment, informed consent, and inclusion and exclusion criteria are available online at https://allofus.nih.gov/sites/default/files/All_of_Us_Protocol_Overview_Mar_2022.pdf.
“All of Us” participant data available on the Researcher Workbench include answers to survey questions, lab measurements, EHR data, and genomic data. The data are distributed across three access tiers that differ in sensitivity. The public tier dataset, which contains aggregate statistics, is freely accessible. The registered tier dataset consists of de-identified participant-level data and is restricted to registered researchers. The controlled tier dataset consists of participant-level genomic data. The browser relies on data from the “All of Us” Controlled Tier Dataset v7 (curated version C2022Q4R9).
Participant race and ethnicity
Participants enrolled in “All of Us” are asked to respond to surveys pertaining to details regarding their background and health. A survey titled “The Basics” asks participants “Which categories describe you? Select all that apply. Note: You may select more than one group.” The groups are (1) American Indian or Alaska Native, (2) Asian , (3) Black, African American, or African, (4) Hispanic, Latino, or Spanish, (5) Middle Eastern or North African (MENA), (6) Native Hawaiian or other Pacific Islander, and (7) White. Participants were also given the option to respond with “None of these fully describe me” or “Prefer not to answer.” Participant data on American Indian or Alaska Native identity are currently unavailable on the “All of Us” Researcher Workbench and thus were not included in this study.
As per the current US Office of Management and Budget Standards (OMB) for the classification of federal data on race and ethnicity, participant survey answers are coded as two variables in the Researcher Workbench: “race” and “ethnicity.” The “ethnicity” variable consists of information indicating whether a participant identified as Hispanic or Latino or not. The “race” variable indicates any of the other seven categories the participant may have picked. The “race” variable will list “More than one population” if more than one category other than Hispanic or Latino was selected. Consistent with these standards, we defined Asian, Black, MENA, Native Hawaiian or Pacific Islander (NHPI), and White participants as those who selected these respective racial categories in the “The Basics” core survey and no other racial or ethnic category. We defined Hispanic participants as all who selected “Hispanic, Latino, or Spanish.” We included an additional racial category in our browser titled “Multiple,” which consists of all individuals who selected two or more racial or ethnic categories other than “Hispanic, Latino, or Spanish.” These categories span a total of seven distinct “All of Us” participant SIRE categories used in this study.
Phenotype case-control cohorts
“All of Us”participant diagnoses are coded in their EHR data as International Classification of Diseases codes (ICD-9-CM and ICD-10-CM). These codes were extracted and used to classify individuals as either disease cases or controls according to the phecode scheme outlined by the PheWAS consortium [12]. The phecode scheme provides disease phenotype-specific inclusion and exclusion criteria from which case-control cohorts can be systematically created from ICD codes. Inclusion criteria cover all of the constituent ICD codes for a specific disease phecode, and exclusion criteria cover ICD codes for closely related diseases that do not correspond to that specific phecode. A total of 1755 unique phecode case-control cohorts were created from participant EHR data. Their corresponding phecodes belong to different phecode chapters spanning 18 disease categories.
Quantifying disease prevalence
Overall and SIRE-specific disease prevalence estimates were calculated with adjustments for age and sex assigned at birth. Age was calculated at the time of the study using participant birth dates. Since we control for sex when quantifying disease prevalence, as described in the following section, only participants who reported being assigned male or female at birth were included in calculations of disease prevalence estimates. For overall and each SIRE group, unadjusted disease prevalence, p, was taken to be K cases over n total participants belonging to the group. Age and sex-adjustment was performed by weighing the unadjusted prevalence estimates of groups of participants corresponding to varying age-sex combinations using census fractions |$f$|. We define census fractions as the proportion of the total US population of an SIRE group |$g$| that falls into a particular age-sex group. Fractions were calculated from 2021 American Community Survey 1-year estimates. Adjusted prevalence values, |$p$|, were calculated from different age-sex groups as follows:
95% confidence intervals for overall and SIRE-specific prevalence estimates were calculated by adding and subtracting the product of 1.96 and each adjusted estimate’s standard error (|$p$|) to and from the adjusted prevalence estimate:
These confidence intervals are presented in the form of error bars in plots generated by the browser. Disease prevalence estimates and confidence intervals were calculated using version 1.21.6 of the NumPy [13] and version 1.3.5 of the pandas [14] packages in Python 3.
Quantifying health disparities
Racial health disparities in the “All of Us” participant body were quantified using three metrics: variance, range ratio, and range difference.
Variance was taken to be the average of the squared differences between seven SIRE-specific prevalence estimates |$p$| and average prevalence |$\bar p:$|
Range ratio was taken to be the binary logarithm of the ratio between the highest prevalence estimate observed among the seven SIRE-specific categories and the lowest prevalence estimate observed:
Range difference was taken to be the difference between the highest prevalence estimate observed among the seven SIRE-specific categories and the lowest prevalence estimate observed:
The use of both range ratios and range differences allows for the capture of racial disparities in both diseases with low and high prevalence estimates, respectively.
Interactive web browser
SIRE-specific disease prevalence estimates and health disparity variance values, calculated as described earlier, were downloaded from the “All of Us” Researcher Workbench and stored on a local web server as comma-separated values (CSV) text files. No individual-level “All of Us” participant data were downloaded or stored locally. The interactive web browser was developed using Shiny version 1.7.4, a web application framework for R [15]. The web browser layout was designed using version 0.7.2 of the shinydashboard package [16], and the plots displayed in the browser are dynamically generated by Shiny using the ggplot package version 3.3.5 [17] in R version 4.1.2. The R Shiny application runs on a local web server, using locally stored disease prevalence and disparity summary statistics and is not connected to the “All of Us” Researcher Workbench. The local web server was used to publish and host the Shiny application using NGINX. The ssl certificate for the Shiny application was provided by Let’s Encrypt.
Compliance with All of Us data use policies
The health disparities browser is fully compliant with the “All of Us” Data User Code of Conduct and the “All of Us” Data and Statistics Dissemination Policy. The web browser only presents aggregate, summary statistics derived from “All of Us” participant data, which were analyzed by registered users on the “All of Us” Researcher Workbench. It does not present any individual-level participant data or any other primary data from the “All of Us” Registered Tier. The R shiny application does not connect directly to the “All of Us” Registered Tier data or the “All of Us” Researcher Workbench, rather it runs on a local web server and presents precomputed summary statistics stored locally in CSV files. The browser does not show any results calculated from participant group counts ≤20.
Results
Participant characteristics
The “All of Us” study cohort consists of 237 997 participants (Table 1). Participants were predominantly White, assigned female at birth, and middle-aged or older. The cohort is racially and ethnically diverse; Black and Hispanic participants, in particular, are over-represented compared to their percentage of the US population. White participants make up 56.4% of the cohort compared to 58.9% of the US population, Black participants make up 19.1% of the cohort compared to 13.6% of the US population, and Hispanic participants make up 19.7% of the cohort compared to 19.1% of the US population. Female participants make up 62.88% of the cohort compared to 50.4% of the US population.
Characteristics of male and female born All of Us participants for whom EHR and SIRE data were available
| Characteristics | Count (%) |
|---|---|
| Complete cohort | 237 997 |
| Age (years) | |
| 18–29 | 16 310 (6.85) |
| 30–39 | 33 955 (14.27) |
| 40–49 | 32 885 (13.82) |
| 50–59 | 41 628 (17.49) |
| 60–69 | 52 824 (22.20) |
| 70–79 | 43 116 (18.12) |
| 80+ | 17 279 (7.26) |
| SIRE group | |
| Asian | 6308 (2.65) |
| Black | 45 466 (19.10) |
| Hispanic | 46 778 (19.65) |
| MENA | 1339 (0.56) |
| Multiple | 3748 (1.57) |
| NHPI | 252 (0.11) |
| White | 134 106 (56.35) |
| Sex | |
| Female | 148 221 (62.88) |
| Male | 89 776 (37.72) |
The landscape of racial health disparities in All of Us
We quantified racial and ethnic health disparities as the extent to which disease prevalence values differ among all seven of the “All of Us” participant SIRE categories, using two complementary metrics designed to show disparities for both high- and low-prevalence diseases (see Materials and methods section). The range difference values (left panel) show disparities for high-prevalence diseases, whereas the range ratio values (right panel) show disparities for low-prevalence diseases (Fig. 1). The conditions for which the highest range differences were observed tended to be common metabolic conditions, such as hypertension, obesity, and hyperlipidemia, or disorders related to substance abuse, such as tobacco use disorder and other substance addictions. The conditions for which the highest range ratios were observed included sickle cell anemia, which disproportionately affects Black participants, and a number of dermatological diseases that affect White participants, such as actinic keratosis and skin cancer (Table 2).
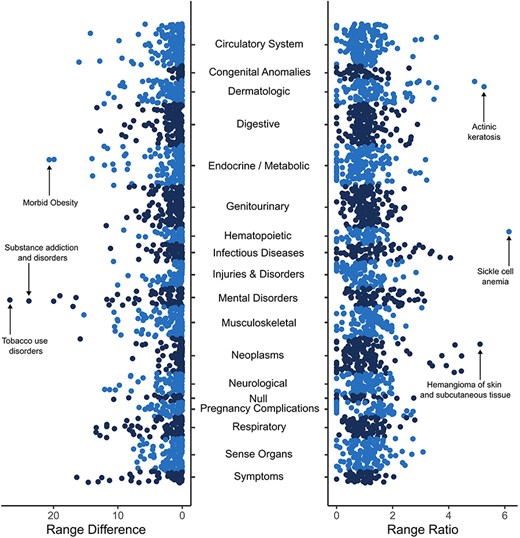
Racial and ethnic disparities in disease prevalence estimates. Overall disease prevalence disparities are quantified by prevalence range differences (left panel) and prevalence range ratios (right panel) among the seven SIRE groups studied here as described in the Materials and methods section. Each point represents a distinct disease or condition, organized by disease categories as shown on the y-axis. Higher range difference values on the x-axis correspond to high-prevalence diseases that differ among SIRE groups, and higher range ratio values on the x-axis correspond to low-prevalence diseases that differ among SIRE groups.
Top 10 diseases with the highest values for range difference and range ratio
| Disease | Prevalence (%) | Value |
|---|---|---|
| Range difference | ||
| Tobacco use disorder | 20.38 ± 0.86 | 26.78 |
| Substance addiction and disorders | 17.15 ± 0.96 | 23.82 |
| Morbid obesity | 12.92 ± 1.02 | 20.67 |
| Major depressive disorder | 30.69 ± 0.93 | 19.98 |
| Obesity | 24.75 ± 0.86 | 19.92 |
| Anxiety disorder | 32.59 ± 0.97 | 19.01 |
| Mood disorders | 23.48 ± 0.88 | 16.97 |
| Anxiety disorders | 22.94 ± 0.77 | 16.50 |
| Abdominal pain | 38.74 ± 0.92 | 16.39 |
| Essential hypertension | 36.64 ± 0.76 | 16.04 |
| Range ratio | ||
| Sickle cell anemia | 1.00 ± 0.88 | 6.15 |
| Actinic keratosis | 5.41 ± 0.12 | 5.26 |
| Hemangioma of skin and subcutaneous tissue | 3.49 ± 0.09 | 5.12 |
| Chronic dermatitis due to solar radiation | 3.90 ± 0.56 | 4.92 |
| Melanomas of skin | 1.02 ± 0.13 | 4.46 |
| Carcinoma in situ of skin | 0.91 ± 0.13 | 4.45 |
| Nevus, non-neoplastic | 3.93 ± 0.87 | 4.22 |
| Other nonepithelial cancer of skin | 2.33 ± 0.13 | 4.20 |
| Lyme disease | 0.69 ± 0.52 | 4.06 |
| Squamous cell carcinoma | 1.28 ± 0.13 | 3.91 |
We also identified conditions and diseases that showed the highest group-specific prevalence for each SIRE group. Among these diseases, we identified the five that were the most disparate across the SIRE groups, as determined by variance in prevalence estimates (Table 3).
Health disparities across SIRE categories
| Disease | Prevalence (%) | Variance |
|---|---|---|
| Asian | ||
| Abnormal glucose | 13.65 ± 0.98 | 15.88 |
| Disorders of vitreous body | 10.86 ± 1.10 | 11.89 |
| Myopia | 11.96 ± 1.09 | 11.79 |
| Astigmatism | 9.01 ± 1.15 | 7.82 |
| Impaired fasting glucose | 8.96 ± 0.93 | 7.62 |
| Black | ||
| Tobacco use disorder | 32.06 ± 0.57 | 67.08 |
| Substance addiction and disorders | 26.88 ± 0.56 | 52.87 |
| Obesity | 29.81 ± 0.48 | 37.25 |
| Asthma | 23.89 ± 0.55 | 19.63 |
| Pain in limb | 36.33 ± 0.52 | 19.41 |
| Hispanic | ||
| Abdominal pain | 43.40 ± 1.71 | 22.93 |
| Nausea and vomiting | 26.09 ± 1.69 | 18.59 |
| Hypoosmolality and/or hyponatremia | 8.91 ± 1.70 | 6.86 |
| Other complications of pregnancy, Necrotizing Enterocolitis | 8.83 ± 0.22 | 6.70 |
| Gastritis and duodenitis, Not otherwise specified | 8.34 ± 0.41 | 6.20 |
| MENA | ||
| Spondylosis without myelopathy | 19.00 ± 2.41 | 30.14 |
| Vitamin deficiency | 17.27 ± 2.67 | 23.68 |
| Hyperlipidemia | 36.01 ± 2.23 | 20.40 |
| Other disorders of synovium, tendon, and bursa | 13.59 ± 2.40 | 18.07 |
| Degeneration of intervertebral disc | 13.91 ± 2.37 | 17.43 |
| Multiple | ||
| Bipolar | 12.85 ± 1.42 | 20.69 |
| Posttraumatic stress disorder | 11.59 ± 1.38 | 15.39 |
| Mastodynia | 6.75 ± 0.57 | 5.23 |
| Attention deficit hyperactivity disorder | 6.19 ± 0.93 | 4.07 |
| Other nonmalignant breast conditions | 6.24 ± 0.53 | 3.52 |
| NHPI | ||
| Morbid obesity | 23.25 ± 4.85 | 37.19 |
| Essential hypertension | 42.86 ± 5.28 | 30.42 |
| Type 2 diabetes | 28.86 ± 4.64 | 19.82 |
| Superficial cellulitis and abscess | 17.34 ± 4.59 | 12.87 |
| Acute renal failure | 16.65 ± 4.37 | 12.38 |
| White | ||
| Major depressive disorder | 34.72 ± 0.86 | 42.18 |
| Benign neoplasm of skin | 19.66 ± 0.81 | 38.83 |
| Anxiety disorder | 38.07 ± 0.37 | 38.11 |
| Peripheral enthesopathies and allied syndromes | 20.65 ± 0.81 | 37.09 |
| Generalized anxiety disorder | 18.87 ± 0.84 | 33.85 |
Interactive web browser
We developed the US Health Disparities Browser to catalog and present the landscape of health disparities in the “All of Us” participant cohort. The browser and the disease prevalence estimate that it uses enable users to assess how prevalence for specific diseases and phecodes of interest differ across seven SIRE groups in the “All of Us”participant cohort (Fig. 2). Disease prevalence values and confidence intervals are presented as a bar plot with different bars representing different SIRE groups. Overall case and control counts and adjusted prevalence are displayed above the generated bar plots. The browser also features an interactive catalog of the 1755 diseases featured in the browser, presented in table form, which can be sorted by disease name, phecode, overall prevalence across the “All of Us” participant body, and variance across SIRE groups. Users can search the disease disparity catalog by disease name or phecode.
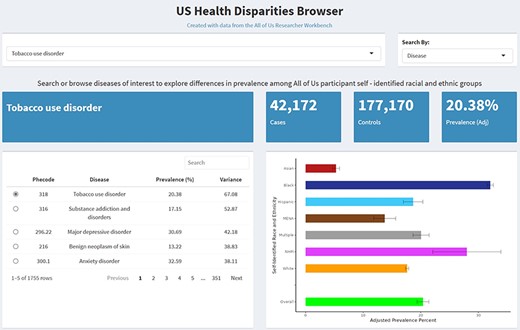
The US Health Disparities Browser. Screenshots of the browser showing basic functions and information provided upon querying a disease or phecode.
The results reported on the browser comply with the “All of Us” Data and Statistics Dissemination Policy. The browser shows summary statistics only, does not reveal individual-level participant data in any way, and does not display any participant group count ≤20. The browser is not affiliated with, nor endorsed by, the “All of Us” Research Program, the NIH, or the US Department of Health & Human Services.
Discussion
Health disparities research with the All of Us Research Program
“All of Us” has emphasized the recruitment of participants from groups that have been historically left out of biomedical research, including racial and ethnic minorities, and as a result of these efforts they have assembled one of the world’s most diverse population biobanks [7–11]. The diversity of its participants, together with rich and heterogeneous data on genetics, environmental exposures, and health outcomes, makes “All of Us” an ideal resource for the study of health disparities. Indeed, health disparities research was recently identified as a key area of synergy to stimulate collaborations between “All of Us”and NIH institutes, centers, and offices [18]. We leveraged the “All of Us” cohort and data to perform a phenome-wide analysis of prevalence differences for 1755 diseases among participant racial and ethnic groups, and the results of this study are made publicly available through the US Health Disparities Browser. We found marked disparities in disease prevalence estimates across racial and ethnic groups in the “All of Us”cohort, with the most profound disparities observed for metabolic and dermatological conditions, as well as conditions related to substance use. We hope that the online resources we provide can help to prioritize diseases and populations for subsequent studies focused on etiology and interventions.
Health disparities and stigmatizing research
“All of Us” has developed a policy on stigmatizing research, which they define as “any research proposal, project, or question that has the potential to instigate or promote marginalization of, discrimination against, or loss of status by a person or group of people” [19]. The policy emphasizes that stigma may result from the research design or findings and that it may be intentional or unintentional. Our phenome-wide analysis of disease prevalence differences between SIRE groups could be taken to stigmatize racial and ethnic groups if not considered in the context of health disparities research. In general, we do not believe that health disparities research is inherently stigmatizing. On the contrary, we believe that the study of health disparities, which starts by defining which diseases show outcome differences between population groups, is a crucial component of achieving health equity and one that should promote empathy and understanding for marginalized groups. Furthermore, it should be stressed that we rely on participants’ racial and ethnic self-identification, rather than assigning groups ourselves based on any preconceived notions of human differences. Perhaps most importantly, if findings of the kind presented here are deemed to be stigmatizing, owing simply to the fact that differences in health outcomes between populations are reported, this could have a chilling effect on health disparities research. Ignoring or intentionally obscuring health differences that adversely affect disadvantaged populations, however well-intentioned, will ultimately do more harm than good [20].
Limitations
The analyses outlined here could be limited by sampling bias, since the “All of Us” participant body is composed of volunteer participants and does include a nationally representative sample of the kind used by databases like the National Health and Nutrition Examination Survey or the American Community Survey. Furthermore, our disease prevalence estimates are based on EHR data, which may reduce their utility in drawing insight from nonchronic diseases and from populations with inadequate access to health care. Nevertheless, the results described here provide evidence for racial and ethnic health disparities in the “All of Us” participant body, consistent with what is known for the US population [21–23]. The interactive web browser that was developed alongside this study could serve as a useful resource for researchers interested in leveraging the “All of Us” platform to conduct health disparities research, since the identification of disparity diseases is a prerequisite for subsequent etiological studies. The potential of this resource is amplified by the rich genetic, environmental, and health outcome data being collected for the large and diverse “All of Us” participant cohort.
Acknowledgements
We gratefully acknowledge the participants who contributed data to the “All of Us” program, without whom this work would not have been possible. We also thank the NIH’s “All of Us” Research Program for making available the participant data that were analyzed in this study.
Conflict of interest
None declared.
Data Availability
This study used data from the All of Us Research Program’s Controlled Tier Dataset v7, available to authorized users on the Researcher Workbench (https://workbench.researchallofus.org/login).
Funding
V.L. and L.M.-R. were supported by the Division of Intramural Research of the National Institute on Minority Health and Health Disparities at the National Institutes of Health (NIH) (Award Numbers: 1ZIAMD000016 and 1ZIAMD000018). L.M.-R. was supported by the NIH Distinguished Scholars Program. J.L.S. was supported by the Intramural Research Program of the NIH, the National Library of Medicine, and the National Center for Biotechnology Information. S.S. and I.K.J. were supported by the IHRC-Georgia Tech Applied Bioinformatics Laboratory (Award Number: RF383).
