


Abstract
Following the completion of the genome sequencing and gene prediction of Mnemiopsis leidyi, a lobate ctenophore that is native to the coastal waters of the western Atlantic Ocean, we developed and implemented the Mnemiopsis Genome Project Portal (MGP Portal), a comprehensive Web-based data portal for navigating the genome sequence and gene annotations. In the years following the first release of the MGP Portal, it has become evident that the inclusion of data from significant published studies on Mnemiopsis has been critical to its adoption as the centralized resource for this emerging model organism. With this most recent update, the Portal has significantly expanded to include in situ images, temporal developmental expression profiles and single-cell expression data. Recent enhancements also include implementations of an updated BLAST interface, new graphical visualization tools and updates to gene pages that integrate all new data types.
Database URL: https://research.nhgri.nih.gov/mnemiopsis/
Introduction
Genomic sequencing of non-bilaterian animal species and their closest non-animal relatives has provided invaluable insight into the molecular innovations that have fueled the outbreak of diversity and complexity seen in the early evolution of animals. Our understanding of these critical innovations was greatly advanced by the sequencing, annotation and analysis of the genome of Mnemiopsis leidyi, a lobate ctenophore that is native to the coastal waters of the western Atlantic Ocean (1). The major finding arising from this first report of a complete, high-quality ctenophore genome sequence involved the resolution of the branching order of the non-bilaterians, supporting ctenophores as being the sister group to the rest of the extant animals, a relationship first observed by Dunn and colleagues (2) that has been supported by numerous subsequent phylogenetic analyses (3–22). In a follow-up study to the sequencing, annotation and analyses of the Mnemiopsis genome, we showed that this genome contains a surprisingly high number of human disease gene orthologs, supporting the proposition that ctenophores (and other non-bilaterian species) can serve as viable models for the study of human disease (23).
Given that there has been a growing emphasis on the development of new animal models for the study of basic biological processes in general (and human disease in particular) over the past several years (24), it is extremely important that genomic data generated using these emerging model organisms be disseminated to the research community in as accessible a fashion as possible. We established the Mnemiopsis Genome Project Portal (MGP Portal) as a way to centralize Mnemiopsis genomic data and provide a resource from which researchers can conduct reliable and informative analyses (25). The value and utility of this kind of freely available genomic resource is best-demonstrated by numerous published use-cases based on data derived from the Portal; these include the mining of Mnemiopsis gene models to inform a comprehensive phylogenetic survey of the tektin gene family (26); use of the Genome Browser and PFAM search tools to characterize horizontal gene transfers in ctenophores (27); analyzing the full Mnemiopsis genome assembly to study the maternal–zygotic transition (MZT) in ctenophores (28); interrogating Mnemiopsis-specific BLAST databases to investigate the evolution of 3′ terminal uridylyl transferases (TUTases) in animals (29); analyzing consensus gene models to identify the circadian rhythm genes Clock and ARNT in Mnemiopsis (30); and mining genomic and transcriptomic sequences to systematically investigate long non-coding RNAs (lncRNAs) across animals (31).
Data classifications of Mnemiopsis sequences and annotations accessible through the MGP Portal
| Mnemiopsis data classifications | Number of entries |
|---|---|
| BLAST sequence databases | 10 |
| ESTs | 15 752 |
| Gene models | 16 548 |
| Genome assembly (scaffolds) | 5100 |
| Genome browser tracks | 39 |
| KEGG pathways | 200 |
| Mitochondrial genome | 1 |
| Mitochondrial proteins | 11 |
| Pfam-A domains | 3213 |
| Protein models | 16 548 |
| PubMed literature | 329 |
| Single-cell expression, clusters | 55 |
| Temporal developmental expression profiles | 2535 |
| In situ hybridization images | 114 |
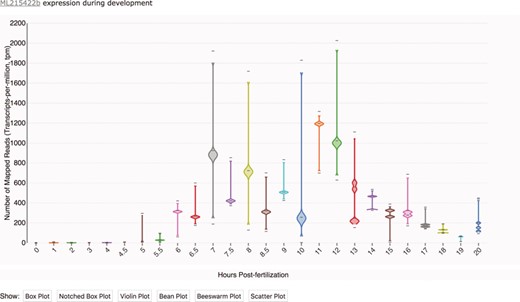
Transcriptomic data displayed as a time-course distribution plot for gene ML215422b. Time-course distribution plots can be accessed through the ‘Temporal Developmental Expression Profile’ link on the MGP Portal home page. The expression profiles can be rendered in a variety of formats by clicking on the buttons immediately below the plot. Here, the profile is visualized as a bean plot.
Since the original launch of the MGP Portal, we have expanded its scope to incorporate publicly available high-quality expression data in various contexts (Table 1). This includes temporal developmental expression profiles of whole embryos, single-cell expression data and spatial expression patterns of important developmental genes in the form of whole-mount in situ images. In addition to these new data, the latest version of the MGP Portal has incorporated a new implementation of the interactive genome browser, an updated BLAST interface and new features within its gene wiki pages. Here, we also present a navigational case study to demonstrate the types of biological discovery that are possible using the resources available on the site.
Portal updates and featured annotations
Temporal developmental expression profiles
We have updated the MGP Portal to include transcriptomic data from Mnemiopsis that were generated as part of a large-scale study examining developmental gene expression across animals (32) and by a second study that provided additional replicates and time points beyond those in the original study (Hernandez and Ryan, 2018). These resources, which were previously deposited in NCBI’s Gene Expression Omnibus (33) under GEO accessions GSE60478 and GSE111748, can be viewed in the MGP Portal as a set of time-course distribution plots. These data are expression profiles of individual Mnemiopsis leidyi embryos sampled every hour from 0–20 h post-fertilization (hpf), with additional profiles taken at half-hourly time points from 4.5 hpf through 8.5 hpf, generated from single embryos and analyzed using CEL-Seq (34).
Time-course distribution plots can be accessed by clicking on the `Temporal Developmental Expression Profiles' link in the sidebar of the Portal homepage or on individual gene pages. Temporal developmental expression profiles can be searched and visualized by entering an ML gene identifier in the search box. Distribution plots were generated using Violin Plot + Box Plot v2 (35). As illustrated in Figure 1, each profile image depicts the expression profile during embryonic development for a single Mnemiopsis gene, plotting the number of mapped reads (transcripts-per-million, tpm) from 0 to 20 hpf. The expression profile in Figure 1 is rendered as a bean plot, with options for alternative formats provided immediately below the expression profile. From here, users can navigate to a Gene Wiki page to view additional available annotations for each gene by clicking on the linked ML identifier above each plot.
Single-cell RNA sequencing
Single-cell genomic approaches provide a powerful tool for examining the transcriptional profiles of specific cell types. Sebé-Pedrós et al. (36) performed whole-organism single-cell RNA sequencing (scRNA-seq) experiments to map cell-type transcription in M. leidyi. Single-cell gene expression clusters have been mapped (37) and added to individual gene pages, and this view also includes a list of all genes that are part of a cluster. In addition, by clicking on the ‘Single-Cell Expression’ link in the sidebar of the MGP Portal homepage, single-cell clusters can be searched by specifying a specific cell type (e.g. Digestive), ML gene identifier (e.g. ML000114a) or cluster identifier (a unique cell type identifier, C1–C55, that is assigned to each transcriptionally coherent metacell cluster). The results table lists the cell type and cluster ID, along with links to all other genes found within that cluster. Users may view and download both the DNA and protein sequences for all genes in a particular single-cell cluster by clicking on the desired sequence icon (blue and green icons, respectively). Cell-type identifiers are based on designations made by Sebé-Pedrós et al. (36) which, in turn, were based on expression profiles rather than cell morphology. The exception to this are C52 (colloblast I), C53 (colloblast II) and C54 (tentacle), which were based on designations made in Babonis et al. (38).
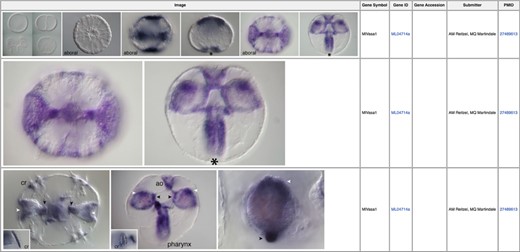
In situ images illustrating expression patterns for the germ cell marker vasa (MGP gene identifier ML04714a) during early Mnemiopsis development (39). Linked PubMed identifiers in the right-most column bring the user to the PubMed manuscript entry in which these results were originally reported.
In situ images
In situ hybridization imaging permits researchers to visualize significant localized biological processes during specific stages of development such as embryogenesis. We have integrated publicly available in situ images from Mnemiopsis into the MGP Portal. All in situ images have been integrated into corresponding gene pages (Figure 2) (39) and are also accessible by clicking on the ‘In Situ Images’ link in the sidebar of the Portal homepage. From this interface, searches can be performed either by selecting from a list or by entering a gene symbol, gene identifier, gene accession or submitter name in the search box. Clicking directly on image icons opens that image centered on a shadow box with the full figure caption below it. For queries that return more than one image, users can scroll through the images by clicking the right and left arrows. Users can also download any in situ image by clicking the down arrow when in view mode. For all in situ hybridization data, we include links to the appropriate PubMed manuscript entry from which the data was originally published.
Mnemiopsis literature searches
The new ‘Literature Search’ page was designed as a quick one-step tool to search and return all primary Mnemiopsis manuscripts from PubMed directly from the MGP Portal. Mnemiopsis papers are derived from a PubMed keyword search query (e.g.,‘ctenophora’ [MeSH Terms] OR ‘ctenophora’ [All Fields] OR ‘mnemiopsis’ [All Fields]). The resulting MEDLINE-formatted output was parsed for PubMed identifier (PMID), MeSH terms (MH), author (AU) and other terms (OT). These search terms were further mapped to Entrez Gene and gene-to-pubmed annotation files to extract gene identifiers, gene symbols and gene descriptions. Mnemiopsis papers can be accessed by clicking on the ‘Literature Search’ link of the home page left sidebar and searched by selecting or entering a gene symbol, author or keyword term into the search box. A complete list of all Mnemiopsis literature in PubMed can be retrieved by clicking the ‘View All Literature’ button. Each paper is directly linked via its PMID to the original PubMed entry.
Mnemiopsis gene wiki
One of the main features of the original implementation of the MGP Portal is the Gene Wiki, providing comprehensive annotations for the full Mnemiopsis gene complement. The Mnemiopsis Gene Wiki is accessible from the left sidebar of most Portal pages and is searchable by entering a Mnemiopsis gene identifier (e.g. ML215422b) in the appropriate search box. Each record in the Gene Wiki represents a single Mnemiopsis gene and provides the following annotations: the gene’s nucleotide and protein sequences, its coding exonic genomic coordinates, pre-computed BLAST hits from numerous organisms displaying the top hits for each protein, the top non-self BLAST hit to Mnemiopsis, a list of any Pfam-A domains in the gene’s protein product, Gene Ontology (GO) functional annotations, any similarities to human disease genes from Online Mendelian Inheritance in Man (OMIM) and a table of ortholog clusters formed by phylogenetically informed clustering methods (1, 25). This update to the gene wiki pages also includes temporal developmental expression profiles, single-cell expression data and in situ images where available for each gene.
![Mnemiopsis BLAST input options with sample output. (A) A user can paste one or more query sequences or drag a file containing query sequence(s) in FASTA format into the query search box. SequenceServer will automatically detect the sequence type (e.g. protein) and limit menu selections accordingly. Available nucleotide sequence databases include the Mnemiopsis genomic scaffolds (Main scaffolds), consensus gene prediction models (Gene Models 2.2), and Unfiltered Gene Models (unincorporated predictions), all publicly available Mnemiopsis ESTs and mRNAs from GenBank (Public ESTs), the Mnemiopsis mitochondrial genome, Cufflinks-assembled RNA-seq transcripts and Trinity-assembled RNA-seq transcripts. Available protein sequence databases include the translated proteins derived from the Mnemiopsis consensus gene prediction models (Protein Models 2.2), the unincorporated Mnemiopsis proteins derived from unincorporated gene prediction models (Unfiltered Protein Models) and the computationally derived Mnemiopsis mitochondrial proteins. SequenceServer will select the appropriate BLAST program (e.g. BLASTP) based on the input query and selected target database sequence types. Advanced BLAST parameters can be entered into the box at the bottom of the page in standard BLAST command line format. Clicking the ‘BLASTP’ button launches the BLAST search. (B) BLASTP results showing sequence alignments and scores, beginning with a graphical overview of each high-scoring segment pair (HSP). The identity of each HSP in this graphical overview can be seen by moving the mouse over each line in the display. A table containing summary results for each HSP can be found in the table below. Each of the ML sequences identified during this BLASTP search is hyperlinked, and clicking on those links takes the user directly to the pairwise alignment. The BLAST output results also feature customized color-coded boxes that link directly to relevant internal annotation resources, including the Mnemiopsis Genome Browser [B], the wiki-based Mnemiopsis Gene Pages [G], the Scaffold Fetch Tool [S], Unfiltered Gene Models [U], Cufflinks-assembled transcripts [C], Trinity-assembled transcripts [T] and Mitochondrial genome or Public ESTs [N].](https://oup.silverchair-cdn.com/oup/backfile/Content_public/Journal/database/2020/10.1093_database_baaa029/1/m_baaa029f3.jpeg?Expires=1717688706&Signature=ChNVCPsTh3g2vV3NnJlqtXtLh-TJ8xjG2JBivLofEp0K4qYpJ6~0thtp2eUzn8prUv60MpluqnVCEHTEYKcKt6chzJa-j4vYmn93D966oPnsOelIGzOl3H~4oZrBgFJJAUX01x3ePMxAXHsa0xH7XsNpKpAi2ip1-2hDeK-XIA4ZThSIxOARbHJf1rAcu3PuatouEebCS73DuQuSRbabQMruscvl1s71Rnxg2EcUYiNPd7OQ94AdcF47BkCEqhPdWX1lbfCykl37-C1H0d17FdwHtaaqzcgMwC0U8DMhzXz4~uLaqWXXZ~shsux~LHB3RtiH644xhRTsEA65wiJ5fg__&Key-Pair-Id=APKAIE5G5CRDK6RD3PGA)
Mnemiopsis BLAST input options with sample output. (A) A user can paste one or more query sequences or drag a file containing query sequence(s) in FASTA format into the query search box. SequenceServer will automatically detect the sequence type (e.g. protein) and limit menu selections accordingly. Available nucleotide sequence databases include the Mnemiopsis genomic scaffolds (Main scaffolds), consensus gene prediction models (Gene Models 2.2), and Unfiltered Gene Models (unincorporated predictions), all publicly available Mnemiopsis ESTs and mRNAs from GenBank (Public ESTs), the Mnemiopsis mitochondrial genome, Cufflinks-assembled RNA-seq transcripts and Trinity-assembled RNA-seq transcripts. Available protein sequence databases include the translated proteins derived from the Mnemiopsis consensus gene prediction models (Protein Models 2.2), the unincorporated Mnemiopsis proteins derived from unincorporated gene prediction models (Unfiltered Protein Models) and the computationally derived Mnemiopsis mitochondrial proteins. SequenceServer will select the appropriate BLAST program (e.g. BLASTP) based on the input query and selected target database sequence types. Advanced BLAST parameters can be entered into the box at the bottom of the page in standard BLAST command line format. Clicking the ‘BLASTP’ button launches the BLAST search. (B) BLASTP results showing sequence alignments and scores, beginning with a graphical overview of each high-scoring segment pair (HSP). The identity of each HSP in this graphical overview can be seen by moving the mouse over each line in the display. A table containing summary results for each HSP can be found in the table below. Each of the ML sequences identified during this BLASTP search is hyperlinked, and clicking on those links takes the user directly to the pairwise alignment. The BLAST output results also feature customized color-coded boxes that link directly to relevant internal annotation resources, including the Mnemiopsis Genome Browser [B], the wiki-based Mnemiopsis Gene Pages [G], the Scaffold Fetch Tool [S], Unfiltered Gene Models [U], Cufflinks-assembled transcripts [C], Trinity-assembled transcripts [T] and Mitochondrial genome or Public ESTs [N].
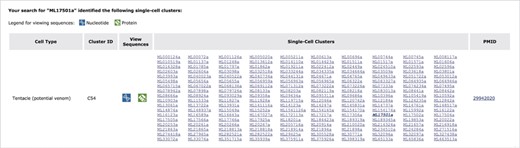
An exploration of cell-type specificity for ML17501a using the Mnemiopsis ‘Single-Cell Expression’ tool identifies a single-cell cluster in cell type ‘Tentacle (potential venom)’ containing three of the four collagen IV genes (ML17501a, ML17502a and ML17504a). Clicking on a gene identifier link in the matrix takes the user directly to that gene entry in the Mnemiopsis Gene Wiki. Here, the original gene queried (ML17501a) is shown in bold italic type. Users can also view and download FASTA-formatted DNA (blue) and protein (green) sequences for all genes in a cluster by clicking on the desired sequence icon in the View Sequences column.
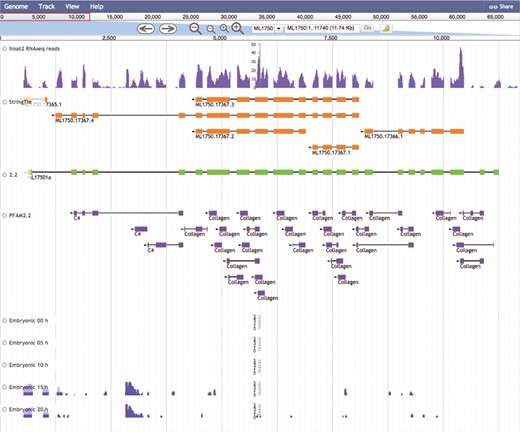
The Mnemiopsis Genome Browser displaying genomic scaffold ML1750. Zooming in on ML17501a and displaying the RNA-seq data from the Embryonic Developmental Time series track at 5-h increments (0, 5, 10, 15 and 20) indicates heightened expression at Hours 15 and 20 relative to earlier developmental time points. Note that the expression scales centered on the embryonic time series tracks are logarithmic. Expression values greater than 100 are truncated and colored red while all other expression values remain blue. The first two tracks above represent RNA-seq data (SRR1971491) derived from Mnemiopsis embryos that were aligned using HISAT2 and assembled into transcripts using StringTie. Also represented is the PFAM2.2 track displaying many collagen protein domains scattered across the entire length of the ML17501a gene.
Mnemiopsis BLAST tool
Another feature from the original MGP Portal release is a customized stand-alone Web-based BLAST interface for performing nucleotide and amino acid sequence similarity searches (Figure 3A and B). We have updated the Mnemiopsis BLAST interface to use SequenceServer (v. 1.0.11) (40). This new open-source BLAST tool provides a vastly improved visual interface for users while also allowing for streamlined updates and configuration from the developer’s perspective. All features from the previous BLAST implementation continue to be available, including access to the customary set of BLAST programs and to several curated Mnemiopsis nucleotide and protein databases, as previously described (25).
Genome browser
The predominant visualization tool within the MGP Portal is the customized genome browser, providing a graphical interface for navigating and viewing Mnemiopsis genome data and annotations. We have added several new annotation tracks to the most recent JBrowse implementation (v. 1.16.1) (41) including aligned reads of Mnemiopsis RNA-seq data from temporal developmental gene expression studies (GSE60478 and GSE111748; 32) plotted as histogram tracks with each track representing a series of captured time points (e.g. ‘Embryonic 00-20 h’). We have also added a track that includes RNA-seq reads (SRR1971491) derived from Mnemiopsis embryos and aligned using HISAT2 (42) displayed as histogram plots. These HISAT2-aligned RNA-seq reads were then assembled into transcripts using StringTie (43) and implemented as another JBrowse track. Genome Browser tracks are described in the ‘Track Descriptions’ link above the left sidebar on the JBrowse homepage. Further JBrowse display, organization, navigation and search options are as previously described (25).
MGP Portal utility: a case study
Here, we provide a case study involving the COL4A5 gene that highlights some of the new additions to the MGP Portal. To search for the presence of COL4A5 in Mnemiopsis, a user can query the MGP Portal BLAST tool using the sequence of the human COL4A5 protein (NP_000486.1) and run BLASTP against the Mnemiopsis Protein Models (2.2) sequences. The BLASTP results indicate several high-scoring full-length candidate Mnemiopsis (ML) proteins with low BLASTP E-values, yet there is no definitive identification of a putative Mnemiopsis COL4A5 ortholog.
A subsequent query of the Mnemiopsis Literature Search tool for ‘collagen’ returns a paper exploring the evolution of collagen IV and the basement membrane of animal tissues (44). Its findings reveals multiple duplications of collagen IV genes in Mnemiopsis; these genes have been separated into two groups, with all of the genes comprising one of these groups being located on the same genomic scaffold. Returning to the BLASTP results described above, one gene (ML17501a) from this group of collagen IV genes (ML17501a, ML17502a, ML17503a and ML17504a) is listed within the top four most significant BLASTP hits (specifically, the fourth hit listed in Figure 3B).
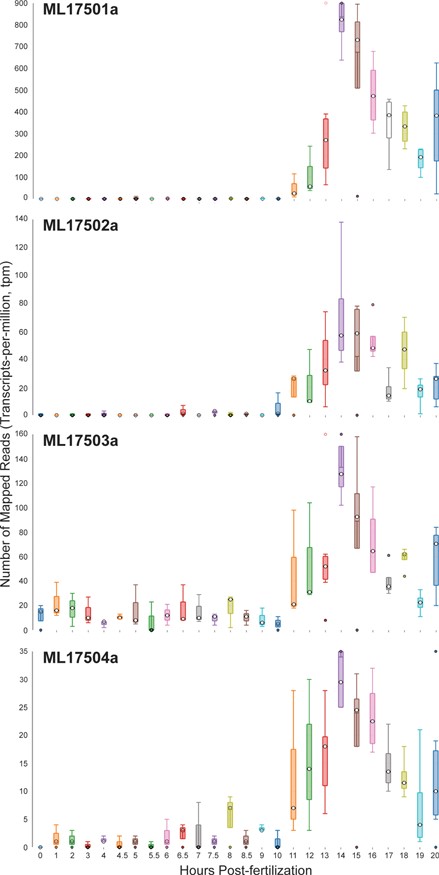
Time-course distribution plots for each of the four Mnemiopsis Group 1 collagen IV genes (ML17501a, ML17502a, ML17503a and ML17504a) generated by searching the gene identifiers on the ‘Temporal Developmental Expression Profiles’ page. Each profile image depicts the gene expression during embryonic development for a single Mnemiopsis gene plotting the number of mapped reads (transcripts-per-million, tpm) from 0 to 20 hpf. Temporal developmental profiles show expression at specific and consistent times across the collagen IV gene cluster with a single-mode curve starting at Hour 11, peaking at Hour 14, and steadily decreasing down through Hour 20. This expression pattern is consistent with the embryonic developmental stage for tentacle growth in Mnemiopsis leidyi.
An exploration of cell-type specificity for ML17501a using the Mnemiopsis single-cell expression tool identifies a single-cell cluster identified as tentacle cells for three out of these four collagen IV genes (ML17501a, ML17502a and ML17504a; Figure 4). Clicking on the ML17501a gene link in the single-cell cluster section of the results table (shown in bold italic type in Figure 4) directs the user to the entry for this gene in the Gene Wiki section of the site. To further explore the gene annotations shared among this gene cluster, the user would click on the ‘View Gene in Genome Browser’ link at the top of the Gene Wiki entry for ML17501a, which then generates the display shown in Figure 5. By zooming out using the controls at the top of the page, the entire length of the scaffold (ML1750) can be visualized, showing the order and orientation of all four neighboring genes of this collagen IV group. Selecting the PFAM2.2 track on the left sidebar generates a display indicating numerous collagen protein domains found in all four genes. Relevant details for these domains (e.g. Pfam domain symbol, E-value, genomic coordinates and sequence) can be viewed by clicking on any of the linked Pfam domains.
Zooming back in on ML17501a and selecting the RNA-seq data from the Embryonic Developmental Time series track at five-hour increments (0, 5, 10, 15 and 20 h) displays elevated expression levels at both 15 and 20 h relative to earlier developmental time points. A closer look at the developmental profiles is available from time-course distribution plots for each of these four genes by performing a search using the four collagen IV gene identifiers listed above through the ‘Temporal Developmental Expression Profiles’ page of the MGP Portal. The resulting temporal developmental profiles show expression at specific and consistent times across the collagen IV gene cluster with a single-mode curve starting at Hour 11, peaking at Hour 14 and steadily decreasing down to Hour 20 (Figure 6). This expression pattern is consistent with the embryonic developmental stage for tentacle growth in Mnemiopsis leidyi (45). This example demonstrates many aspects of the overall functionality of the MGP Portal, focusing on the power of taking a comparative genomics perspective in analyzing a gene family of interest and in advancing biological discovery.
Conclusions
We have developed the Mnemiopsis Genome Portal to meet the needs of researchers studying the biology and natural history of early branching non-bilaterian species, and the structure and content of the MGP Portal can serve as a model that can easily be adopted by others working on questions in the areas of organismal biology and comparative genomics. We will continue to integrate new data types as they come on line and improve data interfaces as new visualization tools are published. We invite and appreciate any and all feedback from the community regarding the content and features found within the Portal; current contact information can be found on the site’s About page.
Acknowledgements
We would like to thank Edward Cayia for searching and extracting in situ images from the published Mnemiopsis literature. We would also like to thank Warren Francis for his helpful technical recommendations regarding JBrowse track settings and Julia Fekecs for her assistance with the figures. The authors are grateful to Tyra Wolfsberg for her guidance and review of the MGP Portal update.
Funding
Intramural Research Program of the National Human Genome Research Institute; National Institutes of Health (ZIA HG000140 to A.D.B.); National Science Foundation (Grant 1542597 to J.F.R.).
Conflict of interest
None declared.
References
