


Abstract
More accurate and more complete predictions of cis-regulatory modules (CRMs) and constituent transcription factor (TF) binding sites (TFBSs) in genomes can facilitate characterizing functions of regulatory sequences. Here, we developed a database predicted cis-regulatory modules (PCRMS) (https://cci-bioinfo.uncc.edu) that stores highly accurate and unprecedentedly complete maps of predicted CRMs and TFBSs in the human and mouse genomes. The web interface allows the user to browse CRMs and TFBSs in an organism, find the closest CRMs to a gene, search CRMs around a gene and find all TFBSs of a TF. PCRMS can be a useful resource for the research community to characterize regulatory genomes.
Database URL: https://cci-bioinfo.uncc.edu/
Introduction
Cis-regulatory modules (CRMs), such as enhancers, promoters, silencers and insulators, are composed of clusters of short DNA sequences where transcription factors (TFs) can bind to regulate the expression of target genes in many biological processes (1). Recent studies have showed that the vast majority of complex trait-associated single nucleotide variants (SNVs) are located in noncoding sequences (NCSs) and often disrupt TF binding sites (TFBSs) in CRMs (2, 3). Variation of CRMs also plays a crucial role in divergence in closely related species (4–7). In principle, variation in TFBSs in a CRM could affect the affinity of cognate TFs, resulting in changes in chromatin modifications and target gene expression in specific cell types in tissues and ultimately leading to diversity of complex traits, including susceptibility to common complex diseases (8–14). Therefore, more accurate and more complete categorization of CRMs and constituent TFBSs in the human and important model organisms’ genomes can greatly facilitate characterizing functions of regulatory sequences and their roles in many important biological processes including disease and evolution.
Recently, a plethora of next-generation sequencing (NGS)-based technologies have been developed to characterize different features of CRMs at a genome scale, such as chromatin immunoprecipitation followed by sequencing (ChIP-seq) (15) to locate TFs binding or histone modifications, and DNase I hypersensitive sites sequencing (DNase-seq) (16), assay for transposase-accessible chromatin using sequencing (ATAC-seq) (17), formaldehyde-assisted isolation of regulatory elements sequencing (FAIRE-seq) (18) and micrococcal nuclease digestion with deep sequencing (MNase-seq) (19) to identify the chromatin accessibility. Consequently, an exponentially increased number of datasets have been generated using these technologies by consortia such as ENCODE (20, 21), Epigenomics Roadmap (22, 23) and Genotype-Tissue Expression (GTEx) (24). Based on different data types that capture different features of CRMs, many computational strategies have been developed to predict CRMs. For instances based on TF ChIP-seq data, methods such as SpaMo (25), CPModule (26), COPS (27) and INSECT (28) have been developed to identify regions of TF binding as potential CRMs. Based on histone modification marks and chromatin accessibility data, hidden Markov models (29, 30) and dynamics Bayesian models (31) have been developed to predict CRMs and their functional states in different cell types. Based on bidirectionally transcribed pairs of capped RNAs or enhancer RNA (eRNA), the FANTOM 5 project identified active enhancers in various human and mouse tissues (32). By integrating multiple tracks of epigenetics marks, TF binding, as well as predicted and experimentally validated enhancers, several groups have developed CRM/enhancer databases, such as dbSUPER (33), SEdb (34), DENdb (35), EPDnew promoters (36), UCNEbase (37), CraniofacialAtlas (38), GeneHancer (39), HACER (40), RAEdb (41), HEDD (42), DiseaseEnhancer (43), SEA (44), EnhancerAtlas (45) and SCREEN (46). However, these databases only cover a small portion of enhancers/CRMs encoded in the genomes, and some may have a high false positive rate (FDR) (47). For instance, even the most currently updated SCREEN database that stores candidate cis-regulatory elements (cCREs) predicted by the ENCODE phase 3 consortium contains only 926 535 and 339 815 cCREs in the human and mouse genomes, with a mean length of 273bp and 272bp, respectively (46), which is much shorter than the mean length (∼2000bp) of known human and mouse CRMs in the VISTA database (48), indicating that cCREs in both the human and mouse genomes might be underpredicted for both their lengths and numbers. Moreover, none of these databases provide de novo predicted TFBSs in enhancers/CRMs, which are critical to understand the mechanisms of transcriptional regulation, and to pinpoint causal variants of phenotype diversity and disease risks.
Using a highly efficient CRM and TFBS prediction pipeline dePCRM2 that we developed recently (47), we have predicted CRMs and constituent TFBSs in the human (Homo sapiens) and mouse (Mus musculus) genomes using a large number of TF ChIP-seq datasets in the organisms. Comparative analysis indicates that our predictions are substantially more accurate and more complete than those in existing databases (47). To facilitate the research community to use these predictions for various purposes, we constructed an online database PCRMS The database currently contains 1 404 973 and 920 068 CRM candidates (CRMCs) and 90 671 016 and 104 251 155 TFBSs for 201 and 210 unique motif (UM) families in the human and mouse genomes, respectively. To our best knowledge, these represent the most complete collections of accurately predicted CRMs and constituent TFBSs in the human and mouse genomes. The web interface to PCRMS allows a quick search, browse and visualization of the contents of the database, and provides three functional analysis modules. Using these modules, a user can find the closest CRMs to a gene; search CRMs that are located in a specified region around a gene; and search TFBSs in CRMs for a given TF. The interface also provides copy, export and download functions of selected CRMs or all the predicted CRMs in BED format. We hope that PCRMS will facilitate the research community’s efforts to characterize the regulatory genomes in important organisms.
Materials and methods
Datasets
We downloaded (6/1/2019) 6092 TF ChIP-seq datasets for 779 TFs in 468 cells/tissues/organs of humans, and 4786 TF ChIP-seq datasets for 501 TFs in 162 cells/tissues/organs of mice from the CISTROME database (49). After filtering out called binding peaks with low quality, for each left peak, we extracted 1000bp genome sequence centring on the middle of the binding peaks. As most called binding peaks have a length shorter than 1000bp (47), we extended most of them. We have shown earlier that such extension could greatly increase the power of the datasets without including much noise (47, 50).
Prediction of CRMs and constituent TFBSs
Comparison of the contents of the three databases
| Databases | Species | CRMCs | TFBSs | |||
|---|---|---|---|---|---|---|
| Mean length (bp) | Number | Coverage of genome (%) | Number | Coverage of genome (%) | ||
| PCRMS | H. sapiens | 981 | 1 404 973 | 44.03 | 90 671 016 | 16.71 |
| M. musculus | 1493 | 920 068 | 50.39 | 104 251 155 | 20.34 | |
| GeneHancer | H. sapiens | 1489 | 394 086 | 18.99 | X | X |
| M. musculus | X | X | X | X | X | |
| SCREEN | H. sapiens | 273 | 926 535 | 8.2 | X | X |
| M. musculus | 272 | 339 815 | 3.39 | X | X | |
Technical implementation
The current version of PCRMS (v2) was developed using MySQL 5.7.17 (http://www.mysql.com) and it runs on a Linux-based Apache2 server (http://www.apache.org). PHP 7.4 (http://www.php.net) scripts were used for back-end processing. The interactive interface and responsive features were implemented using Bootstrap 4 (https://getbootstrap.com/), JQuery (http://jquery.com) and dataTables (https://datatables.net/). NCBI sequence viewer 3.38.0 (https://www.ncbi.nlm.nih.gov/projects/sviewer/) was used for visualization.
Results and discussion
Predicted CRMs and constituent TFBSs in the human and mouse genomes
Applying dePCRM2 to the TF ChIP-seq datasets available to us (6/1/2019) in each organism, we predicted 1 404 973 and 920 068 CRMCs in the human (47) and mouse genomes, comprising 44.03% and 50.39% of their genomes, respectively. These CRMCs contain 90 671 016 and 104 251 155 TFBSs, comprising 16.71% and 20.34% of the human and mouse genomes, respectively. We compared the numbers and lengths of our CRMCs with those of cCREs in the SCREEN database (46) and those of enhancers in the GeneHancer database (39). cCREs were predicted based on overlaps among hundreds or thousands of DNase-seq, ATAC-seq and histone marks ChIP-seq datasets in various cell/tissue types in an organism (46). Enhancers in GeneHancer were predicted by combing nine sets of earlier predicted and experimentally determined human CRMs using a voting schema (39). As shown in Table 1, the numbers of our predicted CRMCs are much larger than those of cCREs and that of GeneHancer enhancers. Our predicted CRMCs also comprise much larger proportions of the genomes than do those in CREEN or GeneHancer (Table 1). We attribute to two reasons the larger numbers and higher genome coverages of our predicted CRMCs. First, the types of input data used by the three methods were different, which might capture different features of CRMs, thus have different capabilities of predicting CRMs. Specifically, the input data for predicting cCREs were DNase-seq, ATAC-seq and histone marks ChIP-seq data, those for predicting GeneHancer enhancers were earlier predicted and experimentally determined CRM sets by different groups, and those for predicting CRMCs were TF ChIP-seq data. Second, the number of predicted cCREs was limited by the number of called DNase I hypersensitive sites, transposase-accessible sites and epigenetic mark peaks, while the number of GeneHancer enhancers was constrained by the sizes of earlier predicted and experimentally determined enhancer sets. In contrast, by appropriately extending the originally called short TF binding peaks, we could greatly increase the power of available TF ChIP-seq data as we demonstrated earlier (47), since binding sites of co-operative TFs tend to be closely located on a genome segment to form a CRM (1), while a called short binding peak to which the ChIP-ed TF bind can be only a part of a longer CRM. For instance, the extended binding peaks (1000bp) in the 6079 human ChIP-seq datasets cover 77.47% of the mappable genome, and the extended parts of the peaks contribute to almost half (47.10%) of the coverage (47). dePCRM2 predicts 56.84% of the covered genome to be CRMC positions, and 42.13% of them are predicted solely based on the extended parts of originally called binding peaks (47). Importantly, we have shown that CRMC positions predicted by the extended parts of originally called binding peaks are under similarly strong evolutionary constraints as those predicted by the originally called binding peaks, thus, are likely true CRMC positions (47). On the other hand, due to the noisy nature of ChIP-seq data (51–53), 37.82% of genome positions covered by originally called binding peaks are not predicted to be CRMCs, and they are largely selectively neutral (47).
The lengths of our predicted CRMCs in the human (Figure 1A) and mouse (Figure 1B) genomes have similar distributions, ranging from a few hundred bp to a few thousand bp with a mean length of 981bp and 1,439bp, respectively, which are shorter than those of known human (2049bp) and mouse (2432bp) enhancers in the VISTA database (48), indicating that a portion of our CRMCs are only components of longer CRMs as we argued earlier (47). In contrast, the lengths of cCREs in the human and mouse genomes are almost uniform with a mean length of 273bp and 272bp, respectively (46) (Table 1), while the lengths of GeneHancer enhancers show a periodic pattern (47) with a mean length of 1489bp. Such erratic lengths of cCREs and GeneHancer enhancers are likely artifacts of the underlying algorithms as we argued earlier (47). On the other hand, as we pointed out earlier (47), accurate prediction of the lengths of CRMs is a highly challenge task, because a truncated enhancer can still be functional (1), and a super-enhancer may contain multiple discrete short enhancers (54). Thus, the length of a CRM depends on how it is defined. dePCRM2 predicts a CRMC as a cluster of TFBSs with the distance between any two adjacent TFBSs being short than 300bp (Methods and (47)). While cCREs might be shorter discrete units of longer CRMs, we estimated a FDR of 23.12% for the human cCREs positions based on their largely neutrally evolutionary behaviors (47). GeneHancer enhancers have a mean length of 1,489bp, which is shorter than that of known human enhancers (2049bp) in the VISTA database (48), we estimated a FDR of 29.28% for the genome positions of the GeneHancer enhancers based on their largely neutrally evolutionary behaviors (47). We have shown that our predicted CRMCs and TFBSs positions in the human genome are highly accurate based on validations using multiple independent data (47), and the same is true for the predicted CRMCs and TFBSs in the mouse genome (manuscript in preparation, P.N. and Z.S).
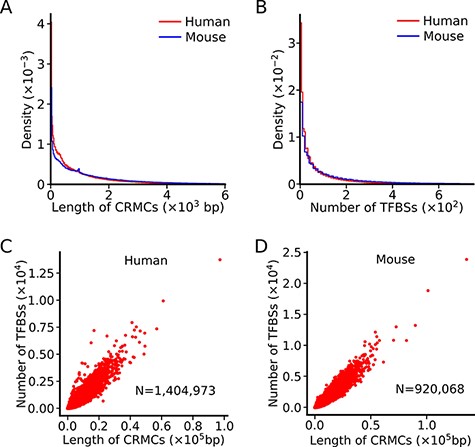
Summary of the lengths of CRMCs and the numbers of TFBSs in a CRMC in the human and mouse genomes. A. Distributions of the lengths of CRMCs in the human and mouse genomes. B. Distributions of the number of TFBSs in a CRMC in the human and mouse genomes. C. Scatter plot of the number of TFBSs in a CRMC vs its length in the human genome. D. Scatter plot of the number of TFBSs in a CRMC vs its length in the mouse genome.
The number of TFBSs in a CRMC in either the human genome or the mouse genome varies widely, ranging from a few to a few hundreds, with a mean/median number of 90/34 and 183/67, respectively (Figure 1B). Interestingly, the number of TFBSs in a CRMCs is largely linearly related to the length of the CRMC in both the human (Figure 1C) and the mouse (Figure 1D) genomes, indicating that the density of TFBSs is largely the same in the most of the CRMCs. In contrast, no information of de novo predicted TFBSs in cCREs or enhancers is available in the SCREEN or GeneHancer databases (Table 1).
To evaluate the significance of the CRMCs, dePCRM2 computes a P-value for each predicted CRMCs based on its |${{\rm{S}}_{{\rm{CRM}}}}$|. We have shown earlier that the longer a CRMC, the higher its |${{\rm{S}}_{{\rm{CRM}}}}$| score, the smaller its P-value, and the stronger evolutionary constraint it is subject to (47). Therefore, both the |${{\rm{S}}_{{\rm{CRM}}}}$| score and its associated P-value capture essential features of a true CRM. This result also justifies our assumption that a genome segment containing closely located putative TFBSs is more likely a CRM than a segment without such sequence patterns. It is based on this assumption that dePCRM2 predicts CRMs The assumption is clearly in agreement with the well-known notion that a functional genome segment such as a CRM must contain certain sequence patterns (i.e, clusters of TFBSs) that are unlikely to occur by chance, and that the longer the patterns, the less likely they occur by chance.
However, as dePCRM2 predicts CRMCs based on the predicted TFBSs in the genome, false positive and false negative predictions of TFBSs would result in false positive, false negative and incomplete predictions of CRMs. We estimated the FDR of our motif-finder ProSampler used in the dePCRM2 pipeline to be about 8% (50). Thus, we designed dePCRM2 to further filter out potentially false positive motifs returned by ProSampler in the extended binding peaks in a dataset based on their cooccurring patterns (see Method and (47)). We estimated the FDR of the predicted CRMC positions to be about 0.05%, thus, FDR for TFBSs are likely further reduced (47). However, as we indicated earlier (47), due to the limitation of the available TF ChIP-seq datasets, our predicted TFBSs are still incomplete, and a proportion of our predicted CRMCs might be only components of long CRMs whose full prediction depends on more data available in the future. Nonetheless, the short CRMC components can be effectively filtered out using a higher |${{\rm{S}}_{{\rm{CRM}}}}$| score cutoff or a lower P-value cutoff (47). To assist the users who might be interested in CRMCs with different lengths, statistical significance or with different evolutionary constraints, in addition to making the entire sets of predicted CRMs available for bulk downloading, we provide four options of P-value cutoffs (P-value <0.05, 0.01, |$5 \times {10^{ - 6}}$| and |$1 \times {10^{ - 6}})$| to query the database. Table 2 summarizes the predicted CRMs using these P-value cutoffs; they are subsets of the CRMCs with different length distributions and conservation levels (47). Clearly, the smaller a P-value cutoff, the longer the predicted CRMs.
Summary of the predicted CRMs at different P-values in the human and mouse genomes
| Species | P-value | CRMs | TFBSs | |||
|---|---|---|---|---|---|---|
| Mean length (bp) | Number | Coverage of genome (%) | Number | Coverage of genome (%) | ||
| H. sapiens | 0.05 | 1162 | 1 155 151 | 43.47 | 89 948 206 | 16.54 |
| 0.01 | 1292 | 1 020 679 | 42.72 | 88 912 654 | 16.32 | |
| 5.00E-06 | 2292 | 428 628 | 31.81 | 71 478 114 | 12.88 | |
| 1.00E-06 | 2624 | 327 396 | 27.82 | 64 136 635 | 11.47 | |
| M. musculus | 0.05 | 1749 | 777 409 | 49.9 | 103 718 473 | 20.21 |
| 0.01 | 1944 | 688 033 | 49.06 | 102 730 265 | 19.99 | |
| 5.00E-06 | 3182 | 338 635 | 39.53 | 88 579 892 | 16.96 | |
| 1.00E-06 | 3780 | 250 606 | 34.75 | 80 002 349 | 15.2 | |
Web interface to the database
We provide a user-friendly web interface to the PCRMS database for quickly inquiring and browsing predicted CRMs and TFBSs at different statistically significant levels in each organism as well as three functional analysis modules. Using these modules, the user can (i) search the closest CRM to a given gene, (ii) search all CRMs in the upstream and/or downstream regions of a gene of interest and (iii) search the TFBSs of a TF on one or more chromosomes in an organism (Figure 2).
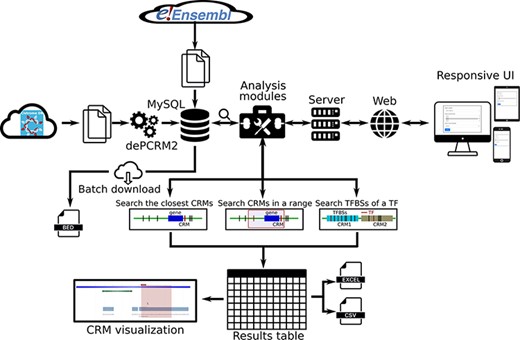
Overview of data integration and analysis modules and features of the PCRMS database.
Browse of database contents
We provide a Browse function by which the user can browse all CRMs predicted at a selected P-value cutoff on one or multiple selected chromosomes in a selected organism and inspect each CRMs and constituent TFBSs in detail. The user starts in the search form (Figure 3A) by selecting an organism (e.g. H. sapiens), one or more chromosomes (e.g. chrX) and a P-value cutoff (e.g. 1E-06). The search returns all the predicted CRMs (n = 8762) on the chromosome (chrX) of the organism (H. sapiens) in the interactive CRM list table (Figure 3B). Clicking on a CRM of interest, e.g. the first CRM hse1000017 in the table pops up the CRM information table (Figure 3C), where some parameter of the CRM are shown in the left panel and the locus of the CRM is displayed in the NCBI sequence viewer (shadowed rectangle) in the right panel, enabling detailed inspections of the genomic context of the CRM, including its neighboring genes and other annotations using the zooming and the translation functions of the viewer. For instance, the viewer reveals that hse1000017 is located in the second through the fifth introns, and spans the third through fifth exons, of the BCOR gene that codes for a corepressor of a transcription repressor BCL6. Both BCOR and BCL6 are involved in B lymphocytes differentiation (55, 56). Interestingly, hse1000017 overlaps two regulatory sequences annotated as ‘enhancer’ and ‘transcriptional cis-regulation’, while many ClinVar variants are located in hse1000017 (Figure 3C). Finally, clicking on the CRM ID (e.g. hse1000017) in the right panel of the CRM information table (Figure 3C) displays the CRM’s 5094 constituent TFBSs in the interactive TFBS table (Figure 3D), which includes the coordinates of the TFBSs, their UM IDs, binding scores, UM logos and matched known motifs. The vast majority of these TFBSs match those of known TF families (Figure 3D).
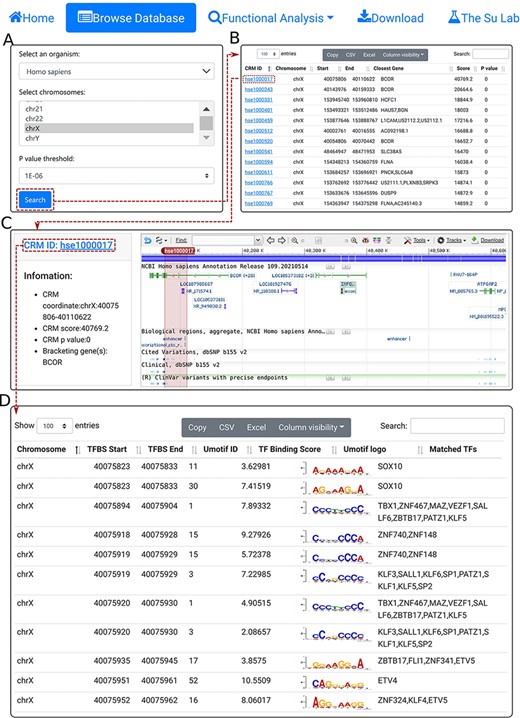
The browse functions. A. In the search form, the use selects an organism (e.g. H. sapiens), one or more chromosomes (e.g. chrX) and a P-value cutoff (e.g. 1E-06). B. The searching results are displayed in the CRM list table. Shown is a snapshot of the resulting CRM list table containing 8762 predicted CRMs on chrX of H. sapiens. The first CRM hse1000017 in the list table is selected for further visualization. C. In the CRM information table, some parameters of the selected CRM hse1000017 is shown in the right panel, and the locus is displayed in the NCBI sequence viewer for further inspection. Clicking on ‘hse1000017’ in the right panel of the CRM information table displays its constituent TFBSs. D. A snapshot of the TFBS table of hse1000017 containing its 5094 constituent TFBSs.
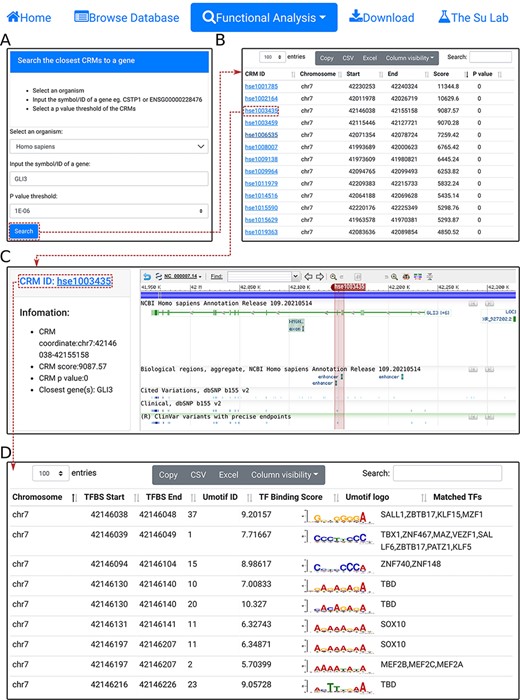
Search the closest CRM(s) to a gene. A. In the search form, the use selects an organism (e.g. H. sapiens) and a P-value cutoff (e.g. 1E-06), and inputs a gene name (e.g. GL13). B. The searching results are displayed in the CRM list table. Shown is a snapshot of the returned CRM list table containing 53 predicted CRMs. The third CRM hse1003435 in the list table is selected for further inspection. C. In the CRM information table, some parameters of the selected CRM hse10003435 is displayed in the right panel, and the locus is displayed in the NCBI sequence viewer for further inspections. Clicking on ‘hse1003435’ in the right panel of the CRM information table displays its constituent TFBSs. D. A snapshot of the TFBS table of hse1003435 containing its 988 constituent TFBSs.
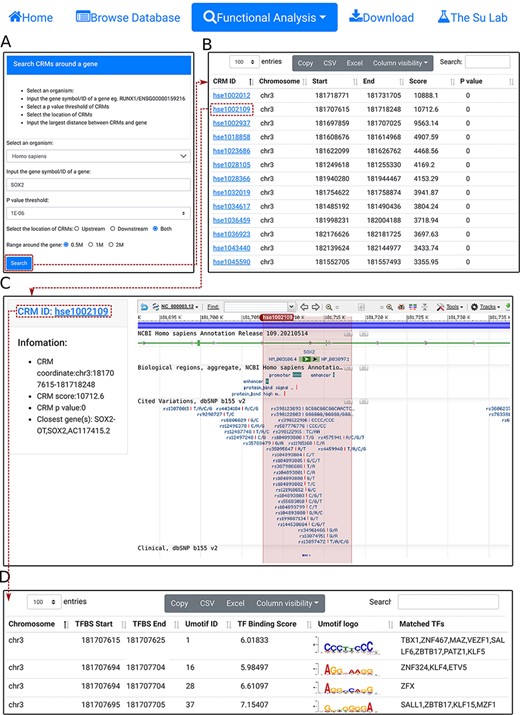
Search CRM(s) in a region around a gene. A. In the search form, the use selects an organism (e.g. H. sapiens) and a P-value cutoff (e.g. 1E-06), and inputs a gene name (e.g.SOX2). B. The searching results are displayed in the CRM list table. Shown is a snapshot of the 102 returned CRMs in the table. The second CRM hse1002109 in the list table is selected for further inspection. C. In the CRM information table, parameters of the selected CRM hse1002109 is shown in the right panel, and the locus is displayed in the NCBI sequence viewer for further inspections. Clicking on ‘hse1002109’ in the right panel of the CRM information table displays its constituent TFBSs. D. A snapshot of the TFBS table of hse1002109 containing its 1344 constituent TFBSs.
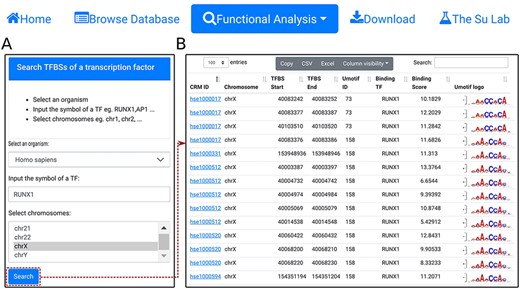
Search TFBSs of a TF. A. In the search form, the use selects an organism (e.g. H. sapiens), input the name of a TF (e.g. RUNX1), and select a chromosome (e.g. chrX). B. A snapshot of the resulting TFBS table containing 2678 TFBSs of RUNX1 in chrX of H. sapiens.
In both the interactive CRM list table (Figure 3B) and the interactive TFBS table (Figure 3C), the user can change the number of entries to display in a page, sort results based on different columns, filter the results using the search box and set visible columns. The user can copy or export the selected items in a file in the CSV or Excel formats or export all records if no item is selected by default (Figure 3).
Functional analyses
To facilitate analyzing potential CRM-gene relationships and TFBSs landscape of specific TFs, we provide three functional analysis modules. First, using the ‘select the closest CRMs to a gene’ function, the user can search the closest CRMs to a gene (e.g. GL13) in an organism (e.g. H. sapiens) at a P-value cutoff (|${\rm{e}}.{\rm{g}}.,{\ }1 \times {10^{ - 6}}){\ }$|(Figure 4A). The search returns the interactive CRM list table containing all CRMs to which the gene is the closest among all other genes in the chromosome (Figure 4B). In the example of the GLI3 gene, a total of 53 CRMs are returned. The user can inspect any of them by clicking on the CRM ID, which pops up the information table of the CRM as we demonstrated earlier (Figure 3C). For instance, clicking on the third CRM hse1003435 in the table displays it in the NCBI sequence viewer, revealing that the CRM is located in the third and fourth introns, and spans the fourth and fifth exons, of the GL13 gene (shadowed rectangle in Figure 4C). Interestingly, hse1003435 overlaps two annotated enhancers and many ClinVar variants (Figure 4C). Finally, clicking on the CRM ID hse1003435 in the right panel of the CRM information table (Figure 4C) displays the CRM’s 988 constituent TFBSs in the interactive TFBS table (Figure 4D). Most of these TFBSs match those of known TF families, while a few need to be determined (TBD) for their cognate TFs (Figure 4D).
Second, using the ‘select CRMs around a gene’ function, the user can search in an organism (e.g. H. sapiens) all CRMs in the upstream and/or downstream regions (e.g. 0.5Mbp) of a given gene (SOX2) (Figure 5A). The search returns all CRMs in the interactive CRM list table (Figure 5B). As before, each CRM can be inspected in its information table by clicking on the CRM ID. In the example of the SOX2 gene of H. sapiens, a total of 102 CRMs on chr3 are returned in the CRM list table (Figure 5B). Inspection of the second CRM hse1002109 in the NCBI sequence viewer reveals that the CRM is located in the sixth and seventh intron, and spans the seventh exon, of the SOX2 gene. Interestingly, it overlaps two annotated enhancer sequences, as well as many ClinVar variants (Figure 5C). Clicking on the CRM ID hse1002109 in the right panel of the CRM information table (Figure 5C) displays the CRM’s 1344 constituent TFBSs in the interactive TFBS table (Figure 5D). Some of these TFBSs match those of known TF families, while others need to be determined (TBD) for their cognate TFs.
Using the ‘search TFBSs of a transcription factor’ function, the user can retrieve all TFBSs of a given TF (e.g. RUNX1) in one or more selected chromosomes (e.g. chrX) in an organism (e.g. H. sapiens) (Figure 6A). The results are returned in the interactive TFBS table (Figure 6B). In the example of the TF RUNX1, a total of 2678 binding sites are found in chrX of H. sapiens.
Batch download
Using the Download function from the home page, the user can download all predicted CRMCs and constituent TFBSs in an organism in a file in BED format.
Future development
In the future, we will add predicted CRMCs and TFBSs in other important model organisms such as the worm (C. elegans) and the fly (D. melanogaster). We will also update the predictions in each organism when more data are available. We will add more information about the CRMCs, including their predicted functional states (active or non-active) of the CRMCs in various cell/tissue types, predicted target genes and causal variants of complex traits and diseases by integrating more data sources.
Conclusions
We have developed the PCRMS database that contains the most comprehensive collections of accurately predicted CRMs and constituent TFBSs in the human and mouse genomes. The web interface to PCRMS allows the user to browse, search and visualize the CRMs and constituent TFBSs. It also provides three functional analysis modules to search the closest CRM(s) to a gene, CRM(s) in a region around a gene and TFBSs landscape of a specific TF. The results can be inspected in interactive ways and exported in files in different formats. All the predicted CRMCs and TFBSs in an organism can be download in BED format. PCRMS will facilitate the research community’s efforts to characterize the regulatory genomes in important organisms
Acknowledgements
The authors would like to acknowledge members from Office of Technical Service of College of Computing and Informatics at UNC Charlotte for security reviewing and deploying the databases.
Funding
US National Science Foundation (DBI-1661332). The funding bodies played no role in the design of the study and collection, analysis and interpretation of data and in writing the manuscript.
Conflict of interest
The authors declare that they have no competing interests.
Declarations
Ethics approval and consent to participate. Ethics approval is not applicable to this study.
Data availability
All predicted CRMCs of human and mouse can be freely downloaded at https://cci-bioinfo.uncc.edu.
Consent for publication
Not applicable.
Author contributions
Z.S. and P.N. conceived and designed the project. P.N. carried out the computational analysis and built the database and the web interface. Z.S. and P.N. wrote the manuscript. All the authors read and approved the final manuscript.
References
Author notes
Present Address: Department of Bioinformatics and Genomics, the University of North Carolina at Charlotte, 9201 University City Boulevard, Charlotte, NC 28223, USA
