


Abstract
Although an increasing number of species-specific databases have been constructed to facilitate the global research community, comprehensive databases remain rare with multidimensional research resources rather than genomic data solely, in particular for non-model species. Here we introduced GinkgoDB, the ecological genome database for the world-renowned living fossil, Ginkgo biloba L., a tree species with extreme longevity, exceptional resistance, global landscape application and dioecy. The present version of GinkgoDB consists of four modules of genome, occurrence, quadrat and gallery. The genome module includes two versions of chromosome-level assembled genomes with high-quality annotation, expression profiles of each sex for different tissues and variants from 545 ginkgo genomes. A suite of tools were also deployed online for search, blast and further analyses. The occurrence module contains distribution information of over one million records across the world with an emphasis on 8926 individual-level tagged trees with phenotypic trait data in eastern Asia. The quadrat module provides monitoring data of both species and habitats from 27 plots of natural ginkgo forests and periodic data of functional traits measured for the entire plant communities. The gallery module collects field morphological photos and scanned phenotypic images of various ginkgo materials. GinkgoDB showcases a comprehensive and persistently growing database for a single non-model species.
Database URL: https://ginkgo.zju.edu.cn/
Introduction
Ginkgo (Ginkgo biloba L.) is the sole living representative of Ginkgoidae, one of the five extant gymnosperm lineages, which has survived the Pleistocene glaciations as a relic species in China and has undergone a global redistribution mediated by humans (1–3). Therefore, such a dioecious, deciduous tree species may provide us the best window into the genetic and ecological mechanism of how such a ‘living fossil’ species could survive extreme environmental changes and possesses a suite of unique traits, like extreme longevity, exceptional resistance and tolerance even to atomic bombing (4). In addition, Ginkgo is a world popular medicinal herb with prominent bioactive compounds. For example, one of the ginkgo extracts, i.e. EGb761, is famous for its neuroprotective effects and has been one of the most popular herbal supplements for curing neurodegenerative disorders such as Alzheimer’s disease (5, 6). Besides, Ginkgo is one of the most memorable plants on the earth for its inimitable fan-shaped golden leaves. As a pretty street tree, ginkgo is widely planted in every corner of the city, adding a lot of splendors to the autumn of each city. Meanwhile, ginkgo seeds are widely used in delicious dishes in East Asian cuisine after removing the fleshy seed coat with an unpleasant smell (1).
An increasing number of species-specific databases were constructed for deep research, especially model species like Arabidopsis thaliana or crops like Oryza sativa (7, 8). However, databases remain rare for non-model species and even lack gymnosperm, the angiosperm’s sister lineage. Besides, most of these databases only host the genomic data, limiting their application, such as identifying candidate genes responsible for given traits and Single Nucleotide Polymorphism (SNP) distribution along environmental gradients. Furthermore, due to the long generation time, trees offer a rare opportunity to collect associated data from the same individual and even to retrieve the original living samples for follow-up researches in decades or hundreds of years. Thus, the construction of tree databases is, in particular, essential and valuable for long-term plant science and ecological researches.
Thanks to the continuous development of sequencing technology, de novo assembly of large genomes was resolved recently. Guan et al. (9) published the first genome draft of ginkgo (9.57Gb/10.61Gb) and provided new insight into the evolution of large genomes and multiple defense mechanisms. Zhao et al. (10) updated the genome to chromosome-level assembly with the Hi-C technique and shed light on the evolutionary processes leading to its modern global distribution and adaptation by resequencing 545 ginkgo genomes across the world. Liu et al. (11) reported another assembly of ginkgo based on long reads sequencing and revealed that the insertion of long terminal repeats caused the expansion of the ginkgo genome. Despite numerous studies focused on this unique living fossil generating a significant volume of omics data, a well-constructed database remains lacking for further research and mining to gain more profound and more comprehensive insights. The authors summarized 12 aspects of biology and ecology for ginkgo based on house-kept and public data, in particular field observation data (12). Hence, we developed GinkgoDB (https://ginkgo.zju.edu.cn/), a comprehensive database with multidimensional research resources of ginkgo, including both lab-produced omics data and field-observed trait data across large spatiotemporal scales, of which most are associated with tagged individual trees living in natural or anthropogenic habitats.
Materials and methods
Genome assemblies with function annotation
GinkgoDB included two genome assemblies, the first chromosome-level assembly of ginkgo (9.57 Gb, contig N50 = 54.11 Kb, scaffold N50 = 725 Mb) from Illumina Hiseq 2000/4000 reads with Hi-C sequencing (13) and a recently published genome (9.87 Gb, contig N50 = 1.58 Mb, scaffold N50 = 775 Mb) assembled using PacBio RSII reads and polished according to Illumina NextSeq reads (11)11. Each genome assembly’s public annotation profiles were both used. Based on 40 215 genes’ structure annotation, we aligned protein sequences against the UniProt (14) and RefSeq (15), using BLAST (E-value = 1e-5). To assign gene ontology (GO) terms to each protein-coding gene, the results derived from the UniProt database were joined to the GOA database (16) and core ontology data (17, 18). For domain regions prediction, these proteins were compared against the CDD, Coils, Gene3D, Hamap, MobiDBLite, PANTHER, Pfam, PIRSF, PIRSR, PRINTS, ProSitePatterns, ProSiteProfiles, SFLD, SMART, SUPERFAMILY and TIGRFAM database using InterProScan (19) (v5.54–87.0) to identify protein families and domains. We also predicted functional metabolic pathways for each gene with KAAS annotation server (20).
Variant data and population structure
Variant data of ginkgo were from a population genetic study of 545 individual ginkgo trees collected from all over the world, including 51 populations from nine countries (10). The raw variant data set was filtered with the parameters of ‘QD < 2.0 || MQ < 30.0 || FS > 60.0’. After filtering out the SNPs with a quality score less than 200, a total of 161 040 296 high-quality SNPs were retained. To further filter, we used VCFTOOLS (v1.15) with the parameters of ‘--max-missing 0.98’ and keep a variant calling format (VCF) file containing 3 120 696 SNPs for the online search.
The neighbor-joining (NJ) phylogenetic tree, principal component analysis (PCA) and population structure analyzed by ADMIXTURE (21) were performed in the previous study (10). Phylogeny.IO (22) was applied for the visualization of the phylogeny. The PCA results and the admixture (from k = 2 to 10) of sequenced trees were plotted using Echarts (https://www.echartsjs.com/).
Gene expression data
Gene expression data of ginkgo were collected from two tissues (cones and leaves) at three developmental stages in three male and three female trees in Tianmu Mountain National Nature Reserve, Zhejiang, China (13). The developmental stages were defined according to the distinguished morphology, i.e. F1) initial budburst, F2) full development of female cones and F3) appearance of pollination drops for females; and M1) initial budburst, M2) full development of male cones and M3) opening of male cones for males. Three biological replicates were taken at each stage. The first character of sample ID means the tissue is cones(F) or leaves(L), and the last number represents one of the biological replicates.
The whole genome were used as the decoy sequence. The gene counts and abundance (transcripts per million, TPM) were quantified by SALMON (v1.8.0).
Distribution and traits data
We combined both the sampling records of global ginkgo trees and the survey data of the university campuses in China collected by our group and the record data compiled from ‘Chinese Ginkgo Germplasm Resources’ (23) into the table of ginkgo distribution, which contains 8926 trees. Finally, we organized and integrated the survey data of the sample in our laboratory in recent years, the monitoring data of the national ginkgo growth status, gender, sample functional traits and the collection of biological samples and completed the data standardization. After data masking, more than 1 000 000 occurrence data was kindly provided by the plant identifier, Picturethis (Xingse).
Quadrat data and graphic resource
From August 2019 to July 2021, we established 27 monitoring quadrats of natural ginkgo forests in Tianmu Mountain National Nature Reserve, Hangzhou, China. The database stored the community compositions of the permanent monitoring quadrat, environmental data and the trait data of various species. We surveyed and recorded the growth condition parameters like diameter at breast height (DBH), height, crown width, crown condition for trees with DBH greater than 1 cm. Dendrometers were installed for trees with DBH greater than 5 cm to record their growth rate. Photos in the gallery module were collected by our team.
Results
GinkgoDB was constructed under LAMP (Linux+ Apache+ MySQL+ PHP) architecture, consisting of four primary modules, i.e. genome, occurrence, quadrat and gallery (Figure 1). The genome module offers various search options for users to access the genomic data of ginkgo, including the genome assemblies with annotation and variant data (9, 10). For ecological researchers, the occurrence module contains phenotypic trait data and distribution information of ginkgo, while the quadrat module includes 27 permanent quadrats of natural ginkgo forests, constructed in Tianmu Mountain National Nature Reserve, Hangzhou, China between 2019 and 2021. The gallery module collects field morphological photos and scanned images of various ginkgo materials, aiming to provide a visual record of morphological variation, life-historytraits and developmental processes and habitats of ginkgo.
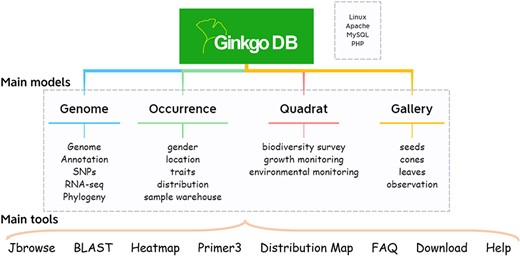
Database architecture of GinkgoDB.
Genome module
The genomic data of ginkgo could be accessed directly by searching genes’ name or a genome region (Figure 2). The ‘Overview’ search returns all the genes, SNPs and genome statistical data in the queried region, while ‘Annotation’ and ‘Variation’ options lead users to the detailed annotation of 40 215 genes and variation profile of 3 120 696 SNPs, respectively (Figure 2). Each gene page and related pages are linked to JBrowse (24), which is implemented to display genome sequences, genome annotation and variants profiles (Figure 2D). In addition, all nucleotide and protein sequences of ginkgo are available for comparison using the BLAST+(2.11.0) program.
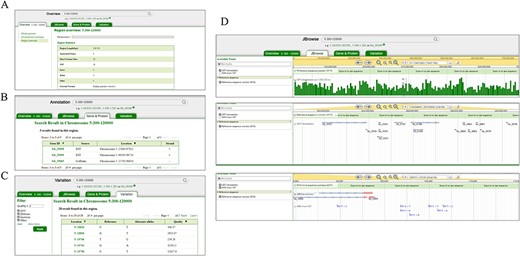
Search and result pages of GinkgoDB. Users can take a query for the specific genome segment or gene, which would return the summary (A), all the gene (B) and SNPs (C) of the queried region, a link to the JBrowse page (D).
Each gene’s page displays the sequence of this gene, the translated protein sequence, function, family, domains, variants in this gene region and expression in each collected sample (Figure 3). In particular, the function annotation and domains prediction from different external databases are provided with links for the users’ convenience (Figure 3C).
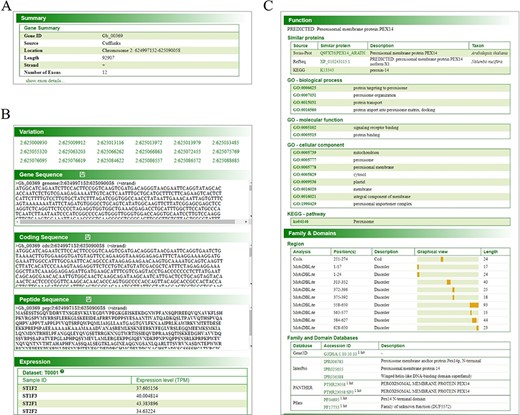
Gene page of GinkgoDB. The gene page displays specific gene summary (A), sequence, translated protein sequence, expression (transcripts per million, TPM) (B) and annotation information (C), in each collected sample.
Also, GinkgoDB provides gene expression analysis functions on the tool button, ‘heatmap’, scaled by log2(TPM + 1). Users can select specific sample combinations for the traits under study to analyze the expression differences of target genes among different groups, the sex-biased expression through the development of cone for example, which is visualized using an expression heatmap (Figure 4A, B). The transcriptome sequencing dataset is informed in ‘Step1: Choose samples’ block with an external link to the project information page, deployed in project model (Figure 4A, Supplementary Figure S1). For picking primers, Primer3Web (v4.1) was deployed on the ‘Primer3’ with ginkgo’s k-mer lists provided. Furthermore, a neighbor-joining phylogeny tree of 545 sequenced wild individuals is shown on the ‘Phylogeny’ sub-website, in which the sample IDs are colored according to the population structure as previous study (10) (Figure 4C).
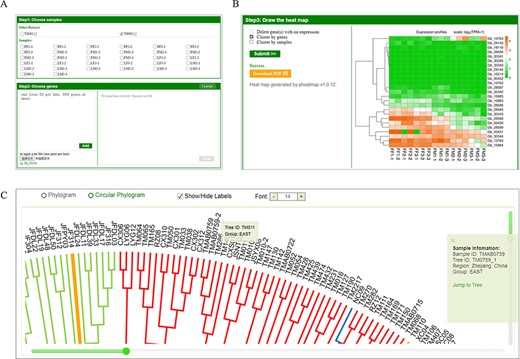
Expression analysis tool and phylogeny of GinkgoDB. Users can select specific sample combinations for the traits under study to analyze the expression differences of target genes among different experiments (A), which will be visualized by an expression heatmap, which could be downloaded as PDF(B). (C) The neighbor-joining phylogeny tree of wild individuals. Each sample ID could be clicked and links to the sample information page.
Occurrence module
The occurrence module contains distribution information and phenotypic trait data of ginkgo. Users can take a query for specific ID, location or description while clicking the ID in the ‘Phylogeny’ also lead to the selected tree’s archives. For each documented tree, location, local environment, growth situation, sex type, collected sample information and other function traits, if available, are categorized on each individual page (Figure 5). The individual page also includes trunk diameter growth rate data for more than 200 trees we are monitoring in both natural habitats and university campuses (Figure 5E). If the tree has been sequenced, its genetic relation with other sequenced trees will be illustrated with a phylogenetic tree, in which the sample’s ID is highlighted. Additionally, principal component analysis and ADMIXTURE results demonstrate the population structure with the sample labeled. To be noted, the graphs of these results are all interactive for zoom in or out (Figure 5F).
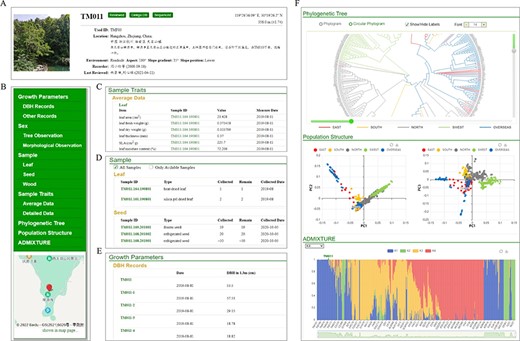
Individual page with detail information of GinkgoDB. (A) Summary. (B) Content list with location tagged on the map. (C) Sample traits if available. (D) Biological materials collection of the individual. (E) Integrated visualization of phylogeny, PCA and population structure.
In addition to traits data, the map page shows the distribution of more than 8000 mature trees with detailed records (Figure 6A), and the heatmap page displays spread density based on more than 1 000 000 sighting records (Figure 6B).
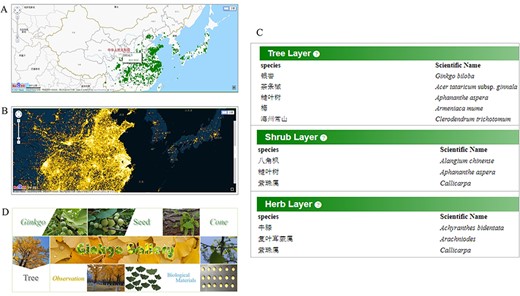
Comprehensive data for ginkgo conservation. Distribution map (A) of documented mature trees and heatmap (B) of reported trees. (C) Species list in each quadrat. (D) The gallery model collects various material type of trees.
Quadrat module
Permanent quadrats in field communities are critical for long-term ecological and evolutionary researches to better understand population dynamics and local adaptation in the context of community succession. We established 27 quadrats of natural ginkgo forests in Tianmu Mountain National Nature Reserve and investigated not only ginkgo but also all the tree, shrub and herb species in the quadrat in detail, which provide researchers an opportunity to study the natural ginkgo population and community from a comprehensive perspective (Figure 6C). We surveyed and recorded the growth condition parameters like diameter at breast height (DBH), height, crown width, crown condition for trees with DBH greater than 1 cm. For trees with DBH greater than 5 cm, dendrometers were installed to record their growth rate.
Gallery module
Aiming to provide a visual record of ginkgo’s morphology, growth process and habitat, the gallery module collects photos and scanned images of various ginkgo materials, such as trees, leaves, seeds and cones (Figure 6D). Each photograph is tagged with sample ID and material type, having links to the storage information if available. Three more modules of ecological traits are mainly connected by sample ID, making it easy for users to access the data they want.
Besides the prevailing modules, GinkgoDB allows researchers to download various data types by File Transfer Protocol (FTP), which can both be accessed directly through project module and the ‘Download’ page in genome model (Supplementary Figure S1 and S2). Each dataset obtained in GinkgoDB has a detailed information page and all-in-one data profile, appended the preliminary processed data, such as transcripts quantification result of transcriptome sequencing data (Supplementary Figure S1). Also, a link, leading to the ‘About’ page with information about the source articles with data processing pipelines, is provided on the download page (Supplementary Figure S3). Furthermore, the GinkgoDB team welcomes researchers to contact us for cooperation, contribution and co-construction. Finally, GinkgoDB offers detailed Frequently Asked Questions (FAQ) on the Help page of each model as a user-friendly database. All functionalities and presentations of GinkgoDB have been tested in major browsers from personal computers and mobile phones.
Conclusion and discussion
We presented the first gymnosperm comprehensive database for a single species. The GinkgoDB includes the chromosome-level assembled genome with high-quality annotation, expression profiles of each sex with different tissues and a large amount of set of variants covering whole genome. Besides, GinkgoDB provides dynamic monitoring data from 27 forest plots and periodic data of functional traits measured for the entire plant communities. In addition, GinkgoDB offered various online tools for users to search, blast, compare different genes’ expressions and make other analyses.
GinkgoDB aims to be the world’s comprehensive database of ginkgo, facilitating research, development and conservation of the entire community. The present version database associated data with an emphasis on the genome, occurrence and community data which were continuously collected from the living trees in the real world. We endeavor to add new amounts and types of data continually, as well as update and supplement functions. We wish such a platform would be as vital and long-lived as ginkgo, providing the global community an inspiring showcase of the way of studying trees and empowering living fossil conservation.
Supplementary data
Supplementary data are available at Database Online.
Acknowledgements
The authors thank Chinese University iPlant Association (CUiPA, http://campus.nsii.org.cn/) for observation data based on citizen science on campus, PictureThis Application (Xingse, http://www.picturethisai.com/) for masked occurrence data globally, all other data collectors and providers and Information Technology Center of Zhejiang University for technical support.
Funding
This work was supported by National Key Research and Development Program of China (No. 2017YFA0605104), and the National Natural Science Foundation of China (Nos. 31870190, 32071484).
Conflict of interest
None declared.
References
Author notes
contributed equally to this work.
