


Abstract
In silico chromosome painting is a technique by which contributions of distinct genetic groups are represented along chromosomes of hybrid individuals. This type of analysis is used to study the mechanisms by which these individuals were formed. Such techniques are well adapted to identify genetic groups contributing to these individuals as well as hybridization events. It can also be used to follow chromosomal recombinations that occurred naturally or were generated by selective breeding. Here, we present GeMo, a novel interactive web-based and user-oriented interface to visualize in a linear-based fashion results of in silico chromosome painting. To facilitate data input generation, a script to execute analytical commands is provided and an interactive data curation mode is supported to ensure consistency of the automated procedure. GeMo contains preloaded datasets from published studies on crop domestication but can be applied to other purposes, such as breeding programs Although only applied so far on plants, GeMo can handle data from animals as well.
Database URL: https://gemo.southgreen.fr/
Key Points
GeMo is a new web resource to carry out ancestry mosaic painting in a linear fashion.
GeMo enables dynamic and interactive visualization, data sharing online and contains preloaded datasets from published studies.
GeMo provides access to a script and a well-documented procedure to generate genome ancestry mosaics.
Introduction
Hybridizations and introgressions are at the center of multiple scientific questions in biology (1, 2). Unraveling their origins and impacts is a key objective to understand the mechanisms by which organisms were formed and evolved, and thus feature in multiple topics such as human ancestries (3), plant domestication (4), crop improvement (5) and environmental adaptation (6). At the genome level, the result of these introgression events can be represented as genome ancestry mosaics, defined as a succession of large chromosomal DNA segments, or genomic blocks, of distint origin. These genomic blocks can be associated with genetic groups defined as groups of individuals with a homogenous genetic background resulting from a common ancestor or population (e.g. species, subspecies).
Over the past decade, our ability to generate genomic data at high throughput for a large sampling has been revolutionized, enabling genome-wide characterization within a particular species (7, 8). The availability of these genomic data led to the development of new methodologies that use genetic markers to study the genome ancestry mosaics of individuals (9, 10). Such methods, called local ancestry inference methods are based on hidden Markov model, multivariate analysis or ancestral allele ratio approaches. These methods have been applied to various animals and plant organisms (11–14) and will be referred to hereafter as in silico chromosome painting analyses.
To visualize in silico chromosome painting, packages with linear ideograms or karyotypes such as ChromPlot (15), ChromDraw (16), karyoploteR (17), RIdeogram (18) can be used, but they require advanced programming skills and generate only static images. A few online applications were developed but are specific to some organisms like DNAPainter for Humans (https://dnapainter.com) or favor circular-based visualization rather than linear (19). Until now, there were no web-based interfaces handling datasets in an interactive and linear fashion, and none addressing the challenges of polyploidy, which is often encountered in plants.
Here we present GeMo, a web-based tool for visualization, curation and data sharing of genome ancestry mosaics. It comes with a script and step-by-step instructions, using two local ancestry inference-based methods, TraceAncestor (20) and VCFHunter (21), which assign alleles to genetic groups and use the allelic ratio observed in individuals to assign an origin to genomic blocks. GeMo can guide users through in silico chromosome painting starting with a Variant Call Format (VCF) file and acts as an online repository for genomics ancestry mosaics.
Tool implementation and usage
GeMo is a lightweight web-based interface implemented in JavaScript. The display of the interactive graph is managed with the JavaScript D3JS library (https://d3js.org) and chromosome visual rendering builds on the Ideogram library (https://eweitz.github.io/ideogram). The web page design uses the Bootstrap library (https://getbootstrap.com), which ensures compatibility with modern web browsers. On the back-end, a NodeJS server (https://nodejs.org/en/) ensures data transfer and analysis.
Visualization of preloaded ancestry mosaics/datasets
GeMo contains ancestry mosaics of preloaded individuals resulting from published studies conducted on subsets of plant genotypes (13, 20–22). When selecting a preloaded individual (Figure 1A), a form is automatically filled with the genomic coordinates of the genomic blocks and the visualization parameters (e.g. colors, reference sequence coordinates, ploidy). GeMo displays the ancestry mosaic drawing for each chromosome (Figure 1B). The chromosomal segments are colored according to their corresponding genetic group.
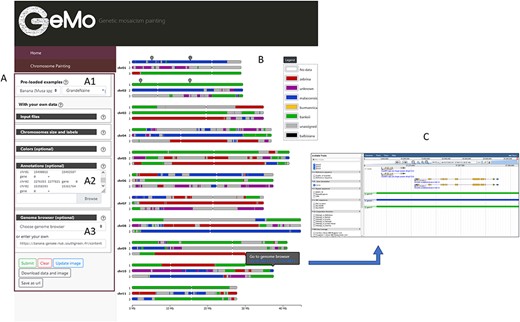
Overview of the GeMo visualization interface representing the genome ancestry mosaics of the triploid cultivated banana ‘Grande Naine’ (13). (A) Menu panel allowing the user to load their own data or to visualize preloaded data (A1). (B) Predicted mosaic structure for the 3 × 11 chromosomes as proposed in (13). Each color on the chromosomes represents a genetic group, except dark gray for undefined genomic block. Symbols on chr01 and chr02 indicate genomic features (such as gene of interest, QTLs, etc.) entered by users based on genomic coordinates of the reference genome used to draw the genome ancestry mosaics in the menu entitled ‘Annotations’ in A2. (C) Automatically exported dataset from GeMo by clicking on a block and imported as a track to the JBrowse configured in the Genome Browser menu in A3.
An interactive legend labels each genetic group with a corresponding color (Figure 1B). After modifying the color of a group directly in the legend (free-mode and colorblind mode available), the visualization of the chromosomes is automatically updated. By hovering over each genomic block, a link is displayed for a pre-defined genome browser URL at the observed genomic position.
Input user datasets
Users have the possibility to enter their own files using the menu panel (Figure 1A). GeMo requires at least two types of datasets to generate the ideogram visualization: (i) a tabulated file for the reference chromosome metadata (names and respective sizes) and (ii) a tabulated file for drawing the genome ancestry mosaic of analyzed individuals. GeMo comes with a list of defined plant chromosomes, but users can enter their own chromosomes as well. The position of the centromeres can be optionally indicated in this file. The file containing genome ancestry mosaics can either be encoded as block position (genomic segment along a chromosome with defined start and stop positions) or normalized curve (observed allelic ratio for each gene pool along the chromosomes).
Once data is provided, the karyotype diagram is generated dynamically. The resulting visualization depends on the encoding of the ancestry mosaic information. Segments are drawn along chromosomes if block positions are passed (Figure 1) but line plots and chromosome segments are drawn if normalized curves are provided (Figure 2—see next section for details about this visualization). Multiple ploidy levels are supported, enabling the representation of haplotypes for polyploid species. Ploidy is auto-detected by the system but needs to be specified when using curves.
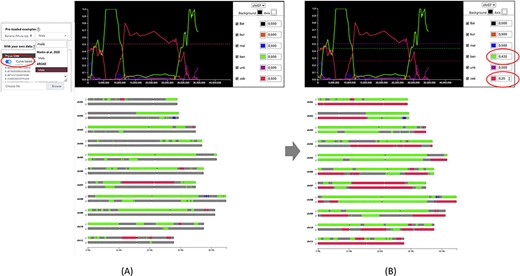
Comparison of genome ancestry mosaic results before (A) and after (B) curation in GeMo. In A, the genome ancestry mosaic is not well resolved (dark gray for undefined origin) with default parameters (0.5 for diploid). Once the curve-based mode is activated, an interactive graph facilitates threshold adjustment. In B, the genome ancestry mosaic is better resolved after reducing expected thresholds for the two curves with the main ratios (as indicated in circles).
In addition, a list of genomic coordinates (e.g. genes of interest, Quantitative Trait Loci (QTL)) can be provided as a Browser Extensible Data file to visually spot the corresponding regions on the chromosomes (Figure 1B). This can be particularly useful to check co-localization between genomic blocks and genes/regions of interest. As a complement, and to avoid extracting genomic information already available in a JBrowse instance, GeMo allows the user to extract the genomic block information as JBrowse tracks (Figure 1C).
To support data import in GeMo, step-by-step tutorials with two possible programs using VCFHunter and TraceAncestor are provided for users starting with a VCF file as well as a single script to facilitate execution (https://gemo.readthedocs.io/en/latest/QuickStart.html). The approach is compatible with genome-wide genotyping methods (e.g. GBS, RADseq, DaRTseq), transcriptomics (i.e. RNAseq) or whole-genome resequencing data, including both individuals to investigate and ancestral genetic groups. The complete data processing of these typically takes less than 1 h per individual. The tutorials describe the creation of either block-position-based mosaics or curve-based mosaics for interactive display, the latter enabling manual curation of the ancestry mosaics via the GeMo Interface. Step-by-step tutorials, compared to the script, allow users to customize parameters and interactively monitor the result of each analytical step.
Data curation of ancestry mosaic predictions
In silico chromosome painting resulting from an automated bioinformatic procedure may not be exact, requiring expert review and adjustment. GeMo proposes a curation mode to edit thresholds for single nucleotide polymorphism (SNP) ratios that are by default defined based on expected ploidy (0.5 for heterozygous diploids, 0.33/0.66 for heterozygous triploids, etc.). Indeed, such ratios are expected in the ideal case, but some variations relative to the expected value can exist, either associated with the sequencing and genotyping techniques, errors in the attribution of ancestral alleles or sampling of the individuals used as representatives of a genetic group. For example, if a genetic group is represented by only a few members representing only a small portion of its diversity, identified alleles will under-predict the contribution of this genetic group in individuals descending from it. In this context, the threshold may need to be adapted. As illustrated in Figure 2, the curation mode can be used to significantly improve automated results.
When normalized curve datasets are available (from preloaded datasets or loaded by users online), GeMo displays interactive graphs that enable the curation of predicted genome ancestry mosaics. These graphs represent the proportion of haplotypes of each genetic group by chromosomes resulting from a normalization of the number of reads supporting each origin on a given window. This allows for visualizing the contribution of each genetic group along the chromosomes and checking the threshold that led to the colored painting of blocks (Figure 2A). With GeMo, users can change the threshold on the graph to recalculate the ancestry mosaic block contribution. Once a threshold is changed, the karyotype diagram is dynamically updated, which facilitates threshold adjustment (Figure 2B).
Data and high-resolution image downloads
Once data is visualized and customized, GeMo offers the possibility to download the latest version of the data sets and export the graphic outputs as SVG for publication purposes. In addition, data can also be stored temporarily online with a unique URL allowing users to share it.
Discussion
GeMo addresses several use cases that are illustrated in Figure 3. For ancestry inference, once genetic groups are defined and assigned to a putative descendant, in silico chromosome painting reveals their contribution to the genetic makeup of the individual, in particular when a hybridization event is recent (e.g. few meiotic events followed hybridization). This can be observed for example in plants with low fertility (e.g. banana, yam) (13) or with long generations (e.g. trees) (20). GeMo provides thus a visual way to analyze and deduce the steps that shaped the genome of a given individual (13), allowing users to reconstruct simple case pedigrees (Figure 3A).
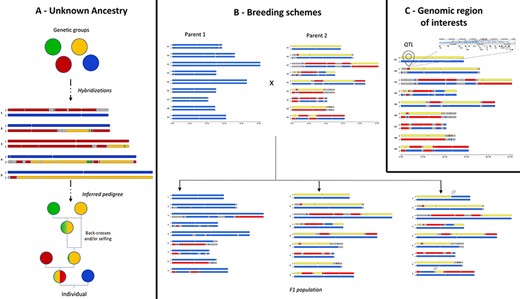
Examples of use cases supported by in silico chromosome painting. (A) Based on defined ancestral genetic groups, a genome ancestry mosaic is painted, allowing identification of the genetic group involved in the hybridization process and deduction of the pedigree. (B) In silico chromosome painting in a breeding bi-parental population showing a subset of possible gametic chromosome distribution and possible chromosome recombinations (gray arrows) in progenies. (C) Co-localization of a genomic block with a genomic feature of interest (e.g. QTL) to explore gene content in related JBrowse.
In a breeding context, GeMo provides a visual way to follow chromosome segregations and recombinations (crossing overs during meiosis) in bi-parental populations (Figure 3B). In silico chromosome painting visualization can help the user inspect chromosome structures in progenies to select the most desirable individual. Thus, GeMo has the potential to support the visualization of crosses in breeding programs working with molecular approaches (23).
For functional genomics, drawing genome ancestry mosaics in which genomic segments are co-localized with a QTL (Figure 3C) may reveal traces of adaptative introgressions to be further investigated (5). The recurrent occurrence of a genomic block in natural hybrids, for instance, or co-localization with a given QTL may indicate positive selection. For transcriptomics studies, it provides a way to overlay the chromosomes with genes that display differential expression in a specific haplotype (24). The software interoperability with genome browsers allows to zoom into specific genes in a genomic block or to export the genome ancestry mosaics as tracks into a JBrowse instance.
In conclusion, GeMo intends to help users exploit SNP markers and visualize genome ancestry mosaics in an easy and interactive way. GeMo proposes a procedure to conduct in silico chromosome painting with an interactive and online curation mode to improve results from such automatic analyses, enabling parameter adjustment based on organism specificities. GeMo can also act as an online repository, collecting public datasets for which in silico chromosome painting was conducted.
Acknowledgements
This work was supported by the CIRAD—UMR AGAP HPC Data Center of the South Green Bioinformatics platform (http://www.southgreen.fr/). We thank colleagues for their careful testing of the software and feedback, in particular Alberto Cenci (Bioversity), Valentin Guignon (Bioversity) and Eloi Durant (IRD) as well as Manuel Ruiz and Angélique Dhont (CIRAD) for their support in the project. We also thank Alexandr Zelenin for committing useful features of the ideogram.js library; Rachel Chase for text editing of the manuscript and the anonymous reviewer for the constructive and comprehensive feedback to improve the manuscript.
Funding
GeMo has been developed in the framework of the Agropolis Fondation (ID 1504–006) ‘GenomeHarvest’ project through the French Investissements d’avenir programme (Labex Agro: ANR-10-LABX-0001-01).
Conflict of interest
None declared.
Data availability
GeMo is available at https://gemo.southgreen.fr/. Data processing instructions, scripts and documentation are available at https://gemo.readthedocs.io. GeMo is primarily designed for online access on our servers, but code source is open access on GitHub at https://github.com/SouthGreenPlatform/GeMo/ and can be used for local set up.
