


Abstract
Recent focus on transcriptomic studies in food crops like rice, wheat and maize provide new opportunities to address issues related to agriculture and climate change. Re-analysis of such data available in public domain supplemented with annotations across molecular hierarchy can be of immense help to the plant research community, particularly co-expression networks representing transcriptionally coordinated genes that are often part of the same biological process. With this objective, we have developed NetREx, a Network-based Rice Expression Analysis Server, that hosts ranked co-expression networks of Oryza sativa using publicly available messenger RNA sequencing data across uniform experimental conditions. It provides a range of interactable data viewers and modules for analysing user-queried genes across different stress conditions (drought, flood, cold and osmosis) and hormonal treatments (abscisic and jasmonic acid) and tissues (root and shoot). Subnetworks of user-defined genes can be queried in pre-constructed tissue-specific networks, allowing users to view the fold change, module memberships, gene annotations and analysis of their neighbourhood genes and associated pathways. The web server also allows querying of orthologous genes from Arabidopsis, wheat, maize, barley and sorghum. Here, we demonstrate that NetREx can be used to identify novel candidate genes and tissue-specific interactions under stress conditions and can aid in the analysis and understanding of complex phenotypes linked to stress response in rice.
Database URL: https://bioinf.iiit.ac.in/netrex/index.html
Introduction
Entities in a biological system seldom work in isolation. There is a coordinated association between them at every level of the molecular hierarchy. These associations are context-specific and involve the making and breaking of links among the entities depending upon the developmental stage, tissue and environmental conditions. In field conditions, plants are generally exposed to multiple stresses. Thus, finding processes that are common or unique across various stress conditions can provide novel insights into multi-stress tolerant crops. One of the first studies on multi-stress expression profiling in rice (using rice complementary DNA microarray) was conducted by Rabbani et al. (1) with the objective to identify genes induced by cold, drought, high-salinity and abscisic acid (ABA) treatments. Although this early study was on a limited set of probes, it demonstrated a common set of genes differentially expressed across various environmental conditions. This paved the way for numerous studies on various crops: expression profiling in potato in response to cold, heat and salt stress (2), effect of ABA, drought and salinity stress on pathogen defence in tomato (3), transcriptome responses during single and combination of stresses in Arabidopsis (4) and expression profiling of chickpea genes in response to salinity, drought and cold stress (5).
Transcriptomic resources have made major contributions to plant functional genomics. For example, RiceXPro hosts rice transcriptomic data across various conditions, namely, different plant hormone treatments, cell and tissue types, and field/developmental stages (6). The database RiceSRTFDB provides expression information for transcription factors (TFs) in rice under drought and salinity stress and various developmental stages (7). More recent resources include ePlant web server that provides an integrated view of the genome, proteome, interactome, transcriptome [both from microarray and RNA sequencing (RNA-seq) data] and 3D molecular structure data in Arabidopsis (8), Rice Expression Database (RED) (9) and Transcriptome ENcyclopedia Of Rice (TENOR) database, a collection of large-scale messenger RNA (mRNA)-seq data obtained from rice under a wide variety of conditions (10). For researchers, such large-scale resources provide further opportunities to re-analyse the data with new hypotheses.
A transcriptomic experiment (microarray or RNA-seq) typically detects thousands of genes differentially expressed with respect to control conditions. Functional analysis of such a large set of genes is a daunting task. A popular approach is to construct co-expression networks based on the similarity of gene expression profiles (11). Here, nodes represent genes, and edges represent the strength of correlations between them. Highly correlated genes can then be grouped into functional modules, reducing the dimensionality of data. Another approach is to convert the raw correlation values (Pearson or Spearman) into the highest reciprocal ranks (HRRs) or mutual ranks (12, 13). Several studies have shown that the biological relevance of ranked-based methods is more significant and robust than those constructed using raw Pearson’s correlation coefficients (PCCs) because they intuitively consider PCCs of the neighbourhood of gene pairs as well (13–15). Moreover, these methods circumvent the problem of hard-thresholding of PCCs and allow weak but significant co-expression relationships between genes based on ranks (16–19).
For the plant community, various functional resources are available. At the global scale, condition-independent networks constructed across a large number of data sets from varying experimental conditions, platforms, tissues and developmental stages are available, e.g. AraNet (20), RiceNet (21) and MaizeNet (22). Although these allow one to derive associations from a large sample size, the merging of different experimental conditions might incorporate complexities in the network difficult to account for. Nevertheless, these resources have been useful in the functional annotation of unknown genes and the prioritization of candidate genes (20–22). On the other hand, condition-dependent networks, derived from smaller data sets representing certain specific conditions, provide opportunities to query context-specific associations (23, 24). In NetREx, a Network-based Rice Expression Analysis Server, data corresponding to four stress conditions (drought, cold, flood and osmotic stress) and two hormonal treatments [ABA and jasmonic acid (JA)] from seedlings (10 days after germination) from the TENOR database (10) have been considered for network construction and analysis. First, we construct a global rank-based stress network across four stress conditions and two hormonal treatments, separately for root and shoot tissues. Stress-specific networks are then derived from these global networks using differentially expressed genes. These networks along with functional information are hosted in the database.
Materials and methods
Data sets
For the construction of this resource, we have considered publicly available mRNA-seq data from rice seedlings under four environmental stresses (drought, cold, flood and osmotic stress) and two plant hormone treatments (ABA and JA), obtained from the TENOR database (DDBJ Sequence Read Archive: DRA000959). All the experiments have been performed using a single mRNA-seq platform under standardized laboratory conditions and from the same rice cultivar Oryza sativa L. (cv. Nipponbare), making it possible to compare gene expressions across different stress conditions. These are 76-bp single-read sequences obtained from the Illumina GAIIx instrument under uniform library conditions (10). Information about the number of samples and biological replicates corresponding to the stress conditions, tissues and time points are given in Table 1, and links to the individual replicates are given in Supplementary Tables S1–S7.
Number of samples and biological replicates for the mRNA-seq data from DDBJ-SRA (DRA000959) considered for multi-stress analysis are summarized
| Time points (No. of biological replicates) | ||||
|---|---|---|---|---|
| Conditions | Treatment | Root | Shoot | No. of samples |
| Cold | 4°C | 0 h (3), 1 h (2), 3 h (2), 6 h (2), 12 h (2), 1 day (2) | 0 h (3), 1 h (2), 3 h (2), 6 h (2), 12 h (2), 1 day (2) | Root: 13 Shoot: 13 |
| Drought | Grown without medium | 0 h (2), 1 h (2), 3 h (2), 6 h (2) 12 h (2), 1 day (2) | 0 h (2), 1 h (2), 3 h (3), 6 h (2), 12 h (2), 1 day (2) | Root: 12 Shoot: 13 |
| Osmotic | 0.6 M mannitol | 0 h (3), 1 h (2), 3 h (2), 6 h (2), 12 h (2) | 0 h (3), 1 h (2), 3 h (2), 6 h (2), 12 h (2) | Root: 11 Shoot: 11 |
| Flood | Completely submerged in medium | 0 h (3), 1 h (2), 3 h (2), 6 h (2), 12 h (2), 1 day (2), 3 day (2) | 0 h (3), 1 h (2), 3 h (2), 6 h (2), 12 h (2), 1 day (3), 3 day (2) | Root: 15 Shoot: 16 |
| ABA | 100 µM | 0 h (2), 1 h (2), 3 h (2), 6 h (2), 12 h (2), 1 day (2) | 0 h (2), 1 h (2), 3 h (2), 6 h (2), 12 h (2), 1 day (2) | Root: 12 Shoot: 12 |
| JA | 100 µM | 0 h (2), 1 h (2), 3 h (2), 6 h (2), 12 h (2), 1 day (2) | 0 h (2), 1 h (2), 3 h (2), 6 h (2), 12 h (2), 1 day (2) | Root: 12 Shoot: 12 |
| No treatment (NT) | – | 0 h (2), 1 h (2), 3 h (2), 6 h (2), 12 h (2), 1 day (2), 3 day (2), 4 day (2), 5 day (2), 10 day (2) | 0 h (2), 1 h (2), 3 h (2), 6 h (2), 12 h (2), 1 day (2), 3 day (2), 4 day (2), 5 day (2), 10 day (2) | Root: 20 Shoot: 20 |
| Total | Root: 95 Shoot: 97 | |||
Pre-processing
Raw reads are processed for quality control. Adaptor sequences and low-quality bases (<Q15) at 5′ and 3′ ends of the reads are trimmed using Cutadapt (ver. 1.15) (25). After trimming, reads < 20 bp are discarded as these may lead to non-specific alignment to the reference genome. For each sample, reads are aligned to the rice reference genome (Os-Nipponbare-Reference-IRGSP-1.0) using a graph-based alignment programme, HISAT2 (ver. 2.1.0) (26), and gene annotations are taken from the The Rice Annotation Project (RAP) database (version: 2017-04-14) (27). For each sample, the total base pairs before and after filtering and the percentage of reads aligned to the genome are given in Supplementary Tables S1–S7. The percentage of reads mapped to the reference is a global indicator of sequencing accuracy as well as the presence of contamination in the samples (28).
Estimating read counts and differential gene expression analysis
Raw read counts for a gene are a measure of its expression. Here, we use the ‘featureCounts’ tool from the SubRead package (1.6.0) (29) and the gene annotation file from RAP-DB to compute gene expression. The percentage of reads assigned to the genes is given in Supplementary Tables S1–S7. Differentially expressed genes (DEGs) are determined in a tissue-specific manner for every time point at a 2-fold change and P-value < 0.05 using DeSeaq2 (30). Genes that are differentially expressed in at least two time points for a given stress condition are given in Table 2. Stress/treatment-specific DEGs overlapping with the developmental time points (NT) are filtered out as these basically account for diurnal/developmental changes. The final count matrix across various stress/hormone treatments is constructed considering genes having raw read counts ≥ 5 in at least 50% of the total samples across time points. In RNA-seq data, most strongly expressed genes show large variations across samples compared to those with lower expression profiles (heteroscedasticity). On the other hand, most common methods of multi-dimensional data analysis like clustering work best with homoscedastic data (variance is independent of mean). To achieve this approximate homoscedasticity, the combined count matrix is normalized using variance stabilizing transformation in DeSeaq2 to obtain a relatively flat trend of variance as a function of mean (31). The DEGs are then considered for rank-based network construction (details given in the ‘HRR network construction’ section). Table 2 indicates that for certain stress conditions, e.g. drought and flood stress, a large number of DEGs are observed in the shoot tissue compared to the root tissue, indicating that major physiological changes like growth in the green tissues and plant height get impacted by these conditions. Also, exogenous and direct applications of hormones like ABA and JA induce drastic changes in the plant at the molecular level with a large number of DEGs getting activated or repressed.
Number of DEGs across various conditions
| DEGs in at least two time points | |||||||||
|---|---|---|---|---|---|---|---|---|---|
| Tissue/stress | Drought | Cold | Osmotic | Flood | ABA | JA | NT | Total DEGs—NT | Total DEGs used for network construction |
| Root | 3817 | 6327 | 8040 | 3651 | 9340 | 8835 | 1127 | 16 812 | 13 695 |
| Shoot | 10 576 | 4540 | 6267 | 6955 | 8898 | 6531 | 1116 | 15 804 | 13 717 |
HRR network construction
The number of DEGs across various conditions in the correlation network and the HRR-100 network is given in Tables 3 and 4, respectively. It may be noted that the major advantage of considering the HRR-100 network over the PCC network is a significant reduction in the number of edges. Moreover, while ranking the genes, this process intuitively considers the vicinity of the network neighbours as well which has a considerable impact on the biological relevance of the networks (14).
Number of DEGs across various conditions in the PCC network
| PCC network (with PCC > 0 and P-value < 0.05) | ||||||||
|---|---|---|---|---|---|---|---|---|
| Tissue/stress | Total network | Drought | Cold | Osmotic | Flood | ABA | JA | |
| Root | Nodes | 13 695 | 2970 | 5005 | 6311 | 2347 | 7460 | 7565 |
| Edges | 26 269 920 | 1 686 453 | 3 637 333 | 6 286 236 | 895 590 | 8 363 871 | 9 629 038 | |
| Shoot | Nodes | 13 717 | 8809 | 3688 | 5280 | 5791 | 7546 | 5523 |
| Edges | 29 180 730 | 14 425 817 | 2 430 142 | 4 956 792 | 5 793 144 | 9 582 721 | 5 320 944 | |
Number of DEGs across various conditions in the HRR-100 network
| HRR-100 | ||||||||
|---|---|---|---|---|---|---|---|---|
| Tissue/stress | Total network | Drought | Cold | Osmotic | Flood | ABA | JA | |
| Root | Nodes | 13 695 | 2970 | 5005 | 6311 | 2347 | 7460 | 7565 |
| Edges | 2 138 990 | 130 207 | 352 715 | 353 129 | 63 630 | 463 175 | 466 528 | |
| Shoot | Nodes | 13 717 | 8809 | 3688 | 5280 | 5791 | 7546 | 5523 |
| Edges | 2 272 758 | 657 747 | 178 198 | 303 953 | 335 654 | 500 651 | 321 672 | |
Network clustering with Weighted Gene Co-Expression Network Analysis (WGCNA)
Co-expressed gene clusters often point to coordinated biological processes and help in reducing the dimensionality of the data. For this purpose, a ‘signed’ co-expression network is constructed with 13 695 and 13 717 DEGs from root and shoot tissues, respectively. The unsigned networks use the absolute value of correlations, |${\rm{s}}_{{\rm{unsigned}}}^{{\rm{ij}}} = \left| {{\rm{cor}}\left( {{{\rm{x}}_{\rm{i}}},{{\rm{y}}_{\rm{j}}}} \right)} \right|$|, and are unable to distinguish between gene activation (sijunsigned = 1) and gene repression (sijunsigned = 1), leading to the loss of biological information (32). Hence, here we construct a signed co-expression network, considering the ‘sign’ of correlation between expression profiles of genes and the similarity measure, in this case, is defined as follows:
where xi and yj are the expression profiles of genes i and j across the samples. Here, sijsigned = 1 corresponds to positive correlation, sijsigned = 0 corresponds to negative correlation and sijsigned = 0.5 corresponds to no correlation, thereby distinguishing between positively and negatively correlated genes.
The function block-wiseModules in the WGCNA R package is used for hierarchical clustering of genes using the Dynamic Tree Cut approach (33), with maximum block size = 14 000, minimum module size = 50, ‘cut height’ = 0.995 and ‘deep split’ = 2. The tissue-specific network parameters are given in Table 5. Here, for a weighted network, β is the soft thresholding power to which co-expression similarity is raised to calculate adjacency, thereby emphasizing high correlations at the expense of low correlations. And k refers to the connectivity or sum of the connection strengths with other genes in the network. The weighted topological overlap matrix in WGCNA allows us to compute various degree centrality measures, which can be useful in screening important genes. Specifically, we computed the kIM, the within-module degree or intra-modular connectivity of a gene in the respective co-expressed module.
Summary of parameters used for the construction of the signed, weighted gene co-expression network using the WGCNA R package
| Tissue | No. of samples | No. of genes | β cut-off | R2 scale-free fit | Mean k | Median k | Max. k | No. of modules |
|---|---|---|---|---|---|---|---|---|
| Root | 69 | 13 695 | 26 | 0.91 | 15.4 | 8.7 | 151 | 22 |
| Shoot | 72 | 13 717 | 26 | 0.81 | 36.4 | 18.2 | 262 | 18 |
| Tissue | No. of samples | No. of genes | β cut-off | R2 scale-free fit | Mean k | Median k | Max. k | No. of modules |
|---|---|---|---|---|---|---|---|---|
| Root | 69 | 13 695 | 26 | 0.91 | 15.4 | 8.7 | 151 | 22 |
| Shoot | 72 | 13 717 | 26 | 0.81 | 36.4 | 18.2 | 262 | 18 |
The co-expressed modules (22 for root and 18 for shoot) are tested for their biological relevance. To that end, the genes of the individual clusters are submitted for over-representation analysis in the Gene Ontology (GO) consortium using the PANTHER classification system (v14.0) (34) for O. sativa. Results with Fischer’s exact test and the Bonferroni correction for multiple testing (P-value < 0.05) are retrieved for each module. Significant GO terms indicate that genes of a given cluster are more often associated with certain biological functions than what would be expected in a random set of genes. Furthermore, we queried the top 100 highly connected genes (based on intra-modular connectivity) in an independent database, STRING DB (35), to check for protein–protein interactions. The percentages of DEGs across modules and results from the functional databases (GO and STRING DB) are discussed in detail in Supplementary File 1.
Server implementation and Graphical User Interface (GUI)
Visualization and interpretation of large-scale data sets to study the emergent properties of complex biological processes with functional annotations across the molecular hierarchy has become an indispensable task for the scientific community. With this objective, we have developed NetREx, the web-based network querying and visualization resource (Figure 1). Using NetREx, one can view relationships between query genes and analyse them based on different supported visualizations like the Network Viewer, the Network Neighbourhood Viewer and the Expression Viewer. It also provides the option to browse through the complete database based on tissue, modules, stress conditions/hormone treatment and from the Kyoto Encyclopedia of Genes and Genomes Database (KEGG). It is built using Sigma JS(3), a javaScript library dedicated to graph drawing. The backend has been built on Express JS that communicates between the user and the JSON database and allows the handling of all logical computations like identifying the query, fetching and filtering of data from the JSON database that stores the complete graph and extracting relationship between queried genes for the chosen tissue and stress/treatment conditions. Clustergrammer JS is a front-end javaScript library for building heatmap plots in the Expression Viewer and provides interactive visualization features such as sorting and zooming (36). To make the querying efficient and fast, the gene node’s position, size, shape and colour are pre-calculated and stored in JSON files using the Gephi software (34).
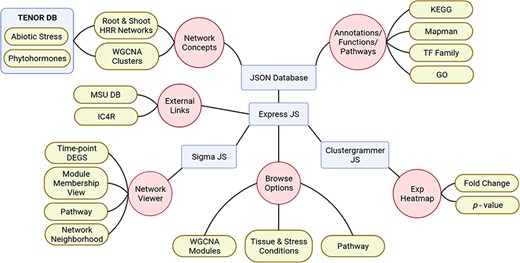
Schematic representation of NetREx architecture, modules and visualizations.
Modules and views
The interface of NetREx is kept simple for ease of use for the biologists. A comma-separated list of gene IDs (in RAP-DB format) can be uploaded or manually pasted. A user may navigate NetREx either by querying a chosen set of genes or by browsing through various modules. In the next section, we discuss in detail various functionalities of NetREx.
Querying NetREx
A user can submit up to a maximum of 300 genes and query their expression profiles across any of the four abiotic stresses, namely, drought, cold, osmosis and flood, and two phytohormone treatments, ABA and JA, for the root or shoot tissue. In the drop-down menu, the user may provide rice RAP-DB IDs. Alternatively, the user may also query using Ensembl Stable IDs for Arabidopsis, wheat (Triticum aestivum), maize (Zea mays), barley (Hordeum vulgare) or sorghum (Sorghum bicolor), and the genes will be mapped to the corresponding rice orthologs based on the Ensembl Plants database (37). The ortholog gene information is extracted using the BioMart RESTful services for all the rice gene IDs using the ‘wget’ option (https://www.ensembl.org/info/data/biomart/biomart_restful.html). The option of querying orthologous genes in NetREx allows the user to investigate the involvement of genes in other crops under abiotic stress and phytohormone treatments through the interaction networks of their orthologs in rice.
Expression Viewer
Early and late stress-responsive genes are known to have distinct roles in the stress response. At the same time, genes that are ubiquitously differentially expressed across all the stages of plant may have some essential roles (34). Earlier studies have shown tissue-specific roles of stress-responsive genes, indicating that divergence in the expression patterns of DEGs is an important indicator of their functions. Particularly, for uncharacterized genes, stage and tissue-specific expression profiles can give important cues regarding their functions (38). The user can analyse such stress, tissue and time point–specific information through heat maps provided in the Expression Viewer module. For the user-provided gene set, differential expression of genes can be observed based on the fold change and P-values at various time points for the chosen stress and tissue. The user is also provided with the option to sort the ordering of genes or time points in the heatmap based on the expression value, thus allowing to observe general trends across them.
Network Viewer
This module displays connectivity between query genes in different stress/treatment conditions and tissue types at different time points. The panel on the right provides various functionalities and colouring schemes to assess the relevance of the nodes. The size of the node is drawn proportional to its connectivity, i.e. the larger the node, the higher is its connectivity. Also, two different shapes are used for the nodes, ‘circle’ for genes and ‘triangle’ for TFs. In the ‘default view’, a gradient colouring scheme based on the degree of nodes is displayed. Thus, the darker the node colour, the higher is its degree, i.e. connectivity. Owing to the dense nature of the network, the arrangement of nodes in the area plays an important role in how the network is inferred. Thus, to make highly connected gene nodes appear together and unrelated nodes drift apart, a force-directed algorithm, ForceAtlas2, has been used. Upon hovering over any node in the network, the respective node and its first neighbours are highlighted. The nodes may also be coloured based on their expression status: ‘red’ or ‘blue’ depending on whether the gene is up- or down-regulated at a chosen time point. Thus, by comparing across different time points, the user can analyse which genes go up or down as a function of time. This functionality helps in identifying ‘early’ or ‘late’ responsive genes. This feature can also be used to compare differential expression of genes across tissues or across different stress/treatment conditions. Another visualization option provided in NetREx is to colour nodes according to their module membership in WGCNA clusters. If the majority of query genes are part of the same co-expressed module, then it is highly likely that they represent the same biological process and based on their up- or down-regulation, we can know whether the process is activated or repressed.
The user may also highlight the genes based on KEGG pathway categories provided in the dropdown menu. Furthermore, to aid in the identification of genes responsive to multiple stress conditions, the user can load other stress conditions from the pull-down menu and view results in a new tab. Additional information, based on ‘Node’ and ‘Edge’ attributes, is provided in a tabular format by clicking on the ‘Show/Hide Table’ button. In the ‘Node’ attributes table, gene attributes, such as gene IDs (RAP-DB and MSU), TF annotations, module membership, gene descriptions and link to IC4R RED (9), are provided. Access to IC4R allows the users to compare gene expression profiles across a larger set of RNA-seq experiments (24 projects) across various growth stages, tissues and conditions. Gene functional annotations, such as GO terms (based on RAP-DB annotations) and pathway annotations from KEGG databases (39) and MapMan (40), are also provided. The fold change and P-values for each gene for every time point for the chosen tissue and stress/treatment condition are given. In the ‘Edge Attributes’ table, PCCs and HRR ranks for each interacting pair are given for the selected tissue-specific network of query genes. Using the right panel of the “Network Viewer” page in NetREx, the user can view up to 100 top neighbours (default = 50) of the query genes based on kTotal (the connectivity in the whole tissue-specific co-expression network) to view the network neighbourhood of query genes. In this view, the query genes are depicted as nodes encircled with a green border.
Browsing NetREx
By modules
In co-expression networks, modules represent highly interconnected clusters of genes. These clusters may often represent coordinated biological processes with conditions/tissue-specific functions. As discussed in the ‘Network clustering with WGCNA’ section, we performed hierarchical clustering using the WGCNA R package to derive 22 co-expressed gene modules for root and 18 for shoot tissues (Table 5). These gene modules can be accessed by clicking ‘Module-wise’ under the ‘Browse’ menu and choosing the tissue and module name from the drop-down menu. On this page, the top 100 highly connected genes based on their within-module connectivity kIM can be viewed on a graded colour scale, based on the ‘colour name’ of the module. The top 100 genes of the module are also listed in tabular format along with their node and edge attributes, functional annotation (from GO, MapMan and KEGG) and GO enrichment. For a given module in a tissue-specific network, these genes represent the core components whose functions may be representative functions of the respective module. Furthermore, GO enrichment terms for ‘biological processes’ are provided with the fold enrichment and False Discovery Rate (FDR) values to infer the overall function of the co-expressed functional cluster.
By conditions
To explore important stress-responsive genes, the user can browse NetREx ‘Condition-wise’. On selecting the tissue and stress/hormone treatment, the user can fetch the list of DEGs (in tabular format) for the corresponding tissue and condition (Table 3). The tables containing gene information and link to IC4R expression database, gene function (GO, MapMan and KEGG) and fold change along with P-value across time points are provided. The fold change tables can be sorted by the fold change or P-value to identify the most significant up- or down-regulated genes for the chosen condition at different time points.
By pathways
This is one of the attractive features of NetREx by which hierarchical KEGG pathways can be explored. After selecting the appropriate tissue and condition, the user may select a certain pathway of interest. Genes of the selected pathway that are DEGs for at least two time points (for the chosen stress/treatment condition) can be filtered for further network analysis.
Discussion
Querying NetREx: a case study
To illustrate the efficacy of NetREx, we consider a set of drought-responsive genes in rice. The selected genes belong to the ABA signalosome complex comprising pyrabactin resistance (PYR)/pyracbactin resistance-like (PYL) receptors, protein phosphatase 2Cs (PP2Cs), SNF1-related protein kinase 2 (SnRK2) and ABF/bZIP TFs, obtained from the KEGG database (pathway ID: dosa04075) (41, 42) for this case study. The ABA signal transduction pathway is one of the key mechanisms by which plants respond to environmental stresses like drought. Several studies indicate that the central signalling module comprises three protein classes: PYR/PYL/regulatory component of ABA receptor (RCARs) proposed to be the ABA receptors and the regulatory proteins, namely, PP2Cs which act as negative regulators together with SnRKs which are positive regulators (Figure 2). An increase in ABA levels during stress leads to the PYR/PYL/RCAR–PP2C complex formation causing inhibition of PP2C activity, thereby allowing activation of SnRKs which target the functional proteins, such as membrane proteins, ion channels and TFs, and facilitate transcription of ABA-responsive genes. Thus, network-based resources such as NetREx can enable us to query the coordinated interactions of regulatory genes and their functional targets which further trigger downstream processes.
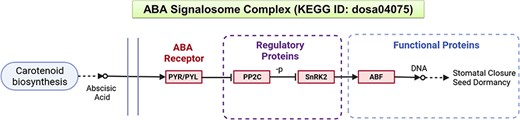
A schematic representation of the ABA signalling pathway from the KEGG database.
A total of 41 rice genes from KEGG (pathway ID: dosa04075) are queried in NetREx in ‘root’ and ‘shoot’ tissues under ‘drought’ stress. Of these 13 and 17 genes, respectively, mapped to the root and shoot networks (Table 6). The filtered gene sets (13, 17) are a union of DEGs across all time points for the chosen condition (drought) and tissue (root and shoot). The ‘invalid genes’ on the other hand either have very low expression values or are not differentially expressed in at least two time points and hence were not considered in the network construction in NetREx (Table 2).
Shoot- and root-specific subnetworks of the ABA signalosome complex extracted using NetREx under drought stress
| RAP-DB ID | Gene name | Component of the ABA signalosome | Degree |
|---|---|---|---|
| Shoot network | |||
| Os09g0325700 | OsSIPP2C1 | PP2C phosphatase | 7 |
| Os01g0583100 | OsPP2C06 | PP2C phosphatase | 6 |
| Os03g0268600 | OsPP2C30 | PP2C phosphatase | 6 |
| Os05g0537400 | OsPP2C50 | PP2C phosphatase | 6 |
| Os01g0656200 | OsPP2C08 | PP2C phosphatase | 5 |
| Os01g0869900 | SAPK4 | SnRK2 protein kinase | 5 |
| Os02g0766700 | OsbZIP23 | bZIP TF | 5 |
| Os06g0211200 | OsAREB1 | bZIP TF | 2 |
| Os07g0622000 | SAPK2 | SnRK2 protein kinase | 1 |
| Os05g0213500 | OsPYL5 | ABA receptor | 1 |
| Os01g0867300 | OsbZIP10 | bZIP TF | 1 |
| Os02g0551100 | SAPK6 | SnRK2 protein kinase | 1 |
| Os01g0813100 | HBF2 | bZIP TF | 0 |
| Os10g0564500 | SAPK3 | SnRK2 protein kinase | 0 |
| Os03g0390200 | SAPK1 | SnRK2 protein kinase | 0 |
| Os05g0437700 | OsbZIP40 | bZIP TF | 0 |
| Os02g0255500 | OsPYL3 | ABA receptor | 0 |
| Root network | |||
| Os01g0656200 | OsPP2C08 | PP2C phosphatase | 7 |
| Os09g0325700 | OsSIPP2C1 | PP2C phosphatase | 7 |
| Os05g0537400 | OsPP2C50 | PP2C phosphatase | 7 |
| Os03g0268600 | OsPP2C30 | PP2C phosphatase | 7 |
| Os01g0583100 | OsPP2C06 | PP2C phosphatase | 5 |
| Os01g0867300 | OsbZIP10 | bZIP TF | 5 |
| Os02g0766700 | OsbZIP23 | bZIP TF | 5 |
| Os06g0211200 | OsAREB1 | bZIP TF | 5 |
| Os02g0255500 | OsPYL3 | ABA receptor | 0 |
| Os02g0551100 | SAPK6 | SnRK2 protein kinase | 0 |
| Os07g0622000 | SAPK2 | SnRK2 protein kinase | 0 |
| Os10g0573400 | OsPYL1 | ABA receptor | 0 |
| Os09g0456200 | OsbZIP72 | bZIP TF | 0 |
In the ‘Expression Viewer’, the fold change of the filtered (valid) genes is displayed as heatmaps, shown in Figure 3. For the root tissue (Figure 3A), it is observed that the majority of the DEGs are strongly up-regulated as early as a 1-h time point. However, at 3 h, a decrease in the fold change is observed which is probably due to transcriptomic and metabolic reprogramming. For the shoot tissue (Figure 3B), it is observed that most genes are not induced at a 1-h time point, but gradually the fold change increases at later time points. This indicates that response to drought stress is induced in the root tissue earlier compared to the shoot tissue.
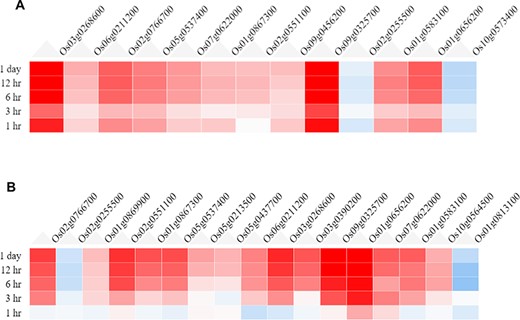
Heatmaps from the Expression Viewer for (A) the root tissue and (B) the shoot tissue under drought stress. The figure depicts transcriptional changes across time points after drought stress with genes having high positive fold change and those in blue having high negative fold change with respect to control (0 h, no stress).
Using the ‘Network Viewer’ module in NetREx, the user can observe stress and tissue-specific view of the HRR-100 network. The expression status of the queried genes can be viewed in a time-specific manner by choosing the time points of 1 (default), 3 h, 6 h, 12 h and 1 day. In Figure 4, the ‘default view’ indicates that among the 13 and 17 DEGs that mapped to the drought HRR-100 network in the root (Figure 4A) and shoot (Figure 4B), respectively, 8 genes are seen to form the largest connected component in both these networks. Figure 5 shows the connectivity information between genes, using the colour coding scheme: up- regulated (red) and down-regulated (blue) genes at 1 h, 3 h and 1 day. For example, in the shoot network, the high-degree gene OsSIPP2C1 is observed to be up-regulated at 3 h of stress, while it is up-regulated even earlier at 1 h in the root network. Interestingly, it was observed in previous studies that OsSIPP2C1 is negatively regulated by ABL1 which is involved in abiotic stress and panicle development in rice (43). In the root network, the components are more tightly connected with the PP2Cs, namely, OsSIPP2C1, OsPP2C50, OsPP2C30 and OsPP2C08, with the highest degree genes interacting with the TFs OsAREB1, OsbZIP23 and OsABF1. Also, most of the genes are up-regulated at 1 h time point (Figure 5) and are probably early response genes in the root tissue, except OsAREB1, which seems to be a late response gene activated only at 6 h. For the shoot network, the response is delayed as discussed earlier, and the SNRK2 protein kinase, SAPK4, is not induced until 12 h. While the majority of the valid genes are up-regulated in shoot and root, a few genes are observed to be down-regulated. These include OsPYL3 (Os02g0255500), down-regulated both in root and shoot tissues. Indeed, this gene has been shown to be down-regulated in drought-susceptible rice genotype under abiotic stress conditions, while over-expression of this gene in Arabidopsis led to improved tolerance in cold and drought stress conditions (44). The shoot-specific TF HBF2 is also down-regulated in the shoot network (6 h, not shown in the figure), while the root-specific OsPYL1 gene is down-regulated at 1 h in the root network (Figure 5A). Among the 13 root and 17 shoot genes, 11 genes are common and differentially expressed in the two tissues. Interestingly, all the five 2C protein phosphatase (PP2C) proteins are common to both root and shoot, indicating their ubiquitous role of the negative regulation of ABA (via SnRK2s and PYR/PYL/RCARs) in both the tissues (45). However, in terms of the network concepts, connectivity between the common gene sets differ between the two tissues as observed in Figure 4. Among the six shoot-specific DEGs, the bZIP TF HBF2 has been shown to be highly expressed in shoot apical meristem (46). On the other hand, the root-specific gene OsPYL1 was shown to interact with OsABIL2 that has a role in root development (44).
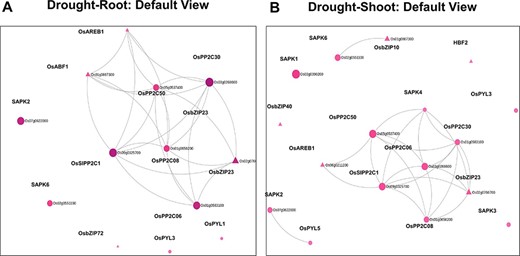
Default views for the Network Viewer from (A) the root tissue and (B) the shoot tissue under drought stress.
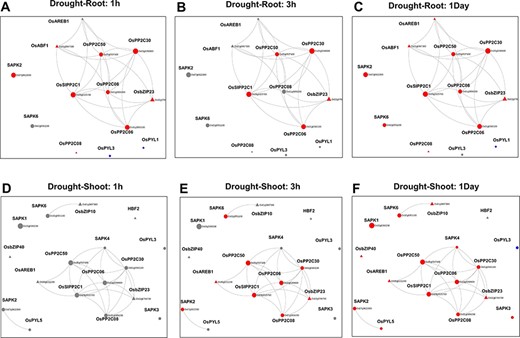
Time point–specific views from the Network Viewer for root tissue at (A) 1h, (B) 3h, (C) 1day and shoot tissue at (D) 1h, (E) 3h and (F) 6h. The figure provides a comparative view of the transcriptional changes for the different time points along with tissue-specific gene connectivities.
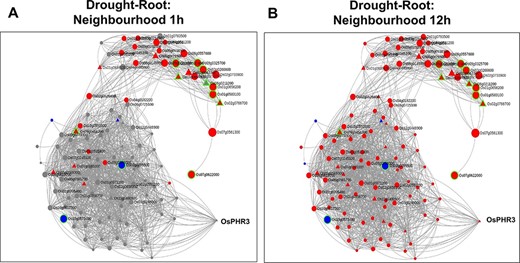
Time point–specific views for the extended neighbourhood for root-specific genes at (A) early time point of 1 h and (B) late time point of 12 h under drought stress.
Clusters of co-expressed genes often represent coordinated biological processes. The analysis of gene co-expression networks has been helpful in functional annotation of uncharacterized genes (38, 47), prioritization of candidate genes (48, 49) and inferring biological processes, e.g. metabolic pathways (50, 51), stress response mechanisms (52, 53) and cell wall metabolism (54, 55). For example, out of the 13 genes in the root network, 8 genes belong to the root-specific Magenta module, as shown in Figure 6. Incidentally, they also form the largest component in the network (Figure 6A). The remaining five genes with zero degree belong to GreenYellow, Yellow (two genes), Blue and the Brown module. To obtain further details on the root-specific Magenta module, we use the ‘Browse’ option in NetREx for the ‘Root’ tissue. Some of the significant GO terms include ‘regulation of transcription, DNA-templated’ (GO:0006355, FDR = 8.56e-04) and ‘abscisic acid-activated signaling pathway’ (GO:0009738, FDR = 7.64e-03), indicating the relevance of the Magenta module in drought stress. Similarly, for the shoot network, out of 17 genes, 8 belong to the shoot-specific Turquoise and 4 to the shoot-specific Salmon modules. The Salmon module harbours genes are involved in Dephosphorylation (GO:0016311, FDR = 1.98e-02), while the Turquoise module is involved in a number of stress-responsive processes including Endoplasmic reticulum (ER)-associated misfolded protein catabolic process (GO:0071712, FDR = 8.83E-03) and regulation of response to stress (GO:0080134, FDR = 3.51e-05). The Module Viewer allows further exploration of genes belonging to the respective modules. For example, the above analysis indicates that genes of the root-specific Magenta module maybe biologically relevant for drought stress. On exploring the top 100 highly connected genes of the module, we see several known TF family genes like bZIPs and HSFs that are important hubs of this module. Along with these, several ‘Conserved hypothetical proteins’ lacking detailed functional annotations are also part of the hubs. The associations of these genes with known TFs can be further queried in NetREx along with their expression profiles across different conditions and different tissues (IC4R Expressions).
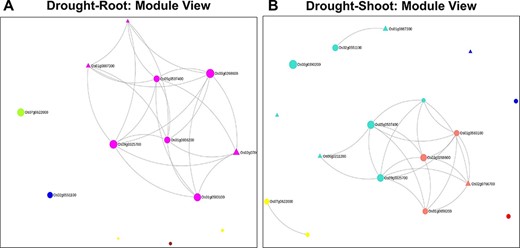
Module views of the Network Viewer for (A) the root tissue and (B) the shoot tissue under drought stress.
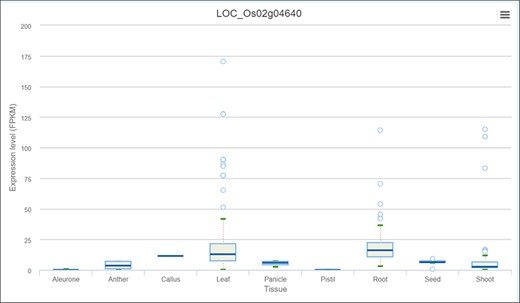
Expression profile of OsPHR3 from IC4R across different tissues and developmental stages.
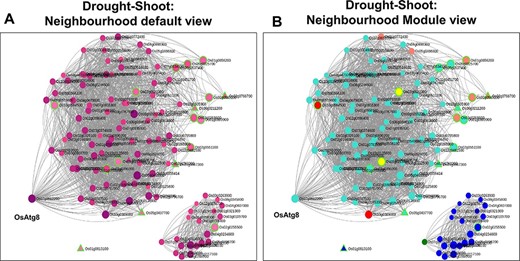
Neighbourhood View of 17 shoot-specific genes with (A) default view and (B) module views under drought stress.
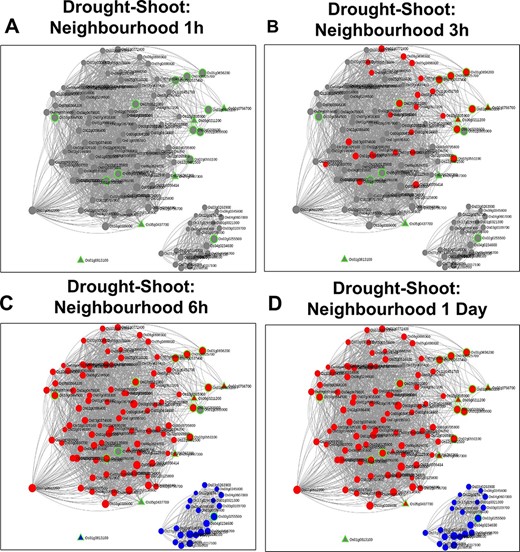
Time point–specific views for the extended neighbourhood for shoot-specific genes at early time points (A and B) and late time points (C and D).
In systems biology, network neighbourhood analysis is an important aspect as it facilitates a ‘guilt-by-association’ strategy by which we can find interesting genes which are closely interacting/co-expressed with the initial ‘seed genes’. In the “Network Neighbourhood View” on the right panel, the top 100 neighbours based on kTotal, the connectivity in the whole network, of the 13 root-specific seed genes are fetched. The ‘seed genes’ are encircled in green to distinguish from other neighbourhood genes in Figure 7A. To infer the overall function of the subnetwork (13 query genes and their respective 100 neighbours), we performed GO enrichment analysis. As expected, the positive regulation of the ABA-activated signalling pathway (GO:0009789, FDR = 9.50E-03) was the most enriched term. Two major clusters are clearly discernible (Figure 7B) in this subnetwork. The first set consists of neighbourhood genes that majorly belong to the Magenta module (16 genes), and these genes are in fact up-regulated as early as 1 h of drought stress (Figure 8A). As indicated earlier, the Magenta module is involved in the ABA signalling and stress-responsive pathways. The other cluster consists of most genes belonging to the Blue and Red modules. These sets of genes are late response genes that are over-expressed as a result of downstream cellular and metabolic adjustments after the signalling components have been induced in the early time points (ABA signalling; Figures 2 and 8B). The Blue module includes stress-responsive genes that aid in the autophagy of damaged proteins and cellular organelles (GO:0044805, FDR = 6.74E-03) (56). The Red module harbour genes involved in the methylerythritol 4-phosphate pathway of the isoprenoid biosynthetic process leading to the production of carotenoids and various other secondary metabolites (GO:0019288, FDR = 1.32E-03).
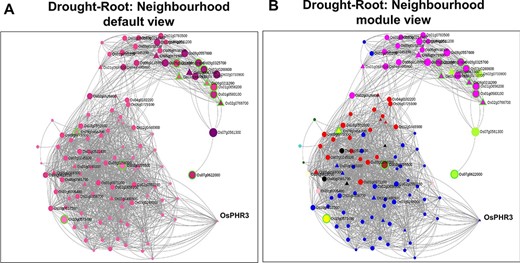
Neighbourhood View of 13 root-specific genes with (A) default view and (B) module views under drought stress.
As discussed earlier, network neighbourhood helps us explore novel candidate genes that are absent in the initial query gene set. For example, the gene with the highest kTotal (weighted connectivity of a gene in the whole root network) is the TF OsPHR3 (Os02g0139000) implicated in low Pi stress and in regulating nitrogen homeostasis (57). To explore the transcriptomic dynamics of this gene in other stress conditions, we queried in NetREx again. Using the option to check the expression profile in ‘other conditions’ provided on the right panel in the ‘Network Viewer’, we observed that this gene is up-regulated in osmotic stress (3–6 h), flood stress (1 h), ABA (1 h to 1 day) and JA (1 and 3 h), while it was down-regulated in osmotic stress at 12 h, flood stress (3–6 h) and JA (6 h to 1 day). Additionally, to explore the expression of this TF across rice growth stages and tissues, we used the IC4R link in the ‘Nodes Description’ table. From Figure 9, it may be noted that OsPHR3 exhibits higher expression in root and leaf tissues. On scanning the upstream 1 kb of this gene using the PlantPan v2.0 database (58), we observed several bZIP binding motifs, especially in the 500-kb upstream region (Supplementary Figure S1A). Furthermore, concurrent with this, several binding sites for WRKY TFs were also detected in and around the same region, indicating that this TF may also be a target of biotic stress signalling cascades (Supplementary Figure S1B; Supplementary Table S8). The network neighbourhood view of OsPHR3 was next explored. All its neighbours are observed to be up-regulated at 6 h in the root tissue under drought stress, all of them belong to the Blue module (Supplementary Figure S2A and B). Moreover, the top 10 neighbours are involved in functions like transferring phosphorus-containing groups, carbon–nitrogen ligase activity as well as drought and biotic stress (Supplementary Table S8). A literature survey revealed that this TF has not been functionally characterized in multiple stress conditions such as drought and warrants further investigation.
A similar analysis was carried out with 17 shoot-specific DEGs, and the Network View is shown in Figure 10A. It may be noted from the module view in Figure 10B that the majority of the genes belong to the shoot-specific Turquoise module, while a separate cluster is formed by genes of the Blue Module. Some of the most significant functions of the subnetwork include protein serine/threonine phosphatase activity (GO:1905183, FDR = 6.58E-03), ABA signalling (GO:0009789, FDR = 8.95E-03) and cellular response to nitrogen starvation (GO:0006995, FDR = 1.28E-03). Here, the gene with the highest kTotal is OsAtg8 (Os07g0512200), which is a well-characterized gene involved in autophagy and protein degradation (59). However, the role of this gene with respect to drought is yet to be explored. An important point to be noted is that we extracted the extended root and shoot networks under drought stress using the same ‘seed’ genes involved in ABA signalling. Needless to say, both the subnetworks had GO terms enriched for ‘abscisic acid-activated signaling pathway’ (GO:0009738), ‘regulation of response to water deprivation’ (GO:2000070) and ‘cellular response to hormone stimulus’ (GO:0032870). However, more specific tissue-specific GO terms like ‘photosynthesis and dark reaction’ (GO:0019685, FDR = 3.15E-02), ‘gluconeogenesis’ (GO:0006094, FDR = 3.60E-03) and ‘cellular response to nitrogen levels’ (GO:0043562, FDR = 4.21E-05) for the shoot tissue and ‘cellular response to reactive oxygen species’ (GO:0034614, FDR = 3.57E-02) and ‘fatty acid oxidation’ (GO:0019395, FDR = 5.41E-03). for the root tissue were noted. Another major difference in the ‘Neighbourhood View’ of these genes in root and shoot tissues is the presence of down-regulated genes in the shoot network as compared to the root network and the gradual activation/repression of these genes in the shoot network (Figure 11A–D) in contrast to the root network (Figure 8A and B). The down-regulated genes in shoot (21 genes) majorly belong to the ‘Blue’ module (Figure 10B) with at least 6 genes annotated to be involved in photosynthesis, indicating that this process is preferentially switched off in the green tissues under drought stress. Further exploration of the ‘Blue’ module of the shoot HRR network using the ‘Browse Module Wise’ page in NetREx (https://bioinf.iiit.ac.in/netrex/module.html) revealed several interesting shoot-specific GO terms like ‘photosystem II repair’ (GO:0010206, FDR = 9.62E-04), ‘photosystem II assembly’ (GO:0010207, FDR = 4.41E-03) and ‘regulation of photosynthesis, light reaction’ (GO:0042548, FDR = 3.80e-03). Adverse effects of abiotic stress conditions like drought on the photosynthetic machinery with harmful effects on the overall growth and yield of the crop are well documented (60, 61). This confidently explains the functional differences of the root and shoot subnetworks from the extended ABA signalosome analysis discussed earlier. Moreover, the expression profiles of the genes across time points and their corresponding tissue-specific network connectivities enable one to confidently explore the temporal and functional space of the genes and arrive at relevant conclusions.
Conclusion
NetREx is a freely accessible web server for biologists to conveniently explore the global rank-based stress networks in a tissue-specific manner. The resource has been constructed using high-quality RNA-seq data from the TENOR database generated using homogeneous experimental protocols. In NetREx, substantial emphasis has been given to explore the networks through various perspectives such as exploring gene expression profiles (Expression Viewer heatmaps and Network Viewer in a time point–specific manner), network connectivity (Network Viewer and Neighbourhood Viewer), identification of novel stress-responsive candidates (Neighbourhood Viewer), functional analysis of genes (browsing NetREx by modules and pathways) and comparative analysis across stress conditions (supported in the Network Viewer mode). The gene attributes displayed in the different modules have been extensively cross-linked to various other resources to provide additional information to the users. Our analysis indicates that the rank-based networks in NetREx are biologically relevant wherein the tissue and stress-specific information is effectively retained. Network-based subnetwork analysis and gene prioritization using NetREx will therefore be a significant resource to study complex phenotypes associated with the stress response in rice.
Supplementary data
Supplementary data are available at Database Online.
Conflict of interest
The authors declare no conflict of interest.
References
Author notes
contributed equally to this work.
