


Abstract
This article reports on a detailed investigation of PubMed users’ needs and behavior as a step toward improving biomedical information retrieval. PubMed is providing free service to researchers with access to more than 19 million citations for biomedical articles from MEDLINE and life science journals. It is accessed by millions of users each day. Efficient search tools are crucial for biomedical researchers to keep abreast of the biomedical literature relating to their own research. This study provides insight into PubMed users’ needs and their behavior. This investigation was conducted through the analysis of one month of log data, consisting of more than 23 million user sessions and more than 58 million user queries. Multiple aspects of users’ interactions with PubMed are characterized in detail with evidence from these logs. Despite having many features in common with general Web searches, biomedical information searches have unique characteristics that are made evident in this study. PubMed users are more persistent in seeking information and they reformulate queries often. The three most frequent types of search are search by author name, search by gene/protein, and search by disease. Use of abbreviation in queries is very frequent. Factors such as result set size influence users’ decisions. Analysis of characteristics such as these plays a critical role in identifying users’ information needs and their search habits. In turn, such an analysis also provides useful insight for improving biomedical information retrieval.
Database URL:http://www.ncbi.nlm.nih.gov/PubMed
Introduction
In biomedical research, new knowledge is primarily presented and disseminated in the form of peer-reviewed journal articles. Searching through literature to keep up with the state of the art is a task of increasing difficulty for many individual biomedical researchers. The challenge is ever increasing, both in the scope of topical coverage and in the fast-growing volume of biomedical literature (1). New and expanding areas of research are being reported in a growing number of journals (2). Meanwhile, expansion of the Internet and of broadband technologies is providing users with faster and easier access to online resources. The end result is an exponential increase in access to literature through the Web. With this growth in access comes an increasing demand for online biomedical reference databases. PubMed, a free Web service provided by the US National Library of Medicine (NLM), provides daily access to over 18-million biomedical citations for millions of users.
Finding citations relevant to a user’s information need is not always easy in PubMed. As illustrated in Figure 1, during a typical session of online search activity, the users convey their information need through a query or sometimes a series of queries (e.g. revised queries). These expressions of information need are always a compromise between what the users understand about their need, what the users understand about the system they are using, and what the system ‘understands’ about users (3). Thus, a primary goal of this work is to understand as much as we can about the growing population of PubMed users, their information needs and the ways in which they meet these needs. Improving our understanding of users strategies—both successful and not—opens opportunities to improve information services and information access provided by PubMed.
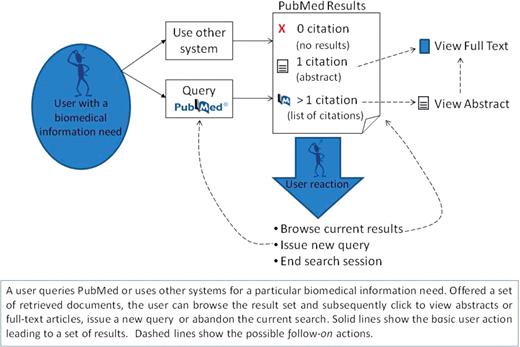
An overview of user interactions with PubMed. A user queries PubMed or uses other systems for a particular biomedical information need. Offered a set of retrieved documents, the user can browse the result set and subsequently click to view abstracts or full-text articles, issue a new query or abandon the current search. Solid lines show the basic user action leading to a set of results. Dashed lines show the possible follow-on actions.
One resource for understanding and characterizing patrons of Web services are the transaction logs of Web servers. For Web search in particular, there is growing interest in using these logs for research (4,5). Web logs can capture a number of informative aspects of a user’s interaction, including timing, query term selection and paths taken through a Web site. The study of logs and users’ interactions with the interface enables researchers to identify key points in the design of the resources. Understanding user habits and the problems that users encounter aids in the development of more effective systems.
In this article, we present an investigation of user interactions observable through one month of PubMed logs. The user behaviors studied in this work include issuing search queries, browsing through pages of the retrieved results, viewing abstracts and clicking links to full-text articles. Taken together, these activities are representative of over 80% of user interactions with PubMed. To the best of our knowledge, this is the first study of PubMed users’ search and retrieval behavior of this kind.
Related work
Query log analysis is emerging as a new area of research for many applications (4,6,7). Reports based on search log statistics fall in a variety of categories. However, most reports are examinations of logs from large Web search engines such as AltaVista, eXcite, AOL and MSN. These all suffer from a limitation of covering the broadest scope of topics imaginable, anything on the Internet. A handful of studies have investigated specific verticals of search (8,9) but few have done so on any large scale. Only one, to our knowledge has focused on PubMed use on a large scale (10). Herskovic et al. conducted a pioneering study of a typical day of PubMed log data. They reported several metrics such as the number of queries, number of users, queries per user, terms per query and results set sizes. However, their work was limited to a single day of data and was based on only the analysis of PubMed queries. The work we present in this article significantly differs from Herskovic et al. in two aspects. First, we investigate a much longer timeframe (one month). Second, we analyze a richer set of data that includes both queries and clicks on links to view documents (abstracts and full text).
There are a number of approaches to evaluate search engines, digital libraries and user behaviors. They span a spectrum from detailed qualitative study of a handful of users, to quantitative studies of large-scale network traffic. A broad range of methods have been used for data collection and analysis, with an equally broad range of goals. Some studies aim at evaluating the impact factor (11), or collection quality and system usability (12–15), others aim at evaluating models of the human sense-making process (16–19) and collaborative work (20,21). Individual users are frequently studied through the use of video recordings and stimulated recall (22,23) or surveys (24). Eye-tracking and path analysis have also been useful techniques for studying the flow of attention (25–28) and preferences of users while searching (29) and browsing (30–32). A full understanding of users’ interactions with any information source requires in-depth investigation from multiple perspectives (33,34). Our work offers characterizations of one population of users—specifically users of PubMed. What we present is an analysis of biomedical search behavior on a scale not previously explored.
Because Web interactions are stateless transactions (meaning the state of each machine—and hence its user—are undetermined) exact definitions of what constitutes a ‘search session’ are elusive. A standard approach is to take all interactions from a single browser on any given day to be a single session (35–37). Intuitively, the notion of a session of activity fits quite well with one’s vision of the user sitting down at a computer and entering search terms. However, information search is often a task embedded in another activity, and identifying clear boundaries to a search ‘session’ can be difficult in any sense of the word. Exactly where a session starts and stops may be less important than the sequence of actions it must contain. Jansen and Spink have written extensively on the subject of search sessions (38). A number of notable approaches to ‘identifying’ a session have included time based clustering and semantic analysis of shifts in topics (39,40). Hybrid approaches that use time and semantics have also been explored (41,42). Other approaches include server based analysis of session frequencies (43) and are primarily focused on traffic handling for better user experiences. In this work we take a broad view of sessions and follow the convention of treating all actions from one user within each 24 h period as a single session.
Behavioral models are gaining popularity as a field of study in Web based search (44,45). Downey et al. (46) proposed a framework for modeling features in sequences of a user’s actions during search. Silverstein et al. (47) discovered consistent characteristics among Web search users that differed sharply from usage behavior in other online search domains. Bates (48) has conducted qualitative analysis of Digital library users’ interactions. Her work extends a detailed conceptual model of how a user ‘berry-picks’ their way through an information landscape (48,49). An interesting parallel is offered by Pirrolli et al. (50,51) who find that interaction behaviors in information search follow some of the foraging principles described by Stephens and Krebs (52). Biomedical search is characteristically different from general Web search (53) and expert biomedical searchers may provide important clues about successful information behaviors. Our work presented here provides a valuable background for future investigations of stochastic models [e.g. (54,55)] as well as conceptual models [e.g. (46,56–58)].
There are of course many approaches to analyzing search via Web logs, and multiple ways to collect these logs (59). Statistics on a large scale can present interesting views of search (60,61). Several efforts have been made toward identifying users’ intent from queries and query logs (62–64). Some have looked at browsing behavior compared to query behavior (29,65) as a means to identify intent. Taxonomies of user intent have been suggested by Broder (66) and by Rose and Levinson (67) that generally separate the universe of searches into two or three categories of navigational, informational and other. But much richer classification schemes are needed for characterizing queries and query reformulation (68,69). This is particularly true when the topic of search is within a specific professional domain. In Section 0 we present a semantic analysis of PubMed queries that includes a categorization scheme with 16 categories specifically constructed to describe information needs of PubMed users.
Methods
Information in PubMed log files
PubMed logs record user interactions with PubMed such as searches and retrievals. To facilitate log analysis, log data are often first segmented into basic units as user sessions. User sessions in this study were identified using browser cookies. We assume (operationally) that all searches in one user session are related to a single topic (70,71). In the rest of this article we refer to user sessions and users interchangeably.
Of all, the user action types detailed in ref. (35), we focused on three—searches, retrievals of abstracts and retrievals of full text articles. They account for ∼80% of all user interactions in the log files. We examined submitted searches, clicks on links to abstracts (abstract views), and clicks on links to full-text articles (full text views). For each type of user action, corresponding information was extracted from the log files for analysis as illustrated in Table 1.
Illustration of user actions and their corresponding information in log data
| User action | Log information | Examples |
|---|---|---|
| PubMed search | Session IDa | abcd0123456 |
| Timestamp | 2008-03-01T10:32:17 | |
| Search term | Lapierre p | |
| Number of returned citations | 26 | |
| Abstract view | Session ID | abcd0123456 |
| Timestamp | 2008-03-01T10:35:45 | |
| Clicked PubMed identifier | 18197971 | |
| Ordinal position of clicked citation | 1 | |
| Full-text view | Session ID | abcd0123456 |
| Timestamp | 2008-03-01T10:35:49 | |
| Referring URL | http://www.ncbi.nlm.nih.gov/PubMed/18197971?ordinalpos=1 | |
| LinkOut URL | http://www.PubMedcentral.nih.gov/articlerender.fcgi?tool=PubMed |
aAlthough session ID’s are anonymous, we use mock session ID’s in this article.
Information such as timestamp (the exact time of the action) and session identifier were universally present with every user action. Other information was only associated with specific user action types. For a PubMed search, the log entry contained the search term, as well as the number of articles returned by PubMed. For an abstract view, the log entry contained the corresponding PubMed identifier (PMID), the ordinal position of the clicked citation in the result list and the referring URL (the website address where the followed link to the clicked citation originated). For a full-text view, the log entry contained a LinkOut URL (the website address where the corresponding full text article is located) in addition to the referring URL. Table 1 shows an example of three consecutive user actions.
Preprocessing log files
For this study, PubMed logs for the 31 days in March 2008 were gathered. Such a dataset was shown as representative of PubMed activity in our analysis. (In order to investigate the temporal factor and other ephemeral trends, we analyzed same kind of log data for February 2009 and compared its results to those in this article. Detailed comparisons can be seen at the article supplementary website: http://www.ncbi.nlm.nih.gov/CBBresearch/Lu/LogStudy.) This data comprised ∼36 million user sessions. Each user session was defined as any activity within a 24-h period recorded with the same user ID and was identified by a unique ID number stored in a browser cookie, not by IP address. This gives the advantage of identifying multiple unique sessions from behind a proxy or network address translation (NAT) router, which all have the same IP address.
In order to capture the general user behavior, outliers and robot sessions were filtered before analysis. Two heuristic rules were applied to identify and subsequently discard robot sessions. The first rule checked the user-agent information from the user browser against a list of known browser types (e.g. Mozilla). The second rule checked the IP address of the user sessions. If an IP address was associated with more than 10 different user sessions, and over 90% of these sessions were single requests, then these single-request sessions from this IP address were removed from our data. Finally, following the lead of Herskovic et al. (10), we also excluded all sessions with more than 50 requests of the same user action (e.g. searches) in 24 h. After applying these filters, a total of 23 017 461 user sessions remained for the month of March 2008. Hereafter, we refer to this as our dataset.
Semantic analysis of PubMed queries
To identify PubMed users’ information needs, we conducted a semantic analysis of a set of 10 000 randomly selected queries. Specifically, we characterized the content of PubMed queries in terms of different semantic classes. A categorization scheme including 16 categories was developed based on the UMLS® Semantic Groups (72), and based on estimates regarding bibliographic information likely to be of interest to PubMed users. These emergent categories were derived using an iterative process to refine the categorization scheme. Table 2 shows a list of these categories with examples of annotated data.
Illustration of semantic categories for query annotation
| Semantic category | Examples |
|---|---|
| Body part | Small intestine, index finger |
| Cell component | T-Cells, membrane |
| Tissue | Abdominal muscle |
| Chemical/drug | Hypoglycemic agent, aspirin |
| Device | Adhesive bandage, insulin syringe |
| Disorder | Diabetes, ankle fracture |
| Gene/protein | Ptx1, Polyserase 3 |
| Living being | Mouse, Male |
| Research procedure | Real time PCR |
| Medical procedure | Appendectomy |
| Biological process | Apoptosis |
| Title | Understanding PubMed user search behaviors through log analysis |
| Author name | Wilbur w, Mount |
| Journal name | BMC Bioinformatics |
| Citation | 19218484, pp 124–56, 2009 Apr |
| Abbreviationa | DNA, AIDS |
Some of these categories are self-explanatory such as Journal Name or Body Part. Related concepts were included in the same category (e.g. PMID, page numbers and publication date, all provide specific citation information and are annotated collectively under the Citation category). In all cases, we annotated the most specific concept within the query (e.g. ankle fracture: Disorder, rather than ankle: Body Part and fracture: Disorder.)
aAbbreviation is not a semantic class, but we include it here because abbreviations appear frequently in PubMed queries.
Seven annotators with expertise in various areas of biomedicine and/or information science were recruited to annotate the query set. The task was performed using an annotation tool (73) and resources such as MetaMap (74) and the UMLS Knowledge Source Server (http://umlsks.nlm.nih.gov/). This annotation work and other details are described in ref. (75). Annotation results on the 10 000 queries are shown in PubMed Queries section as part of the query analysis.
Results
As shown in Figure 1, users can either search PubMed or use other systems for retrieving citations in PubMed. Based on the analysis of the referring URLs (the web address where the links to abstract views originated), we found that over 80% of retrievals resulted from PubMed searches while the rest were redirected to PubMed from other search engines (e.g. Google) or websites (e.g. Wikipedia.com). The query analysis reported in this paper involves only queries to PubMed and not to other systems.
PubMed user actions
Our dataset contained a total of 58 026 098 searches, 67 093 786 abstract views and 27 581 850 full text views. On average, there were almost 5-million daily requests to PubMed relating to users’ searches and retrievals (abstracts or full text) per day. Of all these requests, abstract views accounted for 44% of the traffic, followed by query searches with 38% and full-text views with 18%, respectively. Table 3 shows the average numbers of requests per day as well as per session. These averages were calculated for all the sessions that had at least one PubMed query or abstract/full-text view. That is, sessions that had no searches or retrievals were excluded from our computation.
Descriptive statistics of PubMed requests after data filtering
| User actions | PubMed queries | Abstract views | Full text views | |
|---|---|---|---|---|
| Total number of user actions in 31 days | 152 701 734 | 58 026 098 | 67 093 786 | 27 581 850 |
| Total number of user sessions in 31 days | 23 017 461 | 13 076 300 | 18 814 955 | 7 722 309 |
| AVG/Day | 4 925 874 | 1 871 815 | 2 164 319 | 889 740 |
| AVG/Session | 6.63 | 4.44 | 3.57 | 3.57 |
The total number of user actions was divided among PubMed Queries, Abstract Views and Full text Views. The total number of user sessions having at least one PubMed Query, or Abstract View or Full text View is shown. On any given day the log data contained an ∼5 million user actions and for each session a user is expected to make more than six requests.
PubMed queries
Users who search more, view more
Figure 2 shows the distribution of queries per user. Approximately 90% of the users issued between 1 and 10 queries when searching PubMed. In particular, 34% of them issued only one query. In Table 4, we show the average number of abstract views and full-text views for users with different search profiles. In general, users who tend to do more PubMed searches within a session are also likely to view more abstracts and full-text articles.
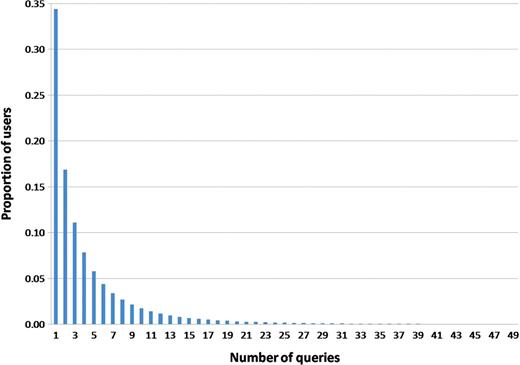
Histogram view of the distribution of users, detailed by number of queries they issue.
Users’ click through interactions detailed by number of queries
| Number of queries | Proportion of Users | Abstract view average | Abstract view median | Full-text average | Full-text median |
|---|---|---|---|---|---|
| 1 | 0.34 | 1.59 | 1 | 0.67 | 0 |
| 2 | 0.17 | 2.72 | 1 | 1.22 | 0 |
| 3–5 | 0.25 | 5.09 | 3 | 2.37 | 1 |
| 6–10 | 0.14 | 6.82 | 4 | 3.25 | 1 |
| 11–20 | 0.09 | 9.55 | 7 | 4.67 | 2 |
| 21–30 | 0.02 | 12.03 | 9 | 6.04 | 3 |
| 31–50 | 0.01 | 16.65 | 15 | 8.64 | 6 |
Of more than 58 million PubMed user queries in our dataset, ∼5 million were abandoned—i.e. there was no other user action in the log in the same session. More than 27 million queries were followed by another query. The remaining 25 million queries were all followed up by retrieval of abstracts or full texts (i.e. result clicks). In these cases, a query was followed by an average of 3.57 retrievals. Considering all of the 58-million queries the average number of clicks is 1.54.
Queries are short
To perform a lexical analysis, user queries were tokenized and normalized to lower case. Tokens were defined as sequences of characters separated by white space. The number of tokens in the queries ranges between 0 and 12 366 (an extreme outlier). The average number of tokens per query is 3.54 and the median is 3. Queries with a large number of tokens are rare: we found that over 80% of all queries had not more than four tokens. Figure 3 shows the distribution of queries according to the number of tokens.
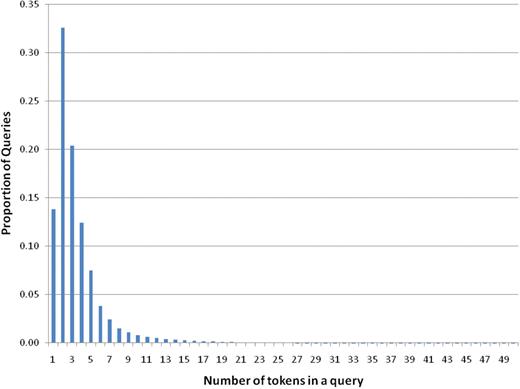
Distribution of number of queries relative to the number of tokens.
Author queries are most frequent
Figure 4 shows the distribution of queries over the 16 categories considered. In our annotation schema queries could be labeled with one or more categories. For example, the query ‘bronchodilators asthma children’ would be annotated with the categories Chemical/Drug (bronchodilators), Disorder (asthma) and Living Being (children).
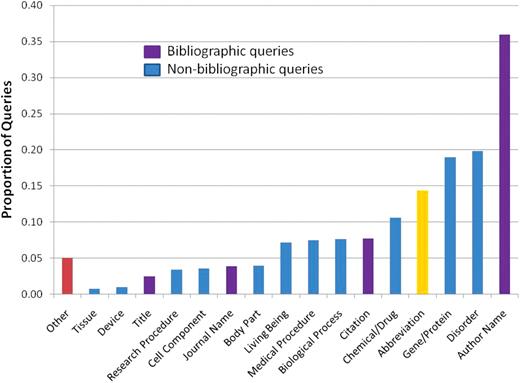
Annotated queries by category. Queries annotated with bibliographic categories (Author Name, Citation, Journal Name and MEDLINE Title) are shown in purple, queries annotated with non-bibliographic categories (Gene/Protein, Disorder, Chemical/Drug, Biological Process, Medical Procedure, Living Being, Research Procedure, Cell Component, Body Part, Device or Tissue) are shown in blue, the percentage of queries containing an abbreviation is shown in yellow, and the queries that could not be fitted in the proposed set of categories are shown in red.
The most frequent category of queries was Author Name (36%). These queries may or may not be associated with the corresponding PubMed tag (e.g. [author], [au]). Overall, 44% of the queries contained bibliographic information (author name, journal name, article title or other citation information such as PMID). In Figure 4, we distinguished the bibliographic query categories from other categories. Next, Disorder (a category including all disease mentions, abnormalities, dysfunctions, syndromes, injuries, etc.) was found to be the most frequently requested type of information (20% of the queries). Gene/Protein (a category listing the gene names, protein names or any mention of other molecular sequences) appeared in 19% of the queries. It is in this category that we also noticed the most frequent use of Abbreviations. Chemical/Drug (a category that lists the names of antibiotics, drugs or any other chemical substance) appeared in 11% of the queries. Some queries were left without annotations. These are shown as Other in Figure 4. We found that 60% of the queries were annotated with only one category or with Abbreviation and one other category. The other 40% appear with two or more categories.
Semantic associations are frequent
Table 5 lists the top 10 most common associations between categories found in queries. We calculated association based on frequency and mutual information (76). In the first case we counted the pairs of categories which appeared most often in our annotations, and in the second case, we computed the mutual information of observing both categories in an annotated query. Although the two rankings are different, both types of pairings give useful information. Specifically, we find that users query about a specific article using Author Name associated with other relevant Citation information (i.e. publication date). Abbreviations are often found to be gene or protein references, as well as disease names, drug names or biological processes. The mutual information list also links Abbreviation with Cell Component and Research Procedure categories. A Gene/Protein query is often associated with concepts such as Disorder, where the user is interested in the specific genetic disorder mentioned, or Biological Process, where the user is interested in the molecular, cellular or other biological aspects at the molecular level.
The most common category associations
| Associations according to frequency | Frequency ratio | Associations according to mutual information (MI) scores | MI score |
|---|---|---|---|
| Abbreviation + Gene/Protein | 0.098 | Journal Name + Citation | 1.905 |
| Author Name + Citation | 0.035 | Abbreviation + Gene/Protein | 1.273 |
| Disorder + Medical Procedure | 0.027 | Tissue + Cell Component | 0.817 |
| Abbreviation + Disorder | 0.026 | Tissue + Body Part | 0.733 |
| Disorder + Gene/Protein | 0.023 | Research Procedure + Living Being | 0.693 |
| Biological Process + Gene/Protein | 0.022 | Biological Process + Tissue | 0.655 |
| Disorder + Chemical/Drug | 0.021 | Medical Procedure + Disorder | 0.585 |
| Journal Name + Citation | 0.020 | Abbreviation + Cell Component | 0.579 |
| Author Name + Gene/Protein | 0.018 | Abbreviation + Research Procedure | 0.571 |
| Abbreviation + Chemical/Drug | 0.016 | Biological Process + Gene/Protein | 0.421 |
Here we list the top 10 associations based on frequency (normalized with respect to total number of queries) and mutual information scores.
Other relevant associations revealed by mutual information include Disorder with Medical Procedure, Research Procedure with Living Being and Tissue with Cell Component or Body Part. Further down the mutual information associations list we also find Medical Procedure with Device. Also apparent in Figure 4, the Device queries were rare, and it is interesting to note that they are strongly associated with Medical Procedures—an observation not possible using frequency analysis alone.
PubMed results
Result set size varies considerably
For each query in our dataset we analyzed the number of citations returned by PubMed. The result set contained an average of 13 798 citations with a median of 17 citations. If we exclude queries that did not produce any results (i.e. results set size = 0) the average result set rises to 17 284 citations and a median of 44 citations. Figure 5 shows a breakdown of the proportion of queries with respect to the number of retrieved citations. Approximately 33% of queries returned <20 citations. In particular, 9.2% of all queries PubMed returned only one citation. In these cases the user is automatically redirected to the abstract view of the article by default. Figure 5 also shows that ∼15% of the queries returned zero citations. Our log analysis revealed that in the majority of cases, PubMed users reacted to these empty result sets by submitting a new query. Data related to users’ reactions is presented in more details in User Reactions section.
Distribution of queries according to their returned result set size. One third of queries returned from 1 to 20 citations, which are displayed in a single page.
Bibliographic queries return fewer citations
Of the queries we annotated, 44% included bibliographic information. In these cases, we infer that the user is looking for one or several particular articles that were written by a specified author(s), or appeared in a particular venue, or were published at a certain time, etc. A bibliographic search is more specific by nature. Therefore, a smaller results set is generally preferred.
By contrast, a non-bibliographic search can be more general. In these cases, users are trying to gather information on a topic of interest. Ideally the system is returning a list of documents that are topically related to the entered query terms. Non-bibliographic queries are expected to have somewhat larger result sets. Similar distinctions between informational or navigational have been made by Broder (66), Rose and Levinson (67) and others.
Figure 6 shows the distribution of queries selected for semantic analysis (see PubMed Queries section) according to the number of citations they returned. The manually annotated queries were divided into two groups: queries with bibliographic information (such as Author Name, Journal Name, Title or other Citation information) and without. The average number of citations returned for a bibliographic query is considerably smaller than that of an informational query.
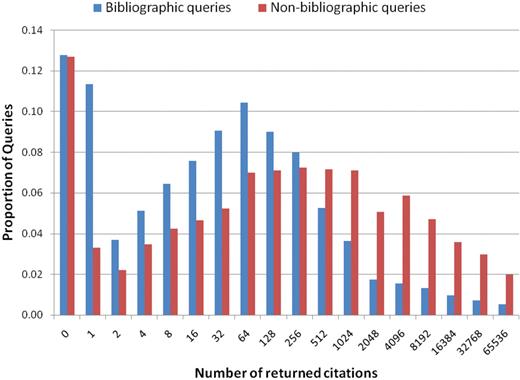
Distribution of bibliographic queries (author name, journal name, title and other citation information) and non-bibliographic queries (disorder, gene/protein, research or medical procedure, device, body part, cell, tissue or living being) according to their result set size.
User reactions
As illustrated in Figure 1, given a set of retrieved citations, users might take three different courses of action: browsing the result set, issuing a new query, or abandoning the search. According to our dataset, the most frequent action was issuing a new query (47%), followed by browsing the result set and viewing selected citations (44%). Users abandoned the search in only 9% of cases.
Most users select citations from the first page
Over 80% of the clicks for abstract views occurred on one of the top 20 citations returned in the result set. That is, most clicks happened on citations in the first result page (by default, PubMed returns 20 results per page). The proportion of each click position in the first page is shown in Figure 7, indicating that PubMed users mostly look at returned result in the top positions (e.g. 28% of clicks happened for the top ranked citation).
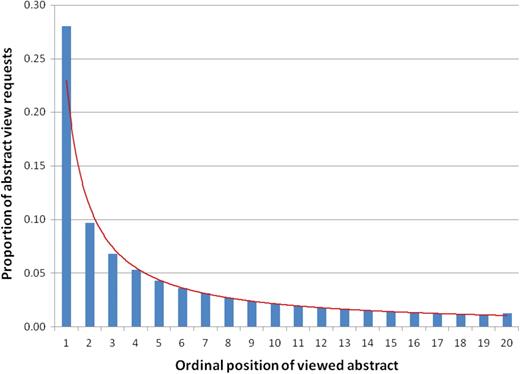
Distribution of abstract view requests for ordinal positions of the first page of results (data follows a Power law shown with the red line).
Users select first and last citations on any page
In fact, the power law distribution is observed on any given results page. Figures 8 and 9 show users’ click preferences beyond the first result page. In both figures, the x-axis shows the ordinal position of the clicked item within the set of retrieved citations. In Figure 8, y-axis shows the total number of clicks that a particular ordinal position has received, while the y-axis in Figure 9 shows the ratio of the total clicks that a particular ordinal position has received normalized by the total number of clicks that the corresponding result set page has received. In other words, the ratio of clicks on ordinal positions 21–40 is normalized against all clicks on the second page of results, positions 41–60 are normalized against all clicks on the third page, etc. Two interesting phenomena are observed: first, the number of clicks for the documents in the later pages degrades exponentially (Figure 8). Second, PubMed users are more likely to click the first and last returned citation of each result page (Figure 9). This suggests that rather than simply following the retrieval order of PubMed, users are influenced by the results page format when selecting returned citations. For example, the following numbers belong to the last three documents of the second page of returned citations; there were 150 584, 153 117 and 175 190 clicks for the 38th, 39th and 40th returned citations, respectively (Figure 8). These numbers correspond to 3.4, 3.5 and 4% of all the clicks that occurred on page 2 of citations (Figure 9). Our finding comports with studies that show similar patterns in eye movements and mouse movements during Web search (27,28,77).
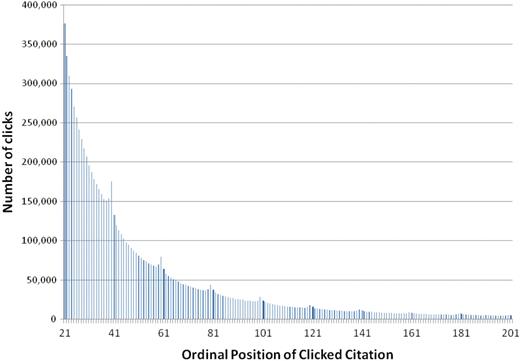
Distribution of abstract retrievals per ordinal position.
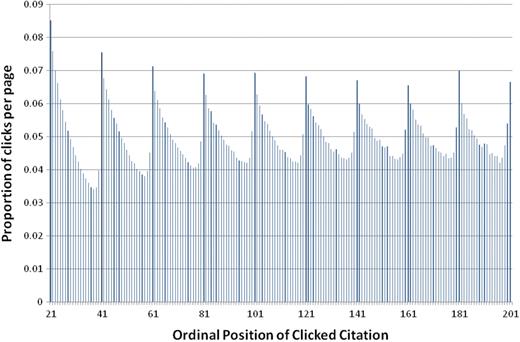
Distribution of abstract retrievals per ordinal position (ratio is computed per page).
Users are less likely to select citations as result set increases in size
Our data show that after viewing an abstract, 29% of the time a user proceeded on to view the corresponding full-text article. As a matter of fact, this accounts for the majority of full-text views in our data. A significant number of full-text views in our data consisted of clicks on full-text links from the result page. The PubMed interface in March 2008 allowed users to skip the abstract view and request full text directly from the result page. Our dataset also contained direct clicks to the full text articles from searches against other NCBI databases such as the Protein Database or the Gene Database.
Figure 10 shows the number of abstract and full text requests with respect to the size of the returned citations set. In general, the larger the result set the less likely for a user to request an abstract or a full-text view. In Figure 10, abstract views amount to 100% for result set size 1. This is because, when a query returns a single citation, PubMed users are presented with the corresponding abstract automatically.
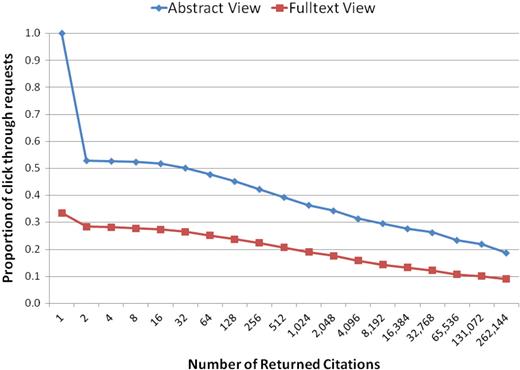
Distribution of abstract and full-text requests given the number of citations returned per query. (Number of returned citations is shown in log scale).
Issuing a new query is common
Another course of action frequently taken by PubMed users is the issuing of a new query. In our dataset, 47% of all queries are followed by a new subsequent query. These users did not select any abstract or full text views from the result set. We make an operational assumption that these users’ intent was to modify their search by reformulating their query. We measured the time elapsed between consecutive searches and investigated the returned citation sets for the initial and subsequent queries, as we discuss below.
Time between two subsequent queries is short
Figure 11 shows the time elapsed between two consecutive searches: 72% of subsequent queries were issued within 1 min after the initial query and 90% were issued within 5 min of the first query. This suggests that in general new queries are issued shortly after their preceding query.
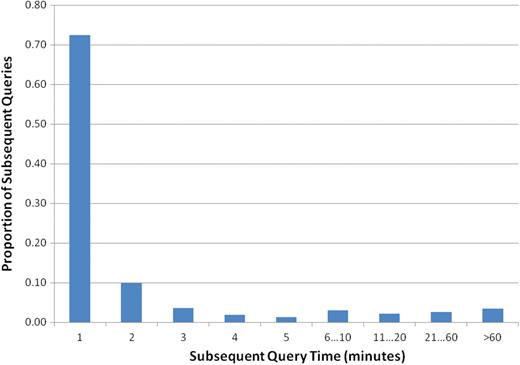
Distribution of subsequent queries according to their time difference.
Users issue new queries when presented with no results
PubMed users frequently issue a new query or modify their previous query when the set returned by their initial query did not satisfy their information needs. As shown in Figure 5, a total of 15% of all queries returned no results. In 82% of these cases PubMed users issued a new query. This stands in contrast to only 41% when queries did return results. In Figure 12, we show the distribution of number of citations returned by the new query, when the initial query returned no citations. In the majority of the cases, one or more results were obtained with the new query. However, in 38% of the cases where a query was revised after a zero-result set, the revised query also returned zero results.
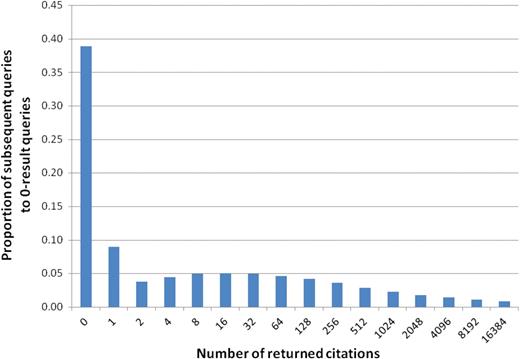
Distribution of queries subsequent to zero-result queries, detailed by the number of returned citations.
Single queries and abandoned search
When a single query is issued and no further user action follows, we assume that the user abandoned the search (some simple bibliographic information needs might be met by the result set alone. We cannot compute these cases using the data that we analyzed). On a daily basis, ∼9% of PubMed searches are abandoned. Unlike what Radlinski et al. (29) observed with their search engine for the ArXiv.org database, we found the daily abandonment rate was almost constant in PubMed (the SD is <0.5%).
Users issue new queries when presented with too many results
Together with our analysis for issuing subsequent queries, we investigated the effect of different result set sizes on query abandonment. In Figure 13, we show the distribution of queries with and without subsequent retrievals. The x-axis is the number of citations in returned result sets, and the y-axis is the fraction of queries for that particular result set size. We show the likelihood for abandoning a query (blue) and issuing a new query (red) with respect to different size of returned results. Since 9% of the queries retrieved exactly one result (for which the abstract is displayed by default), we considered these cases to be successful searches and they are not shown in this figure. This data shows that the abandonment rate was stable regardless of the result set size. In contrast, there seems to be a pronounced correlation between the follow-up queries and the result set size. As the result set size increases, users are more inclined to issue a new query.
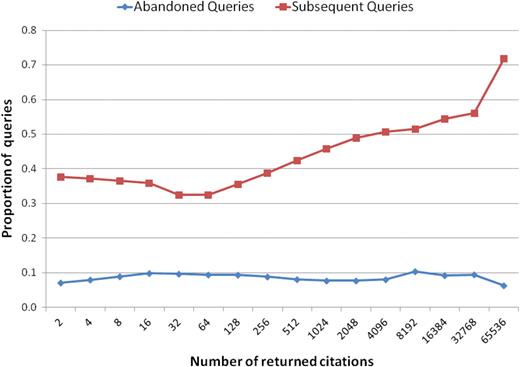
Distribution of the abandoned queries and subsequent queries according to their returned number of citations.
PubMed users are persistent
To quantify the overall quality of a search engine, Radlinski et al. (29) studied a set of absolute metrics. A standing assumption is that the retrieval quality impacts observable user behavior in an absolute sense, e.g. better retrievals lead to higher ranked clicks and faster clicks. Table 6 shows these values for PubMed and summarizes the individual metrics and their definitions. We have already presented and discussed these values in detail, in previous sections. Times to first and last click, given as averages in Table 6, are further broken down in Figure 14. In Figure 14, separate colors are used to show the time elapsed between a search and the first (blue) or last retrieval (red) of either an abstract or full-text article. Approximately 80% of first clicks occurred within 1 min of issuing a query and 80% of the last clicks occurred within 5 min.
The measurements for absolute metrics
| Absolute metric | Definition | PubMed |
|---|---|---|
| Abandonment rate | The fraction of queries for which no results were clicked on and user abandons the system | 0.09 |
| Subsequent query rate | The fraction of queries that were followed by another query during the same session | 0.47 |
| Queries per session | The mean number of queries issued by a user during a session | 4.05 |
| Clicks per query | The mean number of results that are clicked for each query | 3.57 |
| Max reciprocala rank | The mean value of 1/r, where r is the rank of the highest ranked result clicked on | 0.33 |
| Mean reciprocal rank | The mean value of | 0.91 |
| Time to first click | The mean time from query being issued until first click on any result | Median, 24 s; Average, 3.3 min |
| Time to last click | The mean time from query being issued until last click on any result | Median, 76 s; Average, 5.6 min |
Similar to Radlinski et al., when computing these metrics, we exclude queries with no clicks to avoid conflating this measure with the abandonment rate.
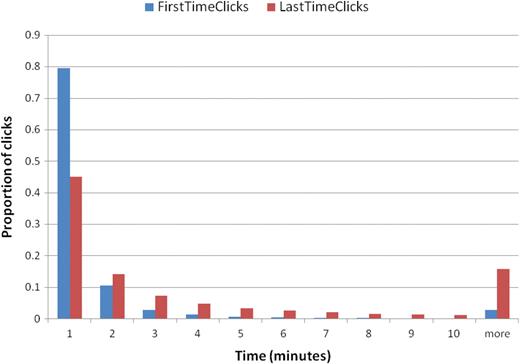
Distribution of time to first and last click in minutes.
Discussion
General versus domain-specific IR
Because of the particular domain PubMed serves, this study stands out from previous work exploiting log analysis [e.g. (29,47)] and provides unique insight on information needs and search habits in the biomedical domain.
First, we see very different information needs. For instance, our analysis shows that author-related queries are the most frequent category in PubMed requests (see Figure 4). Although author name searches are somewhat similar to navigational queries described in other literature (66,67), they are different in two aspects: (i) there is usually only one answer for a navigational query, but often multiple answers for a query containing an author name; (ii) we observed much larger percentage of queries with author names in PubMed than the reported proportion of navigational queries in Web search engines. Addressing this, a new feature—citation sensor—has recently been implemented in PubMed for helping users search author names. It recognizes combinations of search terms that are characteristic of citation searching (e.g. author names), and fetches corresponding bibliographic records in PubMed. Our results suggest that specialized techniques might be more effective for answering requests of PubMed users. Along the same line, disambiguation of author names may help users reach their goal more efficiently.
In addition to these differences in information needs, we also observe some differences in PubMed users’ search habits and strategies. By comparing retrieval quality metrics (29,47), we find a lower abandonment rate and higher reformulation rate for PubMed (Table 6), implying that PubMed users are more persistent in pursuing their information needs than users of other search systems. These differences may be due to a number of factors. Many studies have limited their user sessions to 20 or 30 min, whereas the sessions in our dataset were created using a much larger window (24 h). However, Figure 11 shows that 95% of queries are issued within 20 min of the first query in a session. Therefore, even if we consider all follow-up queries after 20 min to be part of a new session, this would only bring the abandonment rate for PubMed queries up to 11%. This percentage (68%) is considerably lower than the abandonment rate reported by Radlinski et al. (29). Another important difference in our study is the distinction we make between the abandonment of the system and the reformulation of a query. We report those two values separately, as discussed in User Reactions section. If we were to combine these measures under a broader definition of abandonment rate, the end result would be 53%. This is still considerably lower than the 68% reported by Radlinski et al. (29) for web users.
Insights for PubMed and beyond
The goal of this research is to characterize PubMed users and identify needs for system improvement through log analysis. Our investigation provides insight into the different information needs and search habits of PubMed users. These are of significant value for improving information retrieval quality in PubMed and beyond: first, such an analysis helps us to identify and justify areas for future improvement. For example, the analysis of result set sizes (Figure 5) indicates that a sizeable percentage of user queries are unsuccessful. In response to this, we studied changes users make to unsuccessful queries and we are currently investigating ways to assist users with queries reformulation [e.g. (78)]. Another example is the identification of user needs for query suggestion. As shown in Figure 3, most PubMed users type in very few terms (3.54 tokens per query) but the size of the returned result sets for those queries can be overwhelming (over 10 000 per search for short queries). This makes it difficult for individuals to evaluate the retrieved results. Furthermore, as shown in Figure 10, in general, the larger the result set, the less likely a user is to click on a link for document details. All of the above motivated us to offer alternative queries, also known as the ‘Also try’ feature in PubMed, that will return more precise result (i.e. smaller result sets) than that of the user’s initial query. Based on the results of query annotation, we found that searching for author names and gene/protein names the most frequent phenomenon in PubMed queries, both of which are known to present the ambiguity problem in natural language (i.e. polysemy). This underscores the need for continued efforts in developing automatic methods of resolving the ambiguity problem in biomedical concepts.
Second, the study of user search habits can provide insights and guidance for the development of information retrieval tools. We studied and categorized the type of adjustments users performed when their initial queries failed to retrieve any results. As a result of such analysis, we have observed a series of heuristic rules of how users modify their failed queries. In the case of query suggestion, the analysis of query length (PubMed Queries section) led to our decision to limit the suggested queries in the ‘Also Try’ feature to five terms or less.
Finally, one end product of our log analysis is a large amount of raw data, critical for both the development and evaluation of various algorithms. For instance, we found popular queries in the log and used them as source for query suggestions (79); and we are currently using user adjustment data for training a machine learning system that aims to automatically predict the adjustment to unsuccessful queries.
In addition to being useful for improving search quality, our work also plays an important role in the design of PubMed’s user interface. Most PubMed user activities focus on typing queries, browsing results and viewing abstracts. Infrequently their activities include clicking on implicit links for detailed search features. As such, some infrequently used features will soon be withdrawn from PubMed (Kathi Canese, personal communication). Also, the fact that most users select citations from the top positions of the first page suggests that the space above the top search result is an attractive location for advertising new features. Indeed, two recently launched PubMed features (e.g. citation sensor and gene sensor) use this location for displaying their contents.
Conclusions
In this article, we presented a log analysis of one month of PubMed log data, consisting of 23 017 461 user sessions. We characterized users’ information needs and their search habits by examining their search behavior and retrieval history. Like Web search users, PubMed users generally issue very short queries, and select only search results in top positions. Unlike Web search users, PubMed users have very unique information needs pertaining to the domain of biomedical research. Searching for authors is the most frequent request, followed by searching for gene/protein and diseases. Use of abbreviation in queries is also frequent, especially in such semantic categories as gene/protein names. They also exhibit different search habits from Web search users. PubMed users are less likely to select results when result sets increase in size. PubMed users are more likely to reformulate queries and are more persistent in seeking information. Sequences of user queries have also been studied in this data. Our analysis can be used to inform future development and improve PubMed retrieval quality. Our work also suggests that specialized techniques might be more desirable than traditional information retrieval techniques.
Optimizing the ranking of retrieved documents seems critical in satisfying the needs of PubMed users. Toward this end we are investigating several ranking strategies ranging from traditional term weighting approach to a recently proposed term proximity method (80). Although term weighting was shown to be a more effective strategy compared with term proximity, certain aspects of term proximity seem useful for MEDLINE retrieval. We are currently conducting experiments in which retrieved documents are ranked based on both term proximity and other design factors such as keyword-in-context highlighting for search terms in article titles.
Availability
The one month of PubMed log data used in this research is available upon request after data anonymization, aggregation and transformation in accordance with proper privacy protection. Please refer to Website: http://www.ncbi.nlm.nih.gov/CBBresearch/Lu/LogStudy.
Funding
Funding for this work and open access charge is provided by the Intramural Research Program of the NIH, National Library of Medicine.
Conflict of interest statement. None declared.
Acknowledgements
The authors are thankful to the NCBI/IEB colleagues for their technical support and assistance, and also to John Wilbur for his comments and helpful discussions.
