


Abstract
Efforts to annotate the genomes of a wide variety of model organisms are currently carried out by sequencing centers, model organism databases and academic/institutional laboratories around the world. Different annotation methods and tools have been developed over time to meet the needs of biologists faced with the task of annotating biological data. While standardized methods are essential for consistent curation within each annotation group, methods and tools can differ between groups, especially when the groups are curating different organisms. Biocurators from several institutes met at the Third International Biocuration Conference in Berlin, Germany, April 2009 and hosted the ‘Best Practices in Genome Annotation: Inference from Evidence’ workshop to share their strategies, pipelines, standards and tools. This article documents the material presented in the workshop.
Introduction
Next-generation sequencing technologies drastically reduced the cost and increased the speed of complete genome sequencing. As a result, the number of completely sequenced genomes more than doubled since 2006 from ∼450 to over 1000 genomes in August 2009 (http://genomesonline.org/). Since the release of the first genome sequence >10 years ago, a large number of gene prediction tools were published using different data inputs and prediction methods in order to identify the location and exon–intron structures of genes. While ab initio prediction tools such as GenScan (1) and GeneID (2) showed some success in predicting protein coding genes using HMMs and basic characteristics of genes, they are now mostly replaced by evidence-based tools [Gnomon (3), Augustus (4), EuGène (5)] and in some cases, dual genome comparative prediction tools [Twinscan (6) and SLAM (7)]. But even for these more sophisticated, evidence-based tools prediction of the exact exon–intron structures and splice-variants of genes remains a challenge. For example, the human ENCODE Genome Annotation Assessment Project (8) has shown that the average multiple transcript accuracy (e.g. the accuracy in predicting all isoforms of a gene correctly) of tested prediction tools reached only 40–50%. Genomes also contain several other types of genes, such as pseudogenes, RNA genes, uORFs and short coding genes, which are much harder to predict than typical multi-exon protein-coding genes (9,10). Even though it is clear that all genomes would benefit substantially from manual curation, only few model organisms such as Drosophila melanogaster, Arabidopsis thaliana, Caenorhabditis elegans and Escherichia coli benefit from the continuous, in-depth annotation of expert curators. For most newly sequenced genomes, however, no curatorial teams are available and genome annotation often remains limited to computational predictions. Incomplete knowledge of a genome’s gene repertoire represents a significant bottleneck in biological research as correct gene structures are a prerequisite for computational sequence analysis to determine gene function, for primer design to amplify genes and detect expression, for comparative analysis and for the identification and analysis of regulatory elements and splicing factors. It is therefore crucial for the research community to become more involved in the annotation process of newly sequenced genomes. In the last few years, a plethora of freely available genome browsing and editing tools have become available, including those developed by the Generic Model Organism Database project (GMOD). Furthermore, emerging new RNA sequencing technologies are starting to generate vast amounts of transcriptome data, which represents extremely useful experimental evidence for improving gene structures and detecting new splice variants. Increased community-based genome annotation will depend on availability of robust, intuitive and integrated suites of tools applicable across many species to visualize, edit, analyze and annotate genes and gene products, features and attributes.
As large genome centers and model organism databases are leading efforts on large-scale genome annotation and tool development, interest in their annotation protocols, methods and tools has markedly increased in recent years. In this article, we discuss methodologies and standards of annotation as well as tools used by four annotation teams at the following three centers: J. Craig Venter Institute (11), Welcome Trust Sanger Institute (WTSI) (12) and The Arabidopsis Information Resource (TAIR) (13). The authors presented this work as a workshop at the Third International Biocuration Conference in Berlin, Germany, April 2009, organized and chaired by Dr Linda Hannick. This report is not intended to be a comprehensive review of all annotation methodologies and tools available, but as a discussion of the work presented at the workshop.
Standards and Methods
Prokaryotic genome annotation pipeline and standards at the J. Craig Venter Institute
Introduction
Dr Ramana Madupu presented JCVI’s modular prokaryotic annotation pipeline. JCVI is a leader in prokaryotic annotation, producing 25% (461 out of 1833) of all annotated complete and draft genomes currently available at GenBank. With the dramatic increase in genome sequence data driven by next generation sequencing technologies, JCVI’s annotation pipeline and methodologies are constantly enhanced to augment the changing needs to produce consistent and high quality genome annotations. This pipeline consists of structural and functional annotation components, and is designed to yield rich content and high quality automated annotation for prokaryotic genome and metagenomic shotgun sequences. JCVI developed tools, leveraged by the pipeline, that facilitate the annotation of genomes at multiple levels: the individual protein {Manatee (14), pathways [Pathway Tools (15), KEGG (16)]}, whole genome and in comparison with multiple genomes (MGAT).
Annotation methods and standards
The structural annotation module identifies an extensive list of genomic features, including tRNAs, rRNAs, ncRNAs and riboswitches, mobile genetic elements like insertion sequences (IS) and phage regions, protein-coding regions, regulatory features, simple sequence repeats and CRISPR (Clustered Regularly Interspaced Short Palindromic Repeats) (17) regions.
Homology-based gene function assignments are derived from a combination of highly trusted evidence types, which provide consistent, accurate and complete annotation. Evidence types include manually curated experimentally verified genes in the Characterized Protein Database (CHAR), applied annotation rules and trusted protein families [e.g. TIGRFAMs (18)]. JCVI developed CHAR, a database designed to bring together sequence, synonymous accessions and literature links of published experimental characterizations for each protein entry. The CHAR database stores information of characterized proteins derived from literature curation with standardized nomenclature linked through unique identifiers to corresponding sequence entries in public databases. Each entry in CHAR is assigned Gene Ontology (GO) (19) function and process terms, GO evidence codes, a functional protein name, Enzyme Commission (EC) (20) and Transport Classification (TC) numbers (21), a gene symbol, and synonymous names. Availability of this core set of reliably annotated proteins with experimentally defined functions in CHAR and trusted protein families (TIGRFAMs), enable accurate homology-based functional gene assignments to microbial genome sequences with very high confidence.
The functional annotation module, AutoAnnotate, automatically assigns preliminary functional annotations to predicted proteins using precedence-based rules that favor highly trusted annotation sources. These sources are (in rank order): the CHAR database, a trusted protein family [currently only the TIGRFAMs and Pfam HMMs (22)], a best protein BLAST (23) match from JCVI’s non-redundant protein database PANDA (24), and computationally derived assertions [currently only TMHMM (25) and lipoprotein motifs (LP) (26)]. AutoAnnotate assigns a complete repertoire of annotation data types such as functional name, gene symbol, EC number, and GO terms, to each predicted protein in an entirely automated fashion with as much specificity as the underlying evidence supports.
Genome Properties (27) is a module primarily used for the prediction of metabolic pathways. It is also a comparative genomics system that incorporates both calculated and human-curated assertions of biological processes and properties of sequenced genomes. Genome Properties are defined such that assertions/calculations made across many genomes are as standardized as possible using controlled vocabularies or numerical values with controlled units. A large number of Genome Properties represent metabolic pathways and other biological systems. Where these components may be accurately detected by computational means (generally by use of TIGRFAMs and Pfam HMMs), assertions as to the presence of the whole pathway/system are made automatically. Many other Genome Properties define genome metadata; a few examples include the presence and type of flagella, pili or capsule and the cell shape of the organism. Although Genome Properties does not currently update annotations, JCVI anticipates leveraging its computed evidence to update annotation in the future.
The JCVI annotation pipeline uses controlled vocabularies such as GO terms to capture defined concepts and their association to specific genes, enabling a system of unambiguous searching for particular concepts and efficient exchange of annotations. In addition to assigning GO terms, JCVI’s automated methods assign the GO evidence codes to distinguish between functional annotations made based on experimental data or solely on computational evidence. JCVI’s prokaryotic genome annotations are periodically submitted to the GO repository to make them available to the community.
Distilling information from several lines of evidence to accurately assign gene names is a complex task. JCVI strives to annotate genes with only as much information as the underlying evidence supports. To support best practices for genome sequence annotation and the use of controlled vocabularies, extensive gene naming guidelines for manual curation were developed. The naming guidelines are available through JCVI’s Comprehensive Microbial resource (CMR) (28) and manual annotation tools. Using a conservative approach this nomenclature system is applied during manual annotation, where the specificity of the gene name reflects the confidence in the assignment and annotation is consistent with the best available evidence. The naming guidelines and rules are also applied by JCVI’s automatic pipeline to assign gene names from trusted data in CHAR and TIGRFAMs.
In addition, JCVI developed extensive documentation and published standard operating procedures (SOPs) relating to prokaryotic annotation methods and made available on the CMR. SOPs provide details of JCVI annotation procedures and methods used to generate specific genome data.
JCVI actively participates in ASM-NCBI workshops and the Genomic Standards Consortium (GSC) (29), and works with the genomics community to develop standards for genome annotation. ASM-NCBI workshops focus on developing standard naming methods for functional annotation. JCVI participated in both the annual workshops (2006 and 2007), contributing and implementing consensus standards proposed by this committee.
Eukaryotic vertebrate genome annotation pipeline and standards at the Wellcome Trust Sanger Institute
Introduction
Dr Jennifer Harrow presented the eukaryotic annotation methodologies and standards developed by the Havana (human and vertebrate analysis and annotation) group at the WTSI. This group is responsible for the Institute's; large-scale manual annotation, focusing on the reference genomes of human, mouse and zebrafish, and is also involved in smaller collaborative projects such as the annotation of the MHC region in different human haplotypes and other mammals (e.g. dog, wallaby, gorilla). As part of the CCDS (consensus coding sequence) project (30,31), the Havana team collaborates with other annotation groups focusing on producing a reference gene set consistent among human and mouse. In addition, the team collaborates extensively with the HGNC (human) (32), MGI (mouse) (33) and ZFIN (zebrafish) (34) gene nomenclature groups to ensure that novel annotated loci are named correctly and efficiently, and are represented accurately in the respective nomenclature databases. The Havana group also works closely with the Ensembl (35) team to incorporate manual annotation as part of the Ensembl gene build process for human and mouse. Havana annotation can be viewed through both the Ensembl and Vega (36) browsers.
Annotation methods and standards
The Havana group is large, with a number of staff and international collaborators working remotely. To promote consistency among annotators the annotators use standard guidelines (37) that describe rules on which the decisions regarding gene structures, transcript types and assigning gene function are based. The standards are regularly updated to reflect advances in biological understanding. Unusual or exceptional cases are discussed within the group and where necessary the guidelines are revised or expanded to include new examples.
Havana annotation is based on transcriptional evidence rather then just coding potential. A comprehensive range of controlled vocabulary biotypes are used to specify locus and transcript type, some of which have a built-in confidence level indicator. For example coding transcripts are tagged ‘known’ [i.e. in RefSeq (38) or SwissProt (39)], ‘novel’ (differs in length to known protein or is only identified by a domain), ‘putative’ (no domain or other protein support) or ‘NMD’ (likely subject to nonsense-mediated decay). Transcripts annotated without a CDS are categorized according to the underlying support (retained intron, artifact, putative) or the information known about them (non-coding, antisense). Pseudogenes, which are difficult to annotate automatically, are currently categorized into seven different types: transcribed and non-transcribed versions of processed and unprocessed pseudogenes plus unitary, polymorphic and immunoglobulin pseudogenes.
All exons of Havana models are supported by evidence such as matches to homologous proteins, mRNAs or ESTs. This evidence is attached to the models and accessible through the Vega genome browser (36). For genomic clones sequenced at the Sanger Institute, the INSDB (International Nucleotide Sequence Data Bank, i.e. DDBJ/EMBL/Genbank) submission for the genomic clones list the evidence as well. Identification of splice variants and pseudogenes are two of the areas where the Havana group’s manual annotation has significant advantages over automated annotation (8). It is the group’s policy that splice variants are built only to the extent of the underlying supporting evidence (cDNA or EST), i.e. to not complete the structure by ‘borrowing’ exons from other variants. As a consequence, many Havana annotated variants are 5' and/or 3' incomplete. It does mean, however, that no variants that combine exons in a pattern that may not occur in vivo are built. When determining if and which CDS to annotate when assessing alternatively spliced transcripts, factors like NMD, translation mechanics, cross-species conservation and the presence of protein domains are taken into account. Similar considerations come into play in other difficult cases such as read-through transcripts or gene merges, non-canonical splice sites or artifacts. Transcript and locus types are under constant review and therefore subject to change, as dictated by new research findings and community opinions.
Eukaryotic pathogen genome annotation pipeline and standards at the Wellcome Trust Sanger Institute
Introduction
Dr Ulrike Böhme of the Pathogen Genomics group at the WTSI presented eukaryotic pathogen annotation methods and standards. The Pathogen Genomics group is sequencing genomes of organisms that are relevant to human and animal health. The projects the group is working on range from bacterial plasmids through to bacterial genomes, from protist parasites to helminths and insect vectors. The projects include EST sequencing, comparative genomic sequencing and fully finished genomes. Each project has its own individual requirements. These requirements depend on whether the project is part of a comparative genome-sequencing project or a genome project for an organism for which there is no sequence data available from a closely related species. A subset of these projects manually curated.
Annotation methods and standards
For projects such as Plasmodium falciparum that are being manually curated, gene structure annotation is generated using several different large data sets and methods. Second generation sequencing technology (e.g. Illumina) is used to sequence the transcriptome (known as RNA-Seq). Sequences obtained from RNA-Seq experiments are mapped onto the genome based on uniqueness. This allows the identification of alternative splicing events (e.g. exon skipping) at single base-pair resolution, and transcriptionally active regions of the genome that do not match to a predicted protein-coding gene. In addition to that EST data and full-length cDNA, data are being aligned with exonerate or PASA (Program to Assemble Spliced Alignments) (40). To find new gene models and correct exon–intron boundaries, TBlastX comparison to other closely related species is used. The automated gene prediction program Evigan (41) is used to compare to existing gene models. Literature searches are carried out and references are manually added.
Functional annotation is being improved by using a combination of manual and automated methods. GO terms are manually added to the gene models. To further improve functional annotation protein domains, searches against Interpro and Fasta and BlastX homology searches against Uniprot are performed. In addition to that automated prediction of non-coding RNAs (42) and Rfam family annotations are carried out. Signal peptides, transmembrane domains and GPI anchors are also automatically added to the gene models. OrthoMCL (43) is used to identify orthologous groups. Comments received from relevant scientific communities are constantly being evaluated and incorporated for manually curated genomes.
Eukaryotic annotation pipeline, standards and methods at The Arabidopsis Information Resource
Introduction
Dr Philippe Lamesch presented TAIR’s annotation pipeline, standards and methods. TAIR is the central repository for all data related to the plant model organism A. thaliana (44). TAIR curators analyze and curate a wide variety of data including gene function, gene structure and metabolic pathways. TAIR also hosts many useful data analysis tools such as the TAIR GBrowse, bulk download tool and synteny viewer, and contains links to other relevant plant/Arabidopsis websites. In 2005, TAIR took over responsibilities for the Arabidopsis genome annotation from JCVI. Since then, TAIR has published genome releases annually and as of June 2009 curators have annotated more than 2000 novel gene models and updated the structure and/or type of almost 50% of all Arabidopsis genes.
Annotation methods and standards
Gene structure annotation at TAIR relies on a combination of manual and computational methods to make targeted updates to a relatively well-annotated genome with maximum efficiency and annotation quality. Gene structure annotations at TAIR are generated in three different ways: Manual annotation of gene structures at TAIR is combined with computational updates to generate each new genome release. Manual annotation presents several advantages over automatic annotation: while the current automatic annotation pipeline only uses ESTs and cDNAs to reannotate the genome, manual curation takes advantage of additional types of evidence such as cross-species sequence alignments and short peptides generated by mass spectrometry. The latter can be crucial in identifying additional splice-variants or determining the correct exon–intron structure of a gene. Furthermore, manual annotation allows curators to solve difficult annotation cases where the automatic pipeline would fail. While automatic annotation would discard a gene due to a UTR that slightly exceeds the allowed UTR length, a curator would accept this gene if sufficient evidence existed that this gene is functional (such as several aligning spliced mass spectrometry). In addition to updating gene structures, curators also determine gene types (protein-coding, pseudogene, ncRNA) when manually curating genes. The small size of the TAIR gene structure annotation group allows curators to frequently discuss complex manual annotation cases resulting in a high degree of annotation consistency.
Community annotation. Curators manually incorporate each individual gene structure update submitted by the Arabidopsis community. As researchers typically submit exon–intron structures for genes that they have worked on, these annotations are mostly of very high quality and are almost always accepted by curators.
Semi-automatic annotation pipeline. On a yearly basis, a semi-automatic pipeline is run to extract all EST and cDNA transcripts from Genbank, which are then aligned to the genome with Gmap (45). The genome annotation tool PASA (Program to Assemble Spliced Alignments) (40) clusters aligned sequences, generates gene models and compares these to the existing gene sets. Based on this comparison, PASA uses a set of rules to evaluate these new gene models and classifies them according to observed differences, i.e. extended 5′-UTR, new isoform, updated protein sequence, etc. Curators then inspect these gene classes manually, using the Apollo (46) genome annotation tool.
Curation based on experimental and in silico generated datasets. Curators use a variety of published, large-scale datasets to identify novel, inaccurate and alternative gene structures. Recent annotation efforts carried out by TAIR curators include the analysis of a genome-wide set of predicted small genes (47), the use of two large-scale ‘short peptide’ datasets generated by mass spectrometry (48,49) and the comparison of TAIR gene models to those produced by alternative gene prediction tools [Gnomon, Eugene and Aceview (50)].
In contrast to TAIR’s manual annotation process, the automated annotation pipeline (method 2 discussed above) follows a very strict set of rules including maximum number of UTR exons in a gene, UTR/CDS size ratio, minimum intron size and many others. PASA-generated gene models that violate one or several of these rules are not automatically deleted but are saved in ‘failed gene’ lists that can then be manually reviewed by curators. As of TAIR9, gene updates generated by PASA were solely based on cDNAs and ESTs from NCBI. TAIR plans to integrate additional data types, including RNA-Seq data, into its automatic annotation pipeline for future releases.
In TAIR, Arabidopsis genes are grouped into eight gene model types: protein coding, pre-tRNA, rRNA, snRNA, snoRNA, miRNA, other_RNA and transposable element. Any gene, regardless of its type, can be tagged as being a pseudogene. TAIR curators currently do not annotate gene models with ‘retained introns’ nor do they add non-coding isoforms to protein-coding genes. In some rare instances, ‘partial’ gene models have been annotated in TAIR.
All annotated Arabidopsis genes are shown in the TAIR genome browser, GBrowse and the various evidence types used by curators for annotation can be selected for display in over 50 data tracks.
Annotation tools
Introduction
Many freely available genome browsing and editing tools are available to the research community. Here JCVI, TAIR and WTSI present the salient features of their open-source, robust, intuitive and integrated tools used to visualize, edit and annotate genes.
Manatee: JCVI manual annotation tool
Introduction
Lauren Brinkac presented Manatee (14), JCVI’s freely available, open-source, web-based annotation and analysis tool for display, modification and storage of prokaryotic and eukaryotic genomic or data. The Manatee annotation tool is widely used by the scientific community to retrieve, display and analyze genomic data. Manatee is used to access underlying genomic data supported by JCVI through a secure remote login (51). Alternatively, Manatee is installed locally for access to data supported by individual institutions.
Features
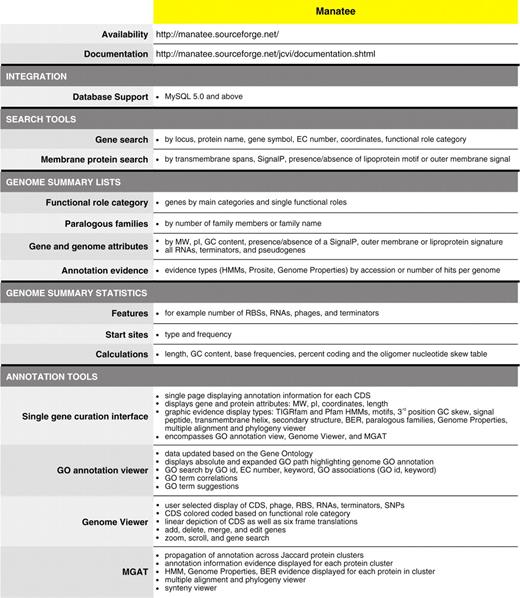
Within a user-friendly graphical interface, Manatee extracts stored information from an underlying database and associated data files displaying homology search results and the most current annotation. Homology search results include, but are not limited to, Hidden Markov Models (HMM), Genome Properties, modified Blast search data (BER: Blast Extend Repraze), paralogous families, protein motifs and other signatures. Experimentally characterized proteins are preferentially highlighted throughout BER search results with links to supporting curated literature. The Manatee interface enables the quick identification of genes and manual assignment of functional annotation by displaying the available evidence supporting annotation and providing a diverse set of genome analysis tools, such as Manatee’s GO Annotation Viewer and linear Genome Viewer (Figure 1). A full listing of features can be found within Table 1. Additionally, the Manatee interface allows multiple users to access and update annotation data simultaneously. As functional assignments are made, Manatee stores not only the updated annotation data, but also the underlying evidence used to make that annotation, back into the database. This facilitates long-term data archiving, annotation tracking and user data retrieval. Manatee supports the capture and curation of several types of annotation information including protein name, gene symbol, Enzyme Commission (EC) number, private and public comments, functional role classifications and GO terms.
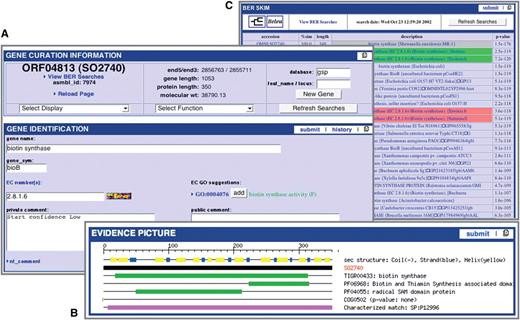
Manatee: manual annotation tool. (A) Display of annotation identification features and calculations for a gene. (B) Graphical representation of annotation evidence aligned to the gene of interest and color coded to represent the significance of the match. (C) List of BER results ordered by homology and color coded to represent entries in the CHAR database.
Features of the Manatee annotation tool for prokaryotes
 |
Multi-Genome Annotation Tool (MGAT) is integrated within Manatee. This web-based annotation tool facilitates the assessment of common annotation evidence, shared synteny and propagation of annotation information across high-stringency Jaccard protein clusters containing proteins of strains of a species or very closely related species. MGAT enables the annotation of a single cluster of genes as well as entire gene clusters conserved across the closely related genomes, allowing for rapid and consistent propagation of manual annotation within a single user interface. The MGAT tool is still under development, and will be made publicly available in the near future (Figure 2).
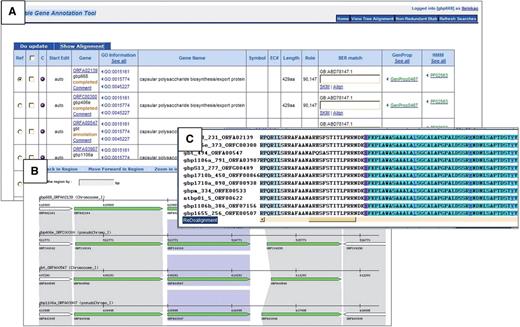
MGAT: multi-genome annotation tool. (A) Display of annotation identification features, calculations and evidence for all genes associated with a protein cluster. (B) Synteny display of the protein cluster. (C) Multiple alignment of the protein cluster.
Documentation on annotation guidelines, annotation standard operating procedures and other help documentation is accessible as support documentation linked throughout Manatee (52).
Zmap and Otterlace: WTSI vertebrate annotation tools
Introduction
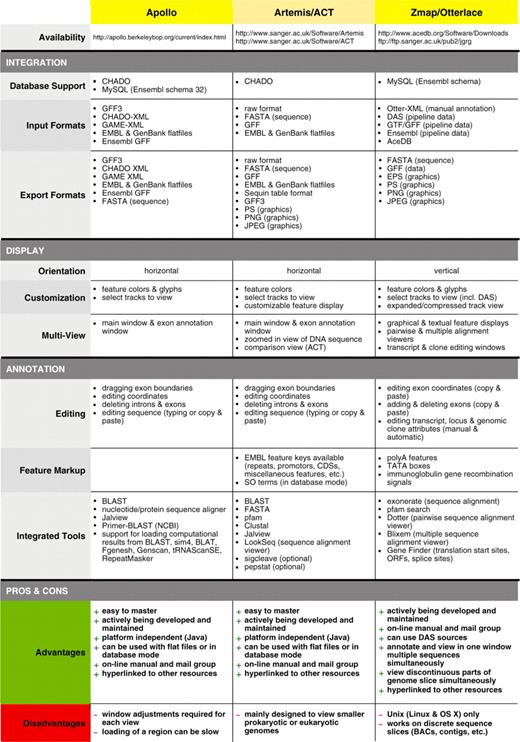
Dr Laurens Wilming presented the Otterlace annotation tool (53). Prior to annotation, an Ensembl-derived analysis pipeline is run on genomic sequence, the latter mostly BAC clones but can also be whole-genome shotgun contigs. The pipeline consists of homology searches, gene predictions and de novo sequence analysis. Examples of the analysis are: BLASTX homology search against SwissProt and Trembl proteins, BLASTN homology search against ESTs and vertebrate mRNAs, protein domain search against the Pfam database, tandem repeat finder, CpG island finder, Augustus and Genscan gene predictions and Eponine transcription start site predictions. The results of the pipeline are stored in a MySQL database with an Ensembl style schema. Annotators view the results in a graphical interface called Zmap, which is part of the Otterlace annotation system. Otterlace contains several modules: Zmap for a graphical view of the analysis and annotation data (Figure 3C, E and F); Blixem (Figure 3G) and Dotter (Figure 3H) for viewing multiple and pairwise sequence alignments, respectively; and Lace for building and modifying transcript models (Figure 3B and D). Manual annotation data is stored in a separate MySQL database. Annotators can add and modify the exon structure, CDS, locus name and description, private or public comments, polyA features and locus and transcript biotype and supporting evidence. See Table 2 for the comparison of the Zmap/Otterlace tool with Apollo and Artemis/ACT.
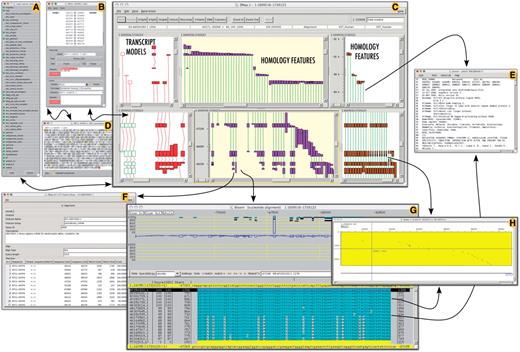
A selection of interface elements of the Otterlace/Zmap annotation system. (A) Column/track selection window. This allows user to choose tracks (features) to load and display, including DAS sources. (B) Transcript editing window allows annotator to edit exon structure and transcript and locus attributes. (C) Zmap is the graphical viewer showing the genomic features of choice such as manually annotated transcript models (red and green boxes, left panels), EST homology (pink boxes, middle panels) and mRNA homology (brown boxes, right panels). (D) Window showing the protein translation of a coding transcript model; can be used to edit the CDS. (E) EMBL nucleotide database files of homology features are accessible directly from Zmap (C) and Blixem (G). (F) Feature detail window shows for example all the hits of an EST within the segment of the genome under examination. (G) Blixem interface for viewing multiple sequence alignments at nucleotide or amino-acid level. (H) Dotter interface for viewing on-the-fly pairwise unmasked sequence alignments; accessible through Zmap (C) or Blixem (G).
Feature comparison of Apollo, Artemis/ACT and Otterlace/Zmap genome annotation tools for eukaryotes
 |
Features
Homology features displayed in expanded view give an indication of contiguity through color-coded connecting lines (Figure 3C, middle and right-hand panels): green, contiguous; orange, gap; red, discontiguous (overlap, out-of-order). The user can choose different levels of compactness/expansion for homology tracks, ranging from the default collapsed view (all features of that type stacked in one column) to the fully expanded view (each homology feature in its own column).
A feature of Otterlace used frequently for GENCODE (54) [part of ENCODE: encyclopedia of DNA elements (55,56)] and CCDS annotation is the ability to simultaneously view and annotate two genomic sequences. Zmap can display the two genomes in separate panels and annotated transcript models can be copied from one genome to another. This greatly facilitates comparative annotation and the annotation of unusual or complex gene structures and clusters. Similarly, non-contiguous parts of one genomic slice, for example the 5'- and 3'-ends of a large gene, can be viewed simultaneously using the split-panel interface (Figure 3C, left panels).
In addition to the alignments from the pipeline, Otterlace can perform and display on-the-fly alignments using protein or nucleotide accessions or FASTA sequence. To complement the BLAST multiple sequence alignments from the pipeline, Otterlace can show pairwise sequence alignments, using Dotter, between protein or nucleotide sequence and either a transcript model or genomic sequence.
Otterlace is DAS (57) aware and many specialized DAS sources are used in the GENCODE project (computational and experimental data from collaborators), allowing quality control of Havana annotation and of data emanating from GENCODE research. For example, predicted genes from the Broad institute, predicted pseudogenes from Yale University, introns with non-canonical splice sites from UCSC or chromatin signatures indicating putative start sites from MIT can be displayed. DAS and pipeline data can be loaded on-demand through a simple check-box interface (Figure 3A).
Objects in the Pfam and Ensembl tracks are hyperlinked to the relevant web pages. The same universal mechanism can be used to hyperlink any object in Zmap to an appropriate online resource.
A quality control mechanism is built into Otterlace, checking the manual annotation for, amongst other things, translating CDS, properly set CDS start and end attributes and presence of supporting evidence, locus name (description) and symbol.
For the EUCOMM mouse knock-out project, the Institute collaborates with KOMP (58) annotators at Washington University, St Louis and with NORCOMM (59) annotators at the University of Manitoba. These collaborators use the Otterlace client to connect remotely to the analysis and annotation databases located at the Institute. The Havana group also used the system for bovine and porcine genome annotation jamborees, enabling delegates to continue annotation remotely after onsite jamborees. Though Otterlace is intended for genomic annotation, it has been successfully used for the annotation of part of the Xenopus tropicalis transcriptome during an annotation jamboree at the Sanger Institute.
Zmap is undergoing development to include, with an appropriate intermediate layer that interacts with a sequence/annotation database of choice, such as MySQL, Oracle, Sybase, etc. For example, application Zmap could be used as a viewer for Ensembl or Vega, which currently have web-based graphical user interfaces. Another enhancement in development is to view orthologous regions more interactively with conservation data, from Ensembl Compara for example, shown between two different genomes.
Artemis and ACT: WTSI invertebrate annotation tools
Introduction
Dr Ulrike Böhme presented Artemis (60,61) developed at the WTSI. Artemis is a free, easy to use sequence viewer and annotation tool for prokaryotic and eukaryotic genomes. Artemis has gathered an increasing number of users with over 50 000 downloads since its first release in 1999. It is designed for all operating systems: UNIX, Linux, Macintosh and Windows. See Table 2 for the comparison of Artemis/ACT with Zmap/Otterlace and Apollo.
Features
Artemis can be used to simultaneously view the results of multiple sequence analysis in the context of a genome sequence. By allowing the user to zoom in and out from the base level to a wider overview and the ability to scroll through the sequence, Artemis can serve as a useful tool for manual annotation review and editing (Figure 4).
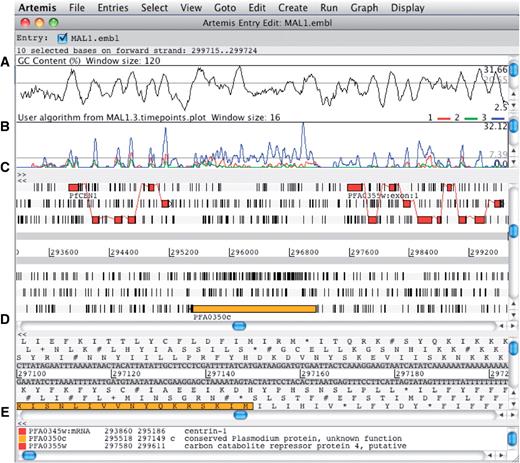
The main editor window of Artemis showing a section of annotated sequence of Plasmodium falciparum 3D7, chromosome 1. (A) Plot showing the GC content (%). (B) RNA-Seq transcriptome plot showing three different time points of the life cycle. (C) Main sequence view panel. The two central grey lines represent the forward and reverse DNA strands. Above and below those are the three forward and three reverse reading frames. The vertical bars indicate stop codons. Genes and other features (e.g. Pfam matches) are displayed as colored boxes. (D) Zoomed-in view of the DNA- and amino acid sequence. (E) Panel listing the various features in the order that they occur on the DNA.
The Artemis Comparison Tool (ACT) (62) is a DNA sequence comparison viewer that allows a comparison between complete or draft genome sequences and associated annotation (63). ACT is based on Artemis and inherits all of Artemis’ functionality. Comparison data can be generated by running BLAST installed locally or by using an external web server such as WebACT (64,65). Using ACT it is possible to identify regions of similarity, insertions and rearrangements from single base-pair level to whole-genome level (Figure 5).
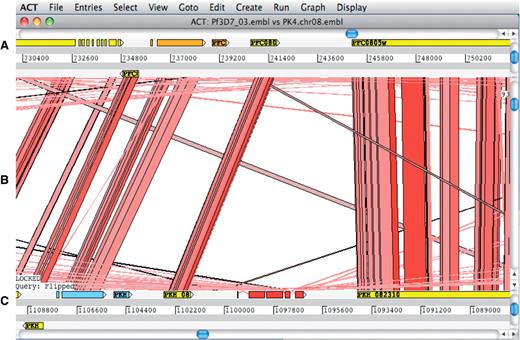
ACT comparison view showing a section of annotated Plasmodium falciparum 3D7 chromosome 3 at the top and the orthologous region of Plasmodium knowlesi strain H chromosome 8 at the bottom. (A) Artemis main view sequence panel. (B) The Comparison view. This panel displays the regions of similarity (TBLASTX comparison) between two sequences. Red blocks link similar regions of protein with the intensity of red color directly proportional to the level of similarity. (C) Main sequence view panel of the query sequence.
Artemis, originally designed to use flat files, is now adapted to the CHADO schema (66) allowing multiple users to access and edit annotation simultaneously, thereby facilitating community annotation projects between groups working in different locations (67). This database version is being successfully used in the community-based annotation projects of Plasmodium falciparum 3D7 and Trypanosoma brucei.
Apollo: a manual gene annotation editor (TAIR annotation)
Introduction
Dr Philippe Lamesch presented Apollo, a genome annotation editor and a component of the GMOD project. Apollo was developed as a collaboration between the Berkeley Drosophila Genome Project (68) and the WTSI. See Table 2 for the comparison of Apollo with Zmap/Otterlace and Artemis/ACT (Figure 6).
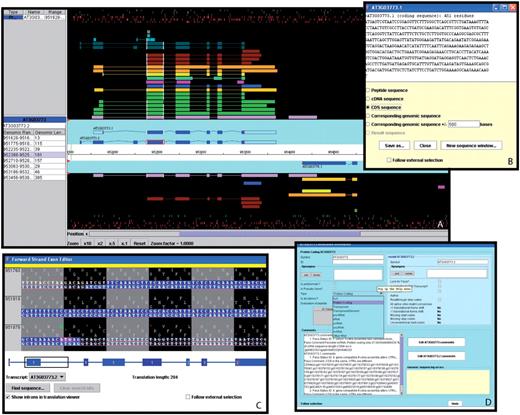
A selection of windows from the Apollo genome annotation tool. (A) The main Apollo window contains two sections: the section with the turquoise background displays all current gene models in the selected region; the section with the black background shows different types of sequences aligning to either strand of the genome. Sequences include Arabidopsis ESTs (light purple) and cDNAs (green), gene models from alternative prediction tools (gold: Gnomon, yellow: Eugene, turquoise: Augustus), Brassica ESTs (blue), sequences from five different monocot species (deep purple), radish clones (brown), and short peptides (light blue, dark green). The side panel provides additional information about the selected sequence and the genomic coordinates and length of each of its exons. By right-clicking on a gene model, a menu pops up which opens a series of useful additional windows, including: (B) the ‘Sequence’ window displaying the sequence of the selected model. From a list of radio buttons, the type of a displayed sequence can be selected (peptide, cDNA, CDS, genomic sequence). (C) The ‘Exon Detail Editor’ showing the genome sequence corresponding to the selected gene as well as the protein sequence in all three frames. Annotated exons are displayed as blue boxes that can be pulled back and forth to modify the boundaries of each exon. (D) The ‘Annotation Info Editor’ allows the user to edit the name of a gene, modify the gene type and add comments about a gene model and its annotation.
Features
TAIR curators use Apollo as their manual gene-editing tool. TAIR’s version of Apollo contains more than a dozen different evidence tracks including expression data from Arabidopsis and other monocots and dicots, short peptides generated by mass spectrometry, gene models from alternative gene prediction tools like Gnomon and Eugene as well as protein homology alignments.
Apollo is a user-friendly tool that allows the user to easily generate and update gene models, and exon boundaries based on overlapping evidence sets. The selection of a gene model highlights boundaries of all overlapping evidence structures, thereby facilitating detection of alternative exon–intron junctions. Updates to a gene structure can be made either by adjusting exons to those shown in the evidence tracks or by using a tool called ‘exon detail editor’, which allows the user to click and drag the nucleotide sequence of an exon to any chosen position. Additional options include merging and splitting of genes and deletion of exons. A new gene editing tool called ‘sequence aligner’, added in Apollo release 1.10, displays color-coded sequence alignments in both nucleotide and protein mode. These sequence alignments, which can be sorted by several parameters including blast hit, data type and organism, are useful not only for gene structure editing but also for detecting pseudogenes and highlighting sequence discrepancies between expressed and genome sequences. When adding a new gene to the annotation, a name can be assigned to this gene in the ‘annotation detail editor’. This editor also contains a comment section to add notes regarding structure updates or to point to particular features of a gene.
In the last months, many useful new features and tools have been added to Apollo. In addition to the above mentioned ‘Sequence Aligner’, Apollo now contains an ‘Undo’ option allowing the user to go back in the editing history, support of the GFF3 input format, display of continuous datasets such as expression levels across the genome, a graphical interface for configuration and remote analysis support for BLAST and Primer BLAST (69).
A variety of other tools such as BLAST, ClustalW, Dotplot and Pfam are often used by curators in conjunction with Apollo when experimental evidence is sparse or absent.
Discussion
Dr Linda Hannick led an active discussion among workshop participants and presenters. As a result of this discussion, the authors present the following set of minimum recommendations to the genomics community: documentation of methodologies and pipelines through freely accessible published SOPs, development and availability of open-source annotation tools and active participation in developing and adopting community standards proposed by consortia.
Whereas we can propose a minimum set of recommendations, a single unified set of annotation guidelines or methods is not achievable nor is it desirable. The four groups presented here take differing approaches based on their specific needs. For example, TAIR annotation focuses on re-annotation and curation of an annotated genome. In contrast, the Havana group is concentrating on de novo annotation of the various genomes under their remit. Where reannotation is necessary it is generally treated much like de novo annotation. The Havana group in the future will be looking at adopting a system similar to TAIR and the WTSI pathogen genomics group, where new evidence is compared to existing annotation and differences according to a set of criteria reported back to annotators for review. Neither TAIR nor Havana use literature references or annotate from literature to any great extent, in contrast to JCVI and the WTSI pathogen genomics group.
Prokaryotic genome annotation such as at the JCVI is different from the eukaryotic equivalent because the simpler gene structures and arrangements allow for greater automation of structural annotation. The emphasis when it comes to manual annotation here is on the functional aspect. This is in common with the other groups, supporting evidence-based functional annotation.
Recommendations
The authors propose the following recommendations:
Initial genome annotation: choosing a computational gene prediction tool
With the exception of the human, mouse and zebrafish genome annotation projects, where gene structure annotation is done on a BAC by BAC basis, most genomes rely on computational prediction tools to generate an initial gene set. This initial annotation can then be improved manually by curators and/or the scientific community who manually edit exon–intron structures, add splice-variants and update locus and transcript types.
Many gene prediction tools exist that can be used for the initial annotation of the genome. Each program has its own strengths and weaknesses, differing mostly in the types of experimental data that can be incorporated, and in what model organisms they were trained on. Guigó et al.’s EGASP paper (8) provides a good overview of the different prediction tools available and the accuracy with which they predicted various gene features on a region of the human genome. We recommend choosing a tool that is customizable, as it gives the user more flexibility to adjust many of the gene-related characteristics such as minimum intron length, number of UTRs, etc., based on their specific needs.
Improving existing genome annotation: choosing a strategy for regular genome updates
In the past, annotation groups have used two fundamentally different approaches to improve genome annotations: some groups regenerate their annotation from scratch by building novel models based on the most up-to-date experimental data available; others build on top of their existing annotation, thereby preserving manual annotations that would otherwise be lost. The latter strategy, although more involved, is recommended when a significant amount of effort is put into manual annotation. One tool that can be used for this purpose is PASA (21), a gene building tool that integrates new data into previous gene structures to build improved models.
Another factor to keep in mind is the time interval between releases. Although it is important to release improved genome annotations on a regular basis, we recommend not performing more than two or three updates a year as each update requires an adjustment by the research community.
Tracking changes in gene updates and supporting evidence
It is important to document what evidence or algorithm was used to build/edit each gene or transcript model and to keep track of each gene’s history. We recommend that each annotation group maintains a gene history log informing the curator or researcher when a gene was updated and what types of updates this gene has undergone (e.g. gene X was split into Y and Z by curator John Doe on this date).
Keeping up with the latest technology and knowledge
As new technologies develop, new types of experimental datasets will become available and should be integrated into the computational and manual gene prediction process and analysis pipelines. Examples of data that have become available on a larger scale in the last couple of years include proteomics data in the form of Mass Spec and transcriptomics data in the form of RNA-Seq. Both of the data types have been shown to be especially useful for annotation of splice-variants. As our understanding of the characteristics of genes increases (NMD, re-initiation, alternative splicing regulation, readthrough, etc.), we recommend that annotation rules used by the curator and/or the prediction tool algorithms should be updated. Curators and researchers also need to stay up-to-date with new developments in software technology. Improved versions of the gene annotation tools presented in this article, as well as new, complementary tools will become available in the future and should be explored by those leading genome annotation projects.
Prioritizing genes for curation
With limited time and monetary resources, we recommend that curators and the scientific community focus on annotating genes that are the most likely to be incorrect or that are of special interest. The former can be done by developing confidence rankings based, for example, on the presence of overlapping experimental data or agreement with corresponding models of alternative prediction tools. One can also prioritize by focusing on specific types of genes, such as very short genes, pseudogenes or tandemly duplicated genes, which are prone to be missed or mis-annotated by computational prediction tools.
Documenting processes
Finally, we recommend that all curation methods and standards be accurately documented. The documentation should include analysis priorities, algorithms and standards, as well as general guidelines for the choice of datasets used in the annotation process. These SOPs will be updated when major changes are made to the pipeline. SOPs should be made available to the public via the institutional website, and documented in the scientific literature (70).
Conclusion
With the explosion of biological data, large genome centers and specialized groups are struggling to keep up the pace of manual curation efforts. Community-based curation of genome data has evolved as the acceptable model to provide manual annotation to large genome projects. MODs and genome centers have developed separate annotation methods, robust open source manual annotation tools and curation standards specifically tailored to the curation of their respective data. Although there is general consensus and some overlap between the major groups regarding the use of annotation methodologies and standards, the groups have forged and enforced standards independently of each other. We have included a minimum set of recommendations that will help improve the quality and consistency of biological curations.
For the research community to successfully engage in manual annotation efforts using these open source tools, they must understand the prevailing methods and standards. We have documented the tools and methodologies presented at the Third International Biocuration Conference workshop, and provided information that will help future annotators to make an informed choice with respect to which tool is most suitable for their specific purpose. These are open-source, well-documented and versatile tools that will enable community biocuration efforts. More open communication to enable community participation in the curation of genes and gene products will benefit the life science community in the future.
Funding
National Institute of Allergy and Infectious Disease (contract HHSN266200400038C to U.B.); Wellcome Trust through their funding of the Pathogen Genomics group at the Wellcome Trust Sanger Institute; the National Science Foundation (grant DBI-0417062). Funding for open access charge was shared equally by authors' institutions.
Conflict of interest. None declared.
