


Abstract
Protein-trap strains of Drosophila melanogaster provide a very useful tool for examining the 3D-expression patterns of proteins and purification of protein complexes. Here we present BrainTrap, available at http://fruitfly.inf.ed.ac.uk/braintrap, an online database of 3D confocal datasets showing reporter gene expression and protein localization in the adult brain of Drosophila. Full size images throughout the volume of the entire brain can be viewed interactively in a web browser. The database includes searchable annotations linked to the FlyBase Drosophila anatomy ontology. Anatomical search criteria can be specified using automatic completion and a hierarchical browser for the ontology. The provenance of all annotation is retained and the location where the annotator made the conclusion can be highlighted.
Database URL: http://fruitfly.inf.ed.ac.uk/braintrap
Introduction
The fruit fly, Drosophila melanogaster, is used as a model organism for genetics research and has a brain consisting of ∼100 000 neurons. This is small enough for the entire brain to be scanned in 3D with a confocal microscope and sophisticated enough to produce a large range of behavior such as courtship, aggression, sleep, learning and memory.
Brain research in Drosophila can have important implications for humans because the molecular mechanisms underlying neuronal function are highly conserved between mammals and Drosophila (1). Several olfactory learning genes are found to be common to both mammals and Drosophila, and the behavioral effects of these genes can be measured experimentally (2,3). Out of all genes known to affect human disease as many as 77% have orthologs in Drosophila (4), and replacing a Drosophila gene with a diseased human ortholog has already proved useful in studying genetic influences on alcohol dependence, sleep disorders, Huntington’s disease, and neurodegenerative diseases such as Alzheimer’s disease and Parkinson’s disease (5).
Protein traps
Protein expression and localization in the Drosophila brain is currently only known for a small subset of the Drosophila proteome. Common techniques for determining protein localization include antibody staining as in (6) and targeted insertion of fluorescent protein into the genome to produce in vivo fluorescence as in (7). Protein traps are useful tools for labeling endogenous proteins to trace their expression, sub-cellular location and for identifying their binding partners (8–10). Recent large-scale projects undertaken by several Universities aim to catalog protein-expression locations for as many proteins as possible with the use of protein-trap techniques (11,12). These projects aim to record information on all areas of the Drosophila anatomy, and at all stages of development. Localization information may help to determine what biological functions each protein performs, and when combined into one large dataset colocation information can be used to determine which proteins can potentially interact with each other.
BrainTrap is part of a large-scale collaborative research project to collect expression location information for as many proteins as possible from protein-trap lines generated by the Cambridge Protein Trap (CPT) project as described in (11). Protein-trap strains have been created using the piggyBac method to insert an EYFP construct, combined with StrepII and FLAG purification epitopes, at random locations in the genome (Figure 1). A consortium of research groups are systematically analyzing the same strains and releasing both the annotations and the strains simultaneously. The first 100 strains, already available from the Kyoto Stock Center, are currently listed on the BrainTrap website with the next batches already prepared.
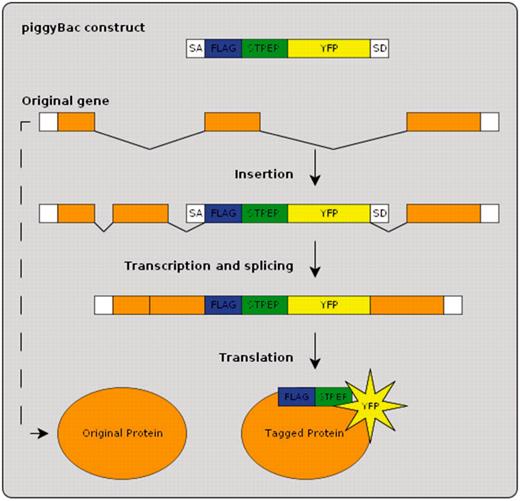
Protein-trap insertion using the piggyBac method. An artificial exon is inserted into the genome at random locations. When inserted within an intron of an existing gene the resulting tagged protein produces in vivo fluorescence.
Existing databases
Drosophila gene and protein-expression databases are generally limited to 2D-exemplar images or short movies of 3D datasets. Examples include www.fly-trap.org, which databases GAL4 enhancer trap expression patterns in the Drosophila brain and provides 3D-expression data the form of quicktime movies. Protein-trap databases include www.flyprot.org (part of the CPT project) and flytrap.med.yale.edu, both of which present annotated images of fluorescent protein-trap lines provided by a consortium of labs. However only 2D images are available and brain images are not provided. For the brain, with its detailed 3D architecture, there is a need for more interactive exploration tools and annotation.
Many large-scale genetic screens such as the CPT project are ongoing and the amount of data collected by imaging techniques is difficult to manage. Good database design and access to information is becoming increasingly important for efficient data sharing and communication within the Drosophila neurobiology community and also in the wider fields of genetics and neuroscience. BrainTrap provides one example of how to address these problems by allowing fast access to relevant information by target data annotation and search over a web interface.
BrainTrap website
BrainTrap displays the 3D dataset on the website with a slice-by-slice viewing interface, similar to those found in desktop applications. It allows the user to choose a range of different viewing sizes and browse quickly to their area of interest. In addition to the EYFP signal from the protein trap itself, the database also includes a secondary immunohistochemical label (anti-brp) that aids navigation and helps identify brain structures. Further information on the staining protocol is included in the supplementary information.
Interactive online viewer
The BrainTrap Website, http://fruitfly.inf.ed.ac.uk/braintrap, displays images in an online viewer that allows interactive browsing of all image stacks (Figure 2). Two dimensional images from the 3D stack are displayed in the viewing area and a stack slider and auto buttons allow navigation within the stack slices. Other viewing controls allow image size enlargement up to 100% image size, and control of the visible signal channel(s). The interface is similar to that provided by desktop stack viewing tools. To the right of the image a list of annotated anatomical regions appears. Clicking on an annotation from the list automatically moves the stack to the corresponding slice and highlights the area of expression (Figure 2). In addition to the online viewer, confocal dataset files can be downloaded in the original format.
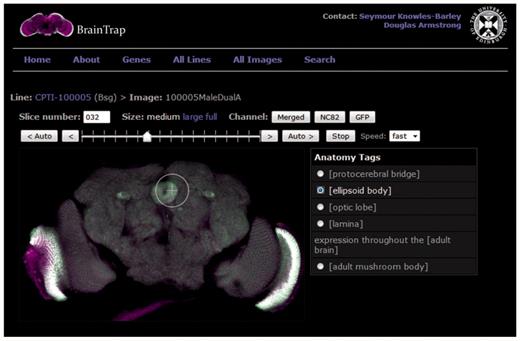
Brain viewer on the BrainTrap website allows the user to browse through the 3D image stack as they would on a normal desktop application. The viewing window size and visible channels can be modified as required. Shortcut buttons are also provided on the right to jump to tagged areas of expression. In this figure the ellipsoid body shortcut has been selected and expression in the ellipsoid body is highlighted. The EYFP signal is displayed in green and merged with the background signal (anti-brp) displayed in magenta. Channel buttons allow the user to choose which channels are visible.
Annotation
Annotations have been made against the FlyBase Drosophila anatomical ontology (13). Selected annotators can log in and add new annotations using the same interactive web interface with ontology term and synonym auto completion to help the annotator use the ontology even if they are not familiar it. Free text annotation and ontology terms can be combined to provide additional information. The provenance of all annotations is retained in the database and, where possible, annotations are linked to a 3D location in the volume showing the area of expression. Annotation data for each CPT line can be downloaded in extensible markup language (XML) format, or summarized in a gene comparison table (similar to Table 2) for a subset of selected genes.
Potentially interacting proteins not coexpressed in the brain
| Protein 1 | Areas of expression | Protein 2 | Areas of expression | |
|---|---|---|---|---|
| dlg1 | cerebral cortex | ⇔ | CG30084 | little or no expression |
| antennal lobe | ||||
| optic neuropil | ||||
| mushroom body | ||||
| protocerebral bridge | ||||
| lateral horn | ||||
| Bsg | brain | ⇔ | Zasp52 | little or no expression |
| protocerebral bridge | ||||
| mushroom body | ||||
| ellipsoid body | ||||
| optic lobe | ||||
| lamina | ||||
| Gs2 | subesophageal ganglion | ⇔ | CG6854 | cerebral cortex |
Proteins showing heightened localization in specific brain areas
| 14-3-3-ε | Bsg | dally | dlg1 | dlp | Fas3 | Got1 | Gs2 | ia2/ CG2678 | nrv1 | RpS23/ fs(1)K10 | Sema-1a | sgg | Su(Tpl)/ Mi-2 | tau | Tm1 | Vha55 | zip | CG1648 | CG17839 | CG31352 | CG5830 | CG6782/ CG6783 | CG9338 | |
| Mushroom body | • | • | • | • | • | • | • | • | • | • | ||||||||||||||
| Fan-shaped body | • | • | • | • | • | • | • | • | • | |||||||||||||||
| Ellipsoid body | • | • | • | • | • | |||||||||||||||||||
| Optic lobe | • | • | • | • | • | • | • | • | • | • | • | • | • | |||||||||||
| Antennal lobe | • | • | • | • | • | • | ||||||||||||||||||
| Subesophageal ganglion | • | • | • | • | • | • | • | • | • | • |
Search
BrainTrap takes advantage of the ontology structure used for annotations by providing a fast ontology driven search page. An anatomical search query can be specified on the web form shown in Figure 3. Areas can be easily specified by browsing the ontology tree (shown on the left) or by typing the area name or synonym into the search box. Matching ontology terms are suggested as the user types. Search results are shown in a preview format (Figure 4).
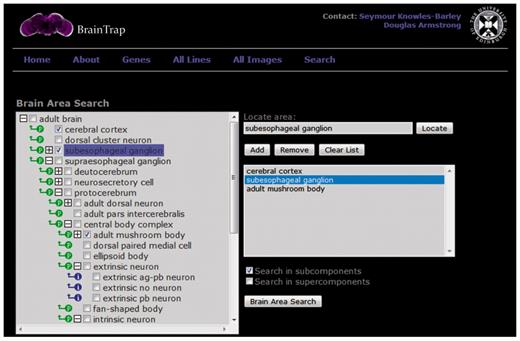
The ontology search form on the BrainTrap website allows users to search for protein-trap lines and images based on anatomical areas of expression. The search specified here looks for protein trap lines with expression in the cerebral cortex, the subesophageal ganglion or the adult mushroom bodies.
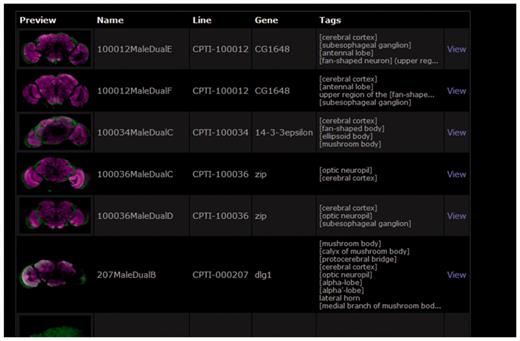
Search results for the brain area search specified in Figure 3. Details of the matching lines are listed along with a preview brain image and a summary of the anatomical areas where expression has been noted.
Each protein-trap line is summarized in a single page showing previews of all confocal brain scans in the database (Figure 5). External links are provided to additional gene details (FlyBase), to further protein-trap images from other anatomical areas (FlyProt), and to the Kyoto Stock Center where all lines are available to the research community. Reciprocal links are under negotiation.
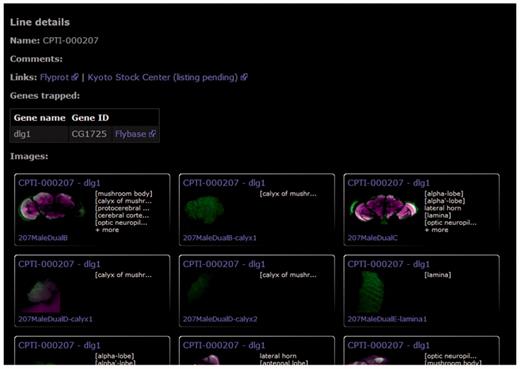
The protein trap line details page provides a summary of all images in the database along with links to FlyProt, for information on other anatomical regions, the Kyoto Stock Center and to FlyBase for further information on the trapped protein. This figure shows the line summary page for dlg1.
Results
Figure 6 shows images from the database showing different protein-expression patterns. Many different expressions are present in the database and it is possible to measure sub-cellular localization of proteins. For example, Figure 7 shows synaptic localization in the calyx of the mushroom body for protein dlg1.
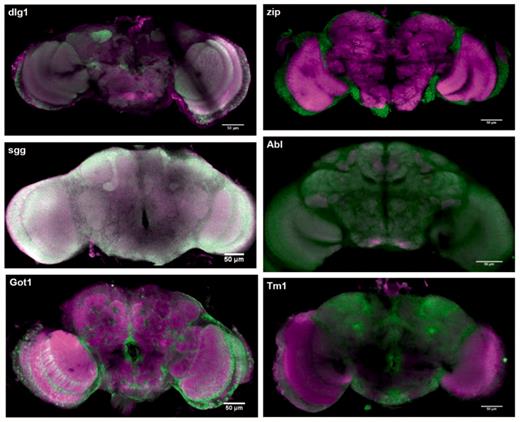
Protein expression for sgg, dlg1, Got1, zip, Abl, Tm1. Green signal shows expression of the trapped protein, magenta signal shows the background antibody signal (anti-brp). Green and magenta channels are merged so that regions with both trapped protein signal and background signal appear white or different colours according to the relative signal intensities.
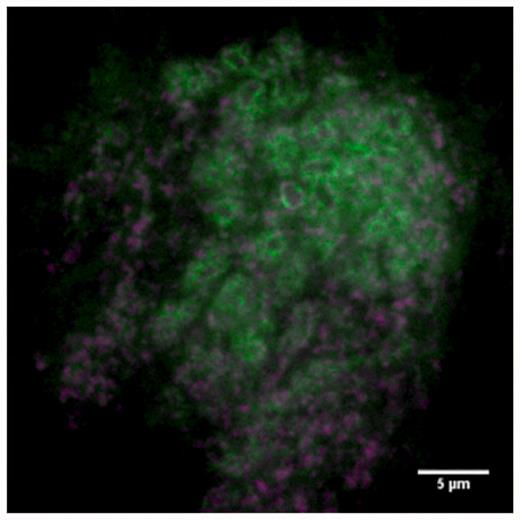
Sub-cellular localization. Green signal shows dlg1 localizing at synapses in the calyx of the mushroom body. Magenta shows pre-synaptic staining (anti-brp).
Using the annotation data from the first 100 lines some functional interactions in the adult brain can potentially be ruled out. Figure 8 shows interaction data from the Drosophila Interactions Database (DroID) (14) between proteins in the BrainTrap database. Most proteins with potential interactions are expressed in similar locations, but the two proteins highlighted in yellow, CG6854 and Zasp52, do not express in the same location as some of their potentially interacting partners, so these protein interactions may not occur in the brain. Localization for these proteins is summarized in Table 1.
Several proteins are expressed preferentially in particular areas of the brain. The combination of different proteins expressed in a specific area can provide insight into the properties of that region and how it compares to other regions. For example, heightened localization of synaptic proteins in one region indicates specificity of synapses varies with brain region and presumably function within that region (15). Selected brain regions and proteins preferentially expressed in each are shown in Table 2.
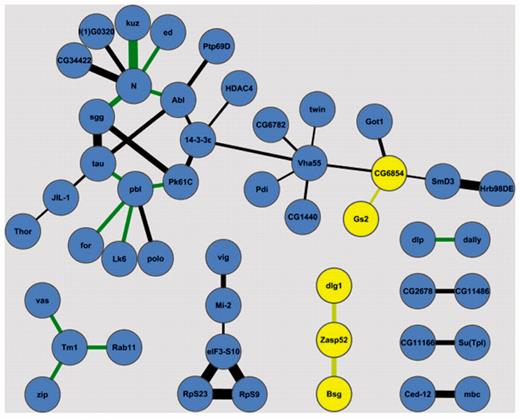
Potential interactions between proteins in the BrainTrap database. Proteins that do not co-express in the BrainTrap data are highlighted in yellow. Line thickness represents the confidence of protein interaction, green lines are genetic interactions. Interaction data is from the DroID database (14).
It is important to note that protein-trap insertion may produce phenotypes. Protein-expression levels and protein function may be changed and this can potentially have an effect on development or protein localization. In most cases heterozygous lines are used because some protein trap lines are homozygous lethal. For genes that have multiple transcripts the protein-trap insertion will sometimes trap a subset of the possible isoforms, so care must be taken to verify which isoforms have been trapped. This may be considered an advantage or disadvantage depending on the intended use of the protein trap line. Western blot analysis to verify the isoforms trapped by each CPT line is ongoing as part of the CPT project. These results and further details on specific lines are available on the FlyProt website.
Discussion
BrainTrap allows fast access to a large set of information; there are currently 100 lines and 187 3D datasets. A wide variety of expression patterns are observed within these 100 proteins. Areas or proteins of interest can be identified quickly with a simple search query and desired images can be accessed in a few mouse clicks.
Large-scale biological screens, such as the CPT Project, create huge amounts of raw data. Fast access to targeted information within this raw data is very important for the field of biological and brain science as large-scale screens continue to grow in size. Structured databasing and annotation of the raw information also allows further analysis to extract useful information from the large data sets.
The BrainTrap database will continue to grow as further CPT lines are released, providing a valuable resource for biology and brain research. Currently there are 100 lines available online with a further 400 pending and work is ongoing to scan and annotate these images. All scans will be made available on BrainTrap as they are released by the consortium (16). With more lines added to the database better interaction analysis will be possible as genome coverage is improved. In future brain images will be mapped to a template so that protein-expression patterns can be compared directly between different protein-trap lines. This will enable new types of comparative analysis and visualization to be performed on the website.
Funding
Funding from Engineering and Physical Sciences Research Council (EPSRC), Medical Research Council, Biotechnology and Biological Sciences Research Council (BBSRC), British society for Developmental Biology, Society for Experimental Biology and the Virtual Fly Brain e-Science Institute (ESI) Theme. Fly lines generated by the Cambridge Protein Trap Project (11), supported by a Welcome Trust grant to Kathryn Lilley, Steve Russell and Daniel St. Johnson and further details are available at http://www.flyprot.org. Funding for open access charge: Engineering and Physical Sciences Research Council and Biotechnology and Biological Sciences Research Council.
Conflict of interest. None declared.
