


Abstract
Shewanellae are facultative γ-proteobacteria whose remarkable respiratory versatility has resulted in interest in their utility for bioremediation of heavy metals and radionuclides and for energy generation in microbial fuel cells. Extensive experimental efforts over the last several years and the availability of 21 sequenced Shewanella genomes made it possible to collect and integrate a wealth of information on the genus into one public resource providing new avenues for making biological discoveries and for developing a system level understanding of the cellular processes. The Shewanella knowledgebase was established in 2005 to provide a framework for integrated genome-based studies on Shewanella ecophysiology. The present version of the knowledgebase provides access to a diverse set of experimental and genomic data along with tools for curation of genome annotations and visualization and integration of genomic data with experimental data. As a demonstration of the utility of this resource, we examined a single microarray data set from Shewanella oneidensis MR-1 for new insights into regulatory processes. The integrated analysis of the data predicted a new type of bacterial transcriptional regulation involving co-transcription of the intergenic region with the downstream gene and suggested a biological role for co-transcription that likely prevents the binding of a regulator of the upstream gene to the regulator binding site located in the intergenic region.
Database URL:http://shewanella-knowledgebase.org:8080/Shewanella/ or http://spruce.ornl.gov:8080/Shewanella/
Introduction
Shewanellae inhabit a wide range of niches; thriving as free-living cells in fresh and marine waters and sediments in conditions of atmospheric to high pressure, and at low to moderate temperatures as well as in association with higher life forms such as squid and fish (1, 2). Shewanellae’s ability to inhabit these diverse environments is likely enabled by diversification in gene content among different species and utilization of an expansive regulatory network to monitor and respond to the surrounding environment (3). By far, the most thoroughly researched aspect of their physiology has been their ability to conduct extracellular electron transfers to iron and manganese (hydr)oxides and to reduce radionuclides (1, 2, 4) with more recent studies directed at their use in microbial fuel cells (5–7). The surge in research on this organism over the last 10 years is in part due to the current public availability of 19 complete and two partial genome sequences from cultured isolates of Shewanella and to Department of Energy support for a distributed group of investigators collectively known as the Shewanella Federation (SF) to systematically investigate the metabolic potential of these species. The integrated genome-based studies of Shewanella ecophysiology performed by this group require significant collaborative efforts in the annotation of the genomes, designing and conducting experiments, and in sharing of data, information, and resources. The Shewanella knowledgebase (SKB) was initiated as a web resource tailored to these tasks as well as a means of integrating experimental data with genomic data.
The implementation of a systems biology approach to study ecophysiology of an organism relies on efficient compilation, integration and sharing of available experimental, ecological, and genomic data on this organism. Most biological databases, however, limit their content to genomic or experimental data associated with a specific cellular function or biological process, such as metabolic pathways (8), regulation (9, 10) or genome sequences (11). Thus, information associated with a single organism is scattered across different resources. Several recently developed databases address this problem by bringing diverse information into one resource for in-depth characterization of a microbe with a specific phenotype. Examples of such databases are Pseudomonas Genome Database (12), Systomonas (13), The Candida Genome Database (14), EchoBASE (15) and EcoCyc (16). This integrative approach has proved helpful in analyzing experimental data and in promoting biological discoveries. Similar to these databases, the SKB combines many independent data sources for the purpose of using existing knowledge to support efficient analysis of the experimental data. This infrastructure combines experimental data generated on members of the Shewanella genus, biological knowledge from the published literature, computational predictions made by specialized Internet databases, and analytical tools to produce new scientific insights. The inset ‘Resources’ in the SKB main menu summarizes the Internet resources employed by the knowledgebase for annotation of the Shewanella genomes, and for characterization of specific bacterial systems, including metabolism, transport, signaling, proteolysis, adaptive evolution and different types of regulation (9–10, 17–27).
Detailed annotation of a sequenced genome is essential for a comprehensive analysis of experimental data and for linking an organism’s genotype and phenotype. Although computational predictions can produce large quantities of information for sequenced organisms, the false positive/negative rate of such predictions is rather high (28). Manual annotation and the use of a reference genome can significantly improve the quality of computational predictions. Most databases for model organisms (12, 14, 16) have manually curated content. Manual curation significantly improves the quality and value of annotations, but it is a time consuming job for biologists, especially if the curation targets several genomes. An important feature of the SKB is, therefore, a multi-genome annotation environment consisting of ortholog and genome editors to facilitate manual curation of all sequenced Shewanella genomes. The editing environment uses the Shewanella oneidensis MR-1 (MR1) genome as a reference and makes use of computational predictions and experimental data to support both automatic and manual curation.
The SKB is a compilation of experimental and computational analyses of all sequenced Shewanella strains, with the majority associated with the model organism, MR1. The combination of these analyses and the SKB tools provides a unique capability allowing researchers to view experimental data in the wider context of computational predictions and to integrate the predictions into analysis. Such integration has already led to the development of a novel approach for linking phenotype and genotype of organisms and for deciphering the cellular mechanism underlying Shewanella cold tolerance (29).
In this study, we demonstrate the value of the SKB using one of the many SF studies involving MR1 Affymetrix microarrays designed to measure not only the expression of genes, but also the intergenic regions (IG) located on the same strand as the adjacent genes (30). This design supports the study of changes in expression of genes and IGs under different growth conditions. In prokaryotes, IG transcription has not been studied before by the expression profiling. Most previous studies of IG expression have used the tiling arrays or high throughput sequencing in model eukaryotic organisms (31). Such studies have revealed that genomes of eukaryotes including yeast, mouse, human and plants are pervasively transcribed. The transcription generates numerous untranslated transcripts that associate with different parts of an IG and have different length and stability. Biological roles of the intergenic transcription are unclear. Experimental studies in Saccharomyces cerevisiae have shown that the intergenic transcripts can mediate the transcriptional gene silencing by generation of antisense transcripts (32) or by continued transcription of gene regulatory regions (33). Untranslated transcripts can also play a role in maintaining an open chromatin structure at eukaryotic promoters (34). A recent study of the Bacillus anthracis transcriptome using high-throughput sequencing (35) has also shown a significant transcriptional activity in the bacterial IGs. Motivated by this observation, expression profiling of the MR1 IGs under different growth conditions in combination with SKB annotations and tools was used to explore the extent and the biological role of bacterial IG transcription. In this report, we describe an integrated analysis of experimental data from a study of the transition from aerobic to anaerobic growth in the wild-type strain of MR1 and in its Crp(−) mutant. This analysis suggests that overall IGs in the MR1 genome are extensively transcribed and detects a significant change in the level of IG expression in the Crp(−) mutant versus wild-type strain. A significant number of the transcribed IGs, which likely implement complex regulatory functions, cannot be attributed to bacterial operons. One of the functions suggested by our analysis using the SKB involves co-transcription of an IG with one of its adjacent genes in order to prevent binding of transcription factors regulating the other adjacent gene.
Knowledgebase description
A combination of physiological and omics data in SKB
In order to provide a system level characterization of MR1, the SF performed more than 40 experimental studies generating transcriptome, proteome, metabolome and biolog (a phenotype microarray for testing thousands of cellular phenotypes at once) data of wild-type and mutant strains cultivated under different physiological conditions. The SKB includes data produced at SF labs or published in the literature. The data is available as individual projects under the tab ‘Projects’ in the main menu. Relevant metadata, including a brief description of the experiment, its main objectives, experimental design and the principal investigator of the project, is provided for each project. In addition to a table presentation of the data, graphical data associated with experiments, growth curves and other images are also available for more complete descriptions of some projects, like ‘Physiology’ or ‘Biolog’.
The majority of the accumulated data (25 projects) was produced with microarray technology, Affymetrix or two-color microarray, for the model organism MR1. These projects usually employed a factorial design to test different culture and light conditions, growth stages, media components, a diverse set of carbon sources, e-donors, acceptors and their combination, as well as varying aeration, heat, pH, salt and exposure to heavy metals. A unique feature of the Affymetrix microarray data is the measurement of gene and IG expression as discussed earlier. The Affymetrix data sets were obtained from the Many Microbe Microarrays Database (30). Two SF experiments, referred to as FedEx, address metabolic pathways and regulatory networks involved in aerobic and oxygen-limited growth of MR1 and include transcriptional and proteome analyses.
Screening of the MR1 transcriptome is accompanied by a comprehensive physiological and phenotypic characterization of several of the Shewanella strains using two complementary technologies: biolog phenotype microarrays and different culture conditions. The physiological studies conducted include the response to environmental factors, such as temperature and salinity, response to different carbon sources, such as fatty acids and sugars, and response to different electron acceptors. The project ‘MR1CloneSet’ provides a comprehensive collection of MR1 genes constructed using the lambda recombinase (Gateway) cloning system. The MR1CloneSet includes 3584 individual ORFs (85%) cloned into the entry plasmids. Another project named ‘Mutant’ provides information on over 200 mutants generated by SF members. Mutants of genes involved in redox reactions (most c-type cytochromes, terminal reductases and hydrogenases), secretion, central metabolism, signaling and regulation are included in the list. Many of the mutants are bar coded (tagged with short synthetic oligonucleotides). Some mutants contain multiple mutations (arcA/etrA, arcA/crp, etrA/crp, etc.). SKB also contains three data sets with 3-D structures of Shewanella proteins. Structural information on Shewanella proteins generated at Argonne National Laboratory or by the Joint Center for Structural Genomics (JCSG) using high-throughput X-ray crystallographic technology is available under projects ‘Protein structure target—Argonne’ and ‘Protein structure target—JCSG’. A third data set with 3D structures of proteins that have been deposited in Protein Data Bank (PDB) is available as a separate project. Protein sequences are mapped to locus tags from the recent annotations integrating the protein structure data with the rest of the data in SKB.
Multi-genome annotation solution: integration of ortholog and genome editors
To facilitate annotation of the 21 sequenced Shewanella genomes the SKB provides an editing environment for manual curation of protein-encoding gene models and functional annotations. A distinctive feature of this environment is the availability of two interfaces by which a curator can edit the genome annotations, one that enables editing of fields associated with either the gene models or functions encoded by a single genome and another that enables manual curation of functional annotations for orthologous sets of genes and the gene membership within an orthologous group. The ortholog editor interface enables simultaneous annotation of genes from multiple genomes, thereby dramatically reducing the amount of manual curation necessary. It immerses the curator in a comparative genome environment that facilitates, for example, identification of inaccuracies in the gene model, identification of laterally acquired genes and discovery of key functional differences between the sequenced strains.
Both editor interfaces enable curation of product descriptors, a more lengthy functional description, gene names, EC numbers, predicted subcellular localization and functional subsystem assignment, thereby enabling transfer of information recorded in these fields from the ortholog editor to the same fields in the appropriate genome editors. Both interfaces also enable the curator to add new records so that new genes or new ortholog groups can be appended to the database. Additional curatable fields unique to the ortholog editor include one that denotes paralogous group IDs and others that indicate the locus tags of proteins that belong to the orthologous group (Figure 1a). In addition, the curator is provided with links to pre-computed alignments of protein sequences and tables listing protein size and domain content associated with orthologous proteins to facilitate curation of group membership and to suggest inaccuracies in the gene model (e.g. missing genes or inaccurate start codons).
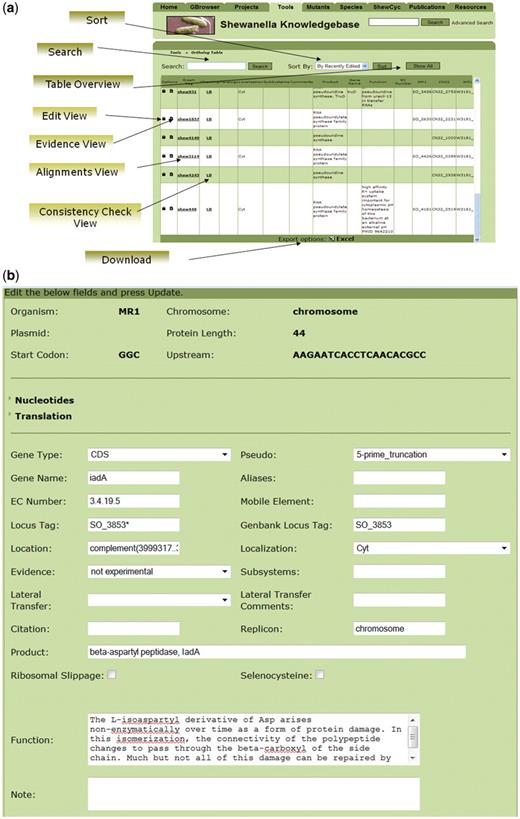
Interplay between the ortholog and genomes editors in SKB (a) and the interface for curation of the Shewanella orthologous table (b). The interface provides access to different types of product annotations, to sequence alignments and to results of the automatic checking of the consistency on protein length and protein families across products of the orthologous group.
The individual genome editors uniquely include curatable fields for adjusting the gene location and assigning new locus tag thereby enabling curation of gene models (Figure 1b). By also including curatable fields that track the nature of disruptions to genes (e.g. frameshifts, point mutations, 5′- or 3′-truncations) and the occurrence of translational reprogramming (e.g. ribosomal slippage, selenocysteine), and by indicating the positions of frameshifts within the gene location field it was possible to develop a script that automatically produces a current FastA file of all proteins and genes (including pseudogenes) at the click of a button for use by researchers wishing to conduct other analyses (e.g. prediction of protein localization, identification of peptides in proteome data sets, interpretation and design of microarrays). As an additional feature for researchers using the site, both the genome and ortholog editor interfaces provide a means to generate up-to-date tab-delimited tables listing values of the fields present within each editor database (ortholog or genome specific) and information indicating when and by which curator fields for a gene or an orthologous group was edited.
Because MR1 was the first genome sequenced and has the most experimental data (transcriptomics and proteomics) associated with it, the genome has also received the most attention regarding curating its gene model. Proteome data has been used to determine whether hypothetical genes encode proteins (36–38) and to search for evidence supporting predicted N-termini of the encoded proteins (39). Mobile elements (insertion sequences and miniature inverted repeat transposable elements) have been mapped to the chromosome to identify disrupted genes (40). In addition, comparative sequence analysis across orthologous proteins in Shewanella and with more distantly related bacteria have been used to manually adjust gene start codons and to identify genes that were missed by automated gene calling methods. The current gene model is consequently significantly improved with numerous genes dropped (596), new genes identified (89) and start positions changed (597) and enabled us to better assess transcriptome data for non-coding RNAs.
Characterization of MR1 regulation and its overlay with the experimental data in ShewRegDB
Understanding regulatory processes that control metabolic, structural, and behavioral adaptations to changes in the environment are at the heart of systems biology research. Numerous experimental and bioinformatics analyses focused on characterizing S. oneidensis MR-1 regulatory networks have been published in the literature and/or compiled in various databases. ShewRegDb was developed as a component of the SKB to collect this information and to visualize it in the context of other types of experimental and genomic data. Computational predictions of the regulatory elements were collected from the published literature and from internet resources such as Rfam, RibEx, TractorDB, RegTransBase, BioCyc and PromScan (9–10, 24, 25, 41–46). The collected information was analyzed to identify the types of regulatory data that were available so that appropriate structural presentation could be developed in the relational database. The data types identified include transcriptional regulator and sigma factor binding sites, operon structures, promoters, regulons and regulatory RNAs. The last category encompasses a diverse class of regulators including non-coding RNAs, tRNA, rRNA, translational and transcriptional terminators, antiterminators, anti-antiterminators and riboswitches. Visualization of the information was implemented by configuring the generic genome browser from the Generic Model Organism Database (GMOD) Toolkit (47) for specific features of the collected data, like the expression of the IG. Users can overlay the regulatory information with the experimental data by selecting them from a list of preprocessed data sets. This option (‘select experimental data set’) is available from the genome browser page. The organization of the database and the genome browser has been described in more detail (48). An example of the regulatory information and experimental data integration is considered in the case study.
ShewCyc
Support for comparative analysis of metabolism across multiple Shewanella species has been implemented by the construction of ShewCyc, which contains pathway genome databases (PGDBs) of the species and pathway tools (49) to query the databases and overlay the metabolic information with experimental data. ShewCyc hosts a manually curated PGDB, SheonCyc, for MR1 and automatically constructed PGDBs for 16 species. To improve quality of the automatic reconstruction, we have used the curated MR1 PGDB as a reference database and our manually curated orthologs table of the species described above to annotate the species with enzyme names and EC numbers. ShewCyc tools provide a diverse set of options to query and to visualize information in the databases using the Pathway Tools software (50). An example of overlaying the metabolic information with experimental data is given below.
Revealing the biological role of the IGs transcription using knowledgebase: a case study
Several SF transcriptomic and proteomic analyses were conducted to investigate MR1 cellular adaptations that occur during transitioning from aerobic to anaerobic growth on fumarate. While the data collected was initially examined only to identify differentially expressed genes and proteins, further biological insights into MR1 behavior can be derived from the same data set through integration with other data types within the SKB, enabled by SKB tools. Below, we provide an example of such an analysis of the data from one of the SF studies (Project ‘PNLcrp’). The experimental data chosen was produced using Affymetrix microarray’s designed to probe transcripts derived from both genes and IGs (51). Probes of IGs included on the array were intended to probe a transcription of regions between two closest genes with a unidirectional orientation. IGs for convergent and divergent orientations of genes were not included in the microarray design. Some of the IGs probed by the microarray were rather long and included opposite strands of two or more genes, i.e. they represented antisense transcription. For example, the IG labeled as SO0016_SO0022 was downstream of SO0022 and upstream of SO0016, and transcription of the IG was assumed from the ‘plus’ strand, i.e. in the same direction as the up- and downstream genes. In the example, the IG transcription was from the stop codon of SO0016 to the start codon of SO0022 and included antisense sequences of five predicted genes transcribed from the ‘minus’ strand. If two genes were transcribed from the ‘minus’ strand, then the IG between them was also considered to be transcribed in the same direction. For example, transcription of the IG labeled as SO0197_SO0196 was assumed from the negative strain. This IG did not include antisense sequences of genes, but its transcription might prevent binding of a regulator of the upstream gene, which was SO0196. The microarray was used to measure abundances of transcripts extracted from wild-type and a Crp(−) mutant (52). The RNA was collected at various time points (0, 20, 40, 60, 90, 120 min, 4, 8, 12, 24 h, steady-state) during the transition from aerobic growth with lactate to anaerobic growth with lactate and fumarate. The focus of our study was to examine changes in expression of IGs and how these changes correlated with changes in expression of the genes that were adjacent to the IG and transcribed in the same direction. Using SKB tools, we also addressed questions about a biological role of the IG transcription, namely, if generation of antisense transcripts in the studied conditions plays a role in gene silencing or in changing accessibility of regulators to their binding sites in gene promoters.
Almost half of the IGs and more than half of the genes significantly change their expression level in the Crp(−) mutant relative to the wild-type during the transition from aerobic to anaerobic growth
To identify IGs and genes with significant changes in gene expression the statistical analysis of the data was implemented as a two class unpaired experiment, with one class referring to the Crp(−) mutant and the other to the wild-type strain of MR1. Biological replicates and time points were combined because of the high pair-wise correlation between them (87–99%) across genes and IGs within either the wild-type or Crp(−) mutant expression profiles (Supplementary Data 1). Stanford Significance Analysis of Microarray (SAM) software (53) was used for the analysis with the recommended parameters and a threshold for false discovery rate of 0.06%. Results of the analysis (Supplementary Data 2) revealed that almost half of the IGs and more than half of the genes significantly changed, either decreased or increased, the level of their expression in the Crp(−) mutant relative to the wild-type. The percentage of IGs yielding significantly decreased expression was about the same (28%) as the percentage of genes that were repressed (31%). About 15% of IGs and 21% of genes had a significantly increased level of expression. Thus, a change in the growth condition in combination with the knockout of Crp, a regulator of the MR1 response to the change, induced significant transcriptional reprogramming of not only genes, but also of IGs in the MR1 genome.
Many IGs are transcribed with only up- or downstream gene, but not as a part of the operon
One potential explanation of significant changes in transcription of an IG is that these changes may be coordinated with the transcription of the adjacent genes. This was the initial hypothesis of the study underlying the microarray design. Each IG probed by the array had adjacent genes transcribed in the same direction. The IG and its up- and downstream genes could belong to the same operon and were transcribed and changed their expression together. To validate the hypothesis we have examined whether changes in IG transcription levels correlate with the expression of the adjacent genes (up- and downstream). We averaged the expression levels across time points and replicates for each strain and calculated the log(2) ratio of the average values for IGs/genes so that changes in the expression level of each IG and its adjacent genes in the mutant strain versus the wild-type strain could be compared. Microarray data was re-mapped to the current MR1 gene models, which have been extensively manually curated (see ‘knowledgebase description’ for details), to update the assignment of the IGs/genes and then compiled in a table (Supplementary Data 3) comprised of the IG log(2) ratio along with current annotations and log(2) ratios of its up- and downstream genes. Pearson correlation coefficients between changes in expression of the IG and its up- and downstream genes were calculated (‘Bioinformatics TOOLBOX’ in ‘Tools’) (Figure 2).
![Pearson correlations of changes in the expression [log (2) ratio of the average expression level in Crp(−) mutant versus wild-type strain] of IG regions with changes in the expression of upstream and downstream genes. The analyzed data sets are provided in the Supplementary Data 3. Subset I (1466): IG regions with the same direction of change in gene expression as their neighboring genes. Subset I_S (449): A selection of IG regions from Subset I with significant changes in gene expression in the IG regions and in the neighboring genes. Subset A (805): IG regions with directions of changes in gene expression that are opposite to upstream genes. Subset A_S (54): A selection of IG regions from Subset A with significant changes in gene expression in the IG regions and in the neighboring genes. Subset B (820): IG regions with directions of changes in gene expression that are opposite to downstream genes. Subset B_S (48): A selection of IG regions from Subset B with significant changes in gene expression in the IG regions and in the neighboring genes.](https://oup.silverchair-cdn.com/oup/backfile/Content_public/Journal/database/2010/10.1093_database_baq012/1/m_baq012f2.jpeg?Expires=1781641485&Signature=LJ2RIIaKp--bmTewpWdZEeyoY-fc~4z6udXuRoNiyg-ODBFY2EW-BLx7lXvFcfEFqftCzm3q1cRWQ~OY-eCDnmbLmwZxB35ibkvcRU3EhZQJvVGRFldVpULqrKwYsTBkj7SJlyVE6neDC~zRP9lFQ-sdq~-QFbxtfv7nSGmKWW9qXgXG3VCZ9xz6nUiOabu2GrZG9Rdu64ByBa5RNonT2nj8gyy4ou5VNbbjDVnMo7Soasl3Aym-L-31i~Ve~B6mDbddDO2K4r8zdf63ciXqnCgqmdcKSrxVADzXHrTqYy9Use7E2SELJhsevQrQFymt3iRnb~S2MYXcz4a7FxLlXg__&Key-Pair-Id=APKAIE5G5CRDK6RD3PGA)
Pearson correlations of changes in the expression [log (2) ratio of the average expression level in Crp(−) mutant versus wild-type strain] of IG regions with changes in the expression of upstream and downstream genes. The analyzed data sets are provided in the Supplementary Data 3. Subset I (1466): IG regions with the same direction of change in gene expression as their neighboring genes. Subset I_S (449): A selection of IG regions from Subset I with significant changes in gene expression in the IG regions and in the neighboring genes. Subset A (805): IG regions with directions of changes in gene expression that are opposite to upstream genes. Subset A_S (54): A selection of IG regions from Subset A with significant changes in gene expression in the IG regions and in the neighboring genes. Subset B (820): IG regions with directions of changes in gene expression that are opposite to downstream genes. Subset B_S (48): A selection of IG regions from Subset B with significant changes in gene expression in the IG regions and in the neighboring genes.
We found a significant correlation between the expression of IGs and either the expression of its upstream or its downstream gene (Figure 2) across all IGs. Even higher correlation (R = 0.77–0.79) was found among the 548 IG and genes that were selected by SAM, i.e. those that showed significant changes in the expression level. Surprisingly, we did not find the same level of correlation between up- and downstream genes in the compiled table. In fact this correlation was twice as low as between an IG and either its up- or downstream gene (Figure 2). About 50% of the analyzed IGs had a different direction of change in the expression [Crp(−) mutant versus wild-type strain] relative to one or both adjacent genes (Supplementary Data 3), even if they belonged to known operons in ShewRegDB(‘Operon Search’).
Gene silencing by generation of antisense transcripts is not a likely regulatory mechanism in the studied conditions
The transcription of long IGs containing antisense sequences of one or more genes might exert a silencing effect on the genes. Such regulatory effect has been reported for eukaryotes (32). To check the hypothesis, we selected the long IGs spanning antisense sequences for 1, 2, 3 or 4 genes and analyzed correlation between changes in the expression level of the genes and changes in the expression level of the corresponding antisense IGs (Supplementary Data 4). If the antisense IG transcription exerted a silencing effect on the corresponding genes in the studied condition, we would observe a negative correlation between the IGs and genes in the data set. In fact, we found a low positive correlation (R = 0.20) indicating that antisense transcripts do not silence genes transcribed from the opposite strand in the studied conditions. Thus, the regulation of gene transcription by generation of antisense transcripts is not a likely regulatory mechanism in bacteria.
Changes in the IG transcription have a regulatory effect on one of the adjacent genes
Another potential biological role of IGs transcription proposed for eukaryotes is its regulatory effect on adjacent genes through continued transcription of the gene promoters (33). To examine if this regulatory mechanism takes place in MR1, we subdivided the IGs into three subsets according to the consistency of changes in the levels of IG, up- and downstream gene expressions. Subset I was comprised of IGs with the same direction of change (up- or downregulation) as their adjacent genes. Subset A was comprised of IGs with changes in expression that similar to that of their downstream genes and opposite that of their upstream genes. Subset B was comprised of IGs with change in expression similar to that of their upstream genes and opposite that of their downstream genes. We expected that Subset I would be comprised of IGs that are part of the same transcript as both adjacent genes and that consequently there would be high pair-wise correlations between levels of IG, up- and downstream gene expression. Subset A consists of IGs that are transcribed with their downstream genes but not with the upstream gene, so we expected to find correlation between an IG and its downstream gene but not between an IG and its upstream gene. Similarly, in the Subset B we expected to find correlation only between an IG and its upstream gene. For each of the subsets we also analyzed Pearson correlations by further selecting those IGs and adjacent genes with significant changes found by the SAM analysis. We did not consider those IGs with changes of expression opposite to that of both adjacent genes; only three IGs were in this category.
Results of the correlation analysis are presented in Figure 2 and reveal some unexpected regularities in the IG transcription. The correlation pattern proposed for Subset I, namely, about the same level of high pair-wise correlation among an IG, its up- and downstream gene, was confirmed by the analysis. This pattern suggests that most IGs are transcribed with their adjacent genes as one transcription unit. The correlation patterns in Subsets A and B were unexpected. On one hand, we do find high correlation of the IGs with downstream genes in Subset A and with upstream genes in Subset B, which suggests that in these subsets the IG is transcribed with its downstream gene (Subset A) or with its upstream gene (Subset B). But, on the other hand, in each of the subsets, there was a significant negative correlation between expression levels of the IG and its other adjacent gene, and also between the adjacent genes. According to the correlation pattern in the Subset A, the transcription of the IG occurs together with the downstream gene, and an increase in the level of the transcription corresponds to a proportional decrease in the transcription of the upstream gene. In the Subset B, the IG is transcribed together with the upstream gene, and an increase in the transcription corresponds to a proportional decrease in the transcription of the downstream gene. Thus, in both cases the IG transcription has an obvious regulatory effect on the adjacent gene with the direction of the effect that is opposite to direction of changes in the IG transcription. It means that, similar to eukaryotes, continued transcription of gene regulatory regions is a likely mechanism of bacterial transcriptional gene regulation.
Discovering a biological role of the IG transcription using SKB tools
To understand details of the regulatory mechanism implemented through the IG transcription, we employed SKB tools and explored a specific example from the Subset A (Supplementary Data 3) of a significantly downregulated [in the Crp(−) mutant] IG (SO2490_SO2491) located downstream of the genes encoding the transcriptional regulator, HexR (SO2490) and upstream to the gene encoding pyruvate kinase II, PykA (SO2491). HexR is also significantly downregulated in the mutant, but pykA is significantly upregulated. To find out more about the roles of the genes, we first employed ShewCyc tools. Using the manually curated PGDB for MR1 in ShewCyc (Figure 3), we noted that the pyruvate kinase catalyzed the glycolytic conversion of phosphoenolpyruvate into pyruvate coupled to the synthesis of ATP. The enzyme participates in different metabolic pathways that include glycolysis, mixed acid fermentation and anaerobic respiration. Thus, PykA has a rather general metabolic function and is important for the bacterial growth on different carbon sources (54). Furthermore, the enzyme is under control of HexR, its upstream neighbor, which can repress pykA transcription. Further querying of ShewCyc (Figure 3b) reveals that HexR can repress not only pykA but also enzymes of the Entner–Doudoroff (ED) pathway transcribed from the four gene operon (zwf-eda-edd-pgl), which is located upstream of the hexR, but on the opposite strand. In Escherichia coli, enzymes of the ED pathway are induced by growth on gluconate, glucuronate, or galacturonate and participate in glucose catabolism of strains devoid of a key metabolic enzyme (55, 56). Considering the fact that pykA has more general metabolic functions than the ED operon, the activation of the ED suppressor hexR should affect the activity of the ED enzymes operon, but not pykA activity, which may be important for other cellular functions. Transcription of the pykA promoter, which contains the HexR binding site, together with the hexR gene is a straightforward way to implement this type of regulation.
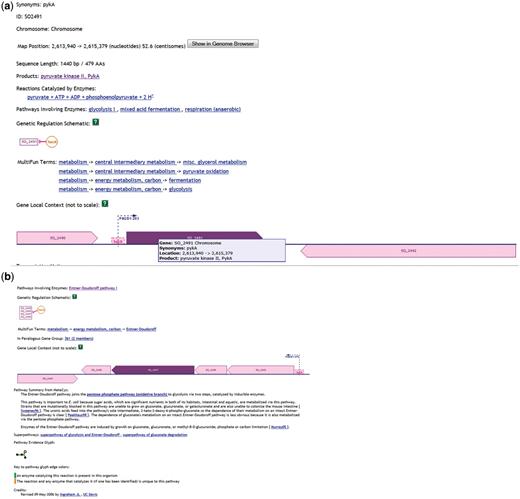
Information from ShewCyc on PykA (a) and HexR (b) in the MR1 pathway genome database.
The information from ShewCyc helped us to understand why the transcription of HexR occurs together with the downstream IG harboring the inhibitor binding site. However, it did not explain the observed downregulation of the inhibitor in the Crp(−) mutant. Additional information on regulation of the genes and an overlay of the regulatory information with the gene expressions in the study can be obtained querying ShewRegDB and using Gbrowser of the database to visualize the results (Figure 4). The figure shows that hexR, pykA and the ED operon have predicted Crp binding sites in their promoters listed in TractorDB, therefore, the absence of Crp in the mutant can explain the observed changes in the expression of genes and IGs in the genomic locus.
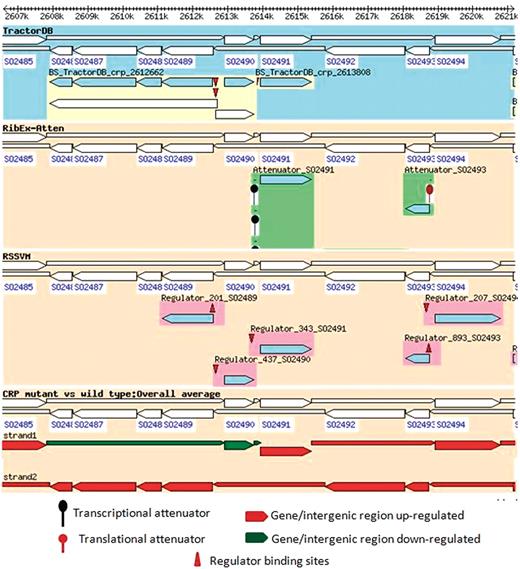
Regulation of pykA, hexR and enzymes of the ED pathway in MR1 and overlay of the regulatory information with the experimental data. The figure indicates that enzymes of the ED pathway (SO2486_ SO2489) as well as pykA are significantly upregulated in the Crp(−) mutant, but hexR and the intergenic region between hexR and pykA are downregulated. The regulatory information provided in the first track of the browser (TractorDB) gives an explanation for the observed changes in the gene expressions. It indicates that the genes, hexR and pykA and the operon with the enzymes of the ED pathway have binding sites in their promoters predicted by TractorDB. Thus, both genes and the operon are likely regulated by Crp. In the wild-type strain of MR1, the ED pathway is not active because of upregulation of hexR by Crp during the transition from aerobic to anaerobic conditions. The Crp(−) mutant strain does not produce Crp; therefore, the transcriptional repressor HexR is absent in the mutant, and enzymes of the ED pathway, which were suppressed by HexR in the wild-type strain, are upregulated in the Crp(−) strain.
Integrating the information on ED pathway, HexR and PykA functioning and regulation collected using SKB tools we can suggests that co-transcription of SO2490_SO2491 IG with its downstream gene SO2490 (hexR) likely prevents binding of HexR, a transcriptional regulator of the upstream gene SO2491 (pykA), to HexR binding site located in the IG.
Predicting regulator binding sites using SKB
The ortholog editor of the knowledgebase provides further information on how conserved the regulatory mechanism involving co-transcription of hexR and its downstream IG is across Shewanella species and allows identification of the consensus binding site for the regulator. The SKB orthologs table (Tools→Ortholog Editor→Show All) sorted by the MR1 genome order shows that the ED operon, hexR and pykA have orthologs in all sequenced species and represent a conserved synteny, i.e. the order of genes in all genomes is the same. The ‘Genome Editor’ tool in the SKB allowed us to extract the IGs discussed above in all sequenced species, align them using Muscle (57) and then visualize by Jalview (58) using the ‘Bioinformatics TOOLBOX’ (Tab ‘Tools’). Using the alignment (Figure 5) we reveal a conserved HexR binding site, which is perfectly matched to the Pseudomonas aeruginosa binding site (59), and, in addition, the consensus binding site for ArcA, which likely activates the ED operon in aerobic conditions (45).
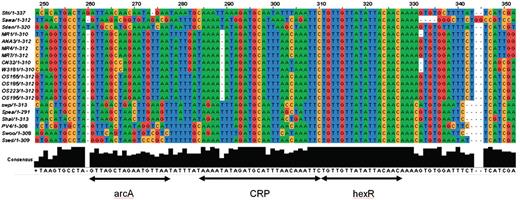
The alignment of a conserved regulatory locus in the Shewanella genomes in the intergenic region between hexR and zwf genes. The locus is located from −56 to −103 nc upstream of zwf and has three adjacent binding sites for ArcA, HexR and Crp, respectively. The Crp binding site (TAAAAATAGATGCATTTAACAAATTC) was extracted from ShewRegDB. It was predicted by TractorDB (24). The HexR binding site is identified by similarity to HexR binding site consensus in Pseudomonas species (60, 61). The HexR binding site in Shewanella perfectly matches the Pseudomonas aeruginosa binding site (TGTTGTttaattACtACA) with the same location (−71 nt 5′ of the transcriptional start site of zwf (59). Binding of HexR to this binding site in P. aeruginosa was experimentally confirmed by gel shift assays. The HexR binding site in Shewanella has a perfect consensus TGTTGTTATATTACAACA across the species. The alignment also indicates that in Shewanella spp. the HexR binding site overlaps the Crp binding site. Thus, in some growth conditions, the ED pathway may be activated by Crp, but HexR binding to the site can prevent the pathway activation. In the Crp(−) mutant, hexR is downregulated and releases the ED operon for activation by other transcription factors, like ArcA, for example. One of the binding sites for the two-component response regulator ArcA is demonstrated with the consensus (5′-GTTAgctagAATGTTA-3′).
Conclusion
The unique combination of experimental data, computational predictions, curated genome annotations and visualization tools in SKB provides a unique opportunity for researches to discover new biological regularities not only related to Shewanella species, but also to all bacterial organisms. The presented case study demonstrates only some of the available opportunities and capabilities. Although the biological role of IG transcription suggested in the study is only a hypothesis and will require further experimental validation, the discovery of the potential role was significantly facilitated by the collected information and the tools provided in SKB.
Funding
Shewanella Federation consortium; Genomic Science Program of the Office of Biological and Environmental Research; US Department of Energy (DOE). Funding for open access charge: Office of Biological and Environmental Research, U.S. Department of Energy (DOE).
Conflict of interest. None declared.
Acknowledgements
We thank members of the Shewanella Federation for their contribution in developing the resource and in data submission. We are especially grateful to Jim Fredrickson, Anna Obraztsova, Miriam Land, Timothy Gardner, Alexander Beliaev, Mary Lipton, Grigoriy Pinchuk, Lee Ann McCue and Dmitry Rodionov. We also want to thank anonymous reviewers of the manuscript for thoughtful suggestions and comments on the study.
