


Abstract
The Comparative Toxicogenomics Database (CTD) is a public resource that promotes understanding about the effects of environmental chemicals on human health. CTD biocurators read the scientific literature and convert free-text information into a structured format using official nomenclature, integrating third party controlled vocabularies for chemicals, genes, diseases and organisms, and a novel controlled vocabulary for molecular interactions. Manual curation produces a robust, richly annotated dataset of highly accurate and detailed information. Currently, CTD describes over 349 000 molecular interactions between 6800 chemicals, 20 900 genes (for 330 organisms) and 4300 diseases that have been manually curated from over 25 400 peer-reviewed articles. This manually curated data are further integrated with other third party data (e.g. Gene Ontology, KEGG and Reactome annotations) to generate a wealth of toxicogenomic relationships. Here, we describe our approach to manual curation that uses a powerful and efficient paradigm involving mnemonic codes. This strategy allows biocurators to quickly capture detailed information from articles by generating simple statements using codes to represent the relationships between data types. The paradigm is versatile, expandable, and able to accommodate new data challenges that arise. We have incorporated this strategy into a web-based curation tool to further increase efficiency and productivity, implement quality control in real-time and accommodate biocurators working remotely.
Database URL:http://ctd.mdibl.org
Introduction
Phenotypes (including many disease) result from interactions between genes and the environment. An important component of the environment is chemicals. The Comparative Toxicogenomics Database (CTD) was developed as a tool to help investigators understand the connections between environmental chemicals and gene products, and their effects on human health (1–5).
CTD curates and integrates data from various sources to produce a robust database of toxicogenomic connections that might not otherwise be apparent for chemicals, genes, diseases, Gene Ontology (GO) annotations and molecular pathways (1). Not only is CTD a source for primary, manually curated data from the peer-reviewed literature, but also via unique integration and statistical methods, CTD also enables discovery of novel inferred relationships. For example, ‘GeneComps’ and ‘ChemComps’ are exclusive CTD metrics that identify genes and chemicals with similar toxicogenomic profiles based upon shared chemical–gene interactions, instead of molecular structure (6). Additionally, GO and pathway annotations (used exclusively as gene attributes at other databases) are uniquely statistically enriched for CTD chemicals, based upon their curated interacting genes (1). Finally, inference network scores calculated using local network topology-based statistics help evaluate CTD's novel, inferred chemical–disease connections (King et al., manuscript submitted for publication).
To help build the curation content of CTD, biocurators read the scientific literature and manually curate three types of molecular interactions: chemical–gene, chemical–disease and gene–disease relationships (Figure 1). This triad of core data is then integrated to generate novel, inferred chemical–gene–disease networks. As well, GO annotations (7), KEGG (8) and Reactome (9) pathways are brought into CTD through the shared used of official gene symbols and accession identifiers (IDs). These external data are similarly integrated with CTD core data to yield additional novel, inferred relationships (Figure 1). Thus, CTD is larger and more informative than the sum of its individual curated parts and currently contains close to 5 million different types of toxicogenomic relationships (Table 1).
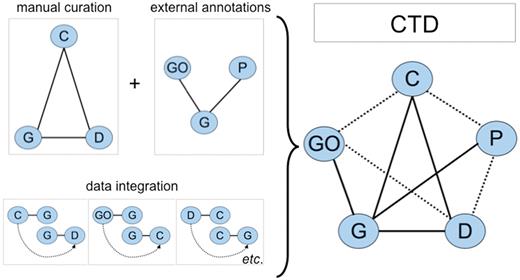
CTD data. Biocurators manually curate a triad of core interactions (solid lines) between chemicals (C), genes (G) and diseases (D) from the literature. These data are combined with external annotations from Gene Ontology (GO) and KEGG/Reactome pathways (P) via the shared use of NCBI Gene IDs. A unique feature of CTD is the inferred relationships generated by data integration: if a GO term is annotated to gene G, and independently gene G directly interacts with chemical C (via a curated interaction), then the GO term has an inferred relationship to chemical C (inferred via gene G). Data integration between these five nodes (C, G, D, GO and P) additionally yields novel, inferred relationships (dashed lines). In total, CTD becomes larger and more informative than the sum of its individual curated parts.
CTD data content (as of 3 May 2011)
| Data types | Count |
|---|---|
| PubMed articles | 25 472 |
| Chemicals | 6801 |
| Genes | 20 936 |
| Diseases | 4343 |
| Organisms | 330 |
| Manually curated interactions | |
| Chemical–Gene | 325 342 |
| Chemical–Disease | 11 378 |
| Gene–Disease | 13 187 |
| External annotations | |
| Gene–GO | 866 840 |
| Gene–Pathway | 60 142 |
| Integrated relationships | |
| Inferred Chemical–Disease | 323 070 |
| Inferred Gene–Disease | 1 561 889 |
| Enriched Chemical–GO | 1 239 773 |
| Enriched Chemical–Pathway | 143 147 |
| Inferred Disease–GO | 254 329 |
| Inferred Disease–Pathway | 26 889 |
| CTD total | 4 825 986 |
Manual curation is the keystone to CTD. It assures the high quality and accuracy of core data, which is essential in that these data form the basis of the inferred relationships generated via data integration. To expedite manual curation, CTD took two approaches, which we describe here: (i) implement a simple, yet robust, paradigm in the form of a structured, disciplined notation to streamline and standardize manual curation and (ii) develop a web-based curation application to allow data to be rapidly entered, reviewed and published.
Curation process
Biocurators
All CTD biocurators have a PhD in a relevant scientific discipline and previous experience in manual curation. Biocurators first undergo extensive onsite training and are provided with an official proprietary curation manual. They also subscribe to a group email list, which allows them to post questions to a lead biocurator, who checks in with each team member on a biweekly basis. As well, all biocurators take part in a monthly conference call. This continual communication ensures that the entire team is kept abreast of procedures, and quickly resolves any policy issues that may arise. The rigorous upfront training and constant communication also helps to ensure curation consistency and standardization, resulting in high precision and recall rates for CTD biocurators (10).
Most CTD biocurators work remotely, submitting data via the internet. This has several advantages: (i) it allows for recruitment of the most qualified applicants without a need for relocating, (ii) it eliminates financial and environmental costs of conventional commuting to an office, (iii) it reduces institutional overhead costs and (iv) it helps increase the quality of work-life balance, leading to more content, productive biocurators. This increasing number of CTD biocurators working remotely strongly justified the need for a web-based curation tool.
Articles for curation
CTD only curates scientific articles that have a PubMed Identifier (PMID) (11). This allows all curated data to be directly linked to the PubMed interface and provides users with access to the cited literature. Papers are triaged monthly for chemicals from a priority list, which includes compounds of interest identified from six sources: Superfund Basic Research Program (12), ToxCast (13), National Toxicology Program (14), two collaborative research groups and ongoing user requests sent directly to CTD via our ‘Contact’ link. Chemicals are prioritized based on a score that reflects the number of sources citing each chemical. Selected chemicals undergo literature triaging (performed manually by a lead biocurator) using iterative queries of PubMed until a satisfactory corpus is achieved based upon the number and quality of returned articles. High priority chemicals are periodically revisited for updated curation.
Biocurators read and curate the abstract of an article; however, they often go to the full text in order to resolve ambiguities in the abstract, such as species or gene identity. Once in the full text, the biocurator will also often capture additional data not found in the abstract, resulting in deep coverage of curated content, including, when necessary, data found in supplementary tables. An important policy of CTD curation is that biocurators curate data for every chemical emphasized in an article, not just the chemical for which the paper was initially targeted. Thus, papers curated for target chemical C1, might also include data for chemicals C2, C3 and C4. This strategy eliminates the need to re-curate the paper in the future and also rapidly increases the number of chemicals with curated content in CTD. For example, although only 540 chemicals (47% of the priority list) have undergone targeted curation, CTD actually contains data for 6801 compounds (Table 1), a13-fold increase due to comprehensive curation of chemicals within articles.
CTD-controlled vocabularies
CTD's paradigm uses controlled vocabularies, which allow for streamlined curation, consistency, quality control (QC) and data to be more easily aggregated and analyzed. The CTD Gene vocabulary is based on official gene symbols from NCBI Gene (14). The CTD Chemical vocabulary is a subset of the Chemicals and Drugs branch of National Library of Medicine's Medical Subject Headings (MeSH) (15). The CTD Disease vocabulary is a composite of both the Online Mendelian Inheritance in Man (OMIM) and the MeSH Disease branch (15, 16). For the latter, CTD manually reviewed and mapped OMIM disease terms to the MeSH Disease branch to produce a single unique vocabulary that allows inclusion of OMIM genetic diseases within a hierarchy that can be easily navigated between broad and granular disease levels (Davis et al., manuscript in preparation). Finally, all CTD interactions are annotated to the species used in the experiment. The CTD Organism vocabulary uses the Eumetazoan subset of the NCBI Taxonomy (11). All controlled vocabularies have unique official terms and accession IDs as well as many unique and non-unique synonyms.
A CTD Action vocabulary was produced in-house to describe a range of molecular interactions between a chemical, gene or gene product, and disease (Figure 2, middle). Each of the 55 action terms has an associated mnemonic code that intuitively reflects the type of interaction, which is used by biocurators to capture data relationships. Examples include: exp (expression), act (activity), loc (localization), pho (phosphorylation), m (disease marker) and t (disease therapeutic). To avoid duplication with existing ontologies and maximize the potential for data aggregation in the future, we cross-referenced our terms with other ontologies in the public domain. CTD's action term vocabulary is searchable at the National Center for Biomedical Ontology's BioPortal site (17).
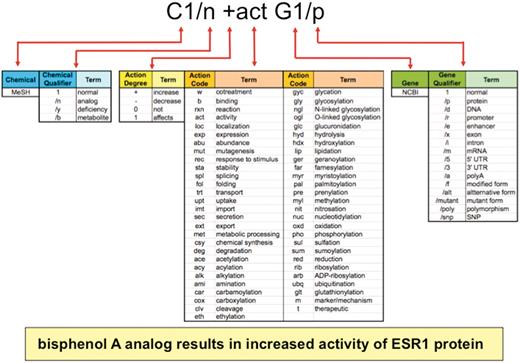
Anatomy of an interaction. Biocurators curate data in structured notation (top) by conjoining terms from multiple vocabularies (middle), including the chemical branch of MeSH, 4 chemical qualifiers, 4 action term degrees, 55 action terms, NCBI gene symbols and 16 gene qualifiers. Multiplexing these short lists allow exponential combinations. Here, the biocurator additionally chose bisphenol A for C1 and ESR1 for G1 to complete the interaction. The notation is translated and displayed as a sentence on public CTD (yellow box).
The action terms can be modified by four types of degrees, symbolically represented as + (increases), − (decreases), 0 (does not affect) and 1 (affects, used when the direction of an interaction is not clearly described by the authors), to specify the direction, such as ‘decreased expression’ (−exp), ‘increased cleavage’ (+clv) or ‘affects phosphorylation’ (1pho).
Finally, there are four CTD Chemical Qualifiers that allow biocurators to specify different aspects of chemicals (e.g. analogs or metabolites) and 16 CTD Gene Qualifiers to specify different aspects of genes (e.g. mRNA, protein, promoter, etc.) involved in an interaction (Figure 2).
This curation paradigm is powerful because it multiplexes short lists of vocabularies (55 action terms × 4 action degrees × 4 chemical qualifiers × 16 gene qualifiers) to generate an unlimited number of combinations, since interactions can be compiled via conjoining multiple action terms in a single statement (e.g. C1 +fol +sta +act G1/p) or expanded using the ‘rxn’ code (see below and Figure 2). Currently, CTD uses over 4400 different types of statements for chemical–gene, chemical–disease and gene–disease interactions. Importantly, the paradigm is also easily expandable and flexible; if new codes or concepts are necessary for novel data not yet covered by the current vocabulary, they can be easily generated, defined, and integrated into the paradigm.
When identifying appropriate action codes and qualifiers to use, a biocurator's prime directive is to generate interactions that sufficiently and satisfactorily reflect both the authors’ data and main conclusions derived from the data; the biocurator does not judge the quality or validity of the data, as that is the domain of the authors, journal editors, and journal referees. When given identical sets of literature to curate, CTD biocurators consistently score high levels of consensus, precision and recall (10). Furthermore, a research group that used CTD data asked experts to evaluate the accuracy of CTD curation; this panel contacted the authors of papers curated by CTD and concluded ‘the data were exactly presented as in the reference’ (18).
Structured notation
To help expedite manual curation, interactions are recorded using a structured notation that integrates mnemonic codes and symbols. Actors are designated by a single letter (C for chemical, G for gene, D for disease) plus a numeral to discriminate between multiple chemicals or genes in a single interaction. The notation is structured as a grammatical sentence with a subject (C or G), object (C, G or D), and at least one action code connecting them (Figure 3A). The interactions can be infinitely expanded by the use of brackets and a reaction modifier (rxn) to allow biocurators to capture highly complex, detailed events and interrelationships. For example, a paper that reports how exposure to bacterial lipopolysaccharides increases the secretion of tumor necrosis factor is coded as: C1 +sec G1/p. If this induced secretion is also inhibited by a second chemical (curcumin), then the original statement can be expanded and include a reaction modifier: C2 −rxn [C1 +sec G1/p] (Figure 3B). Disease data are similarly curated, describing how chemicals or genes can act as either biomarkers/molecular mechanisms or known/putative therapeutics (Figure 3C).
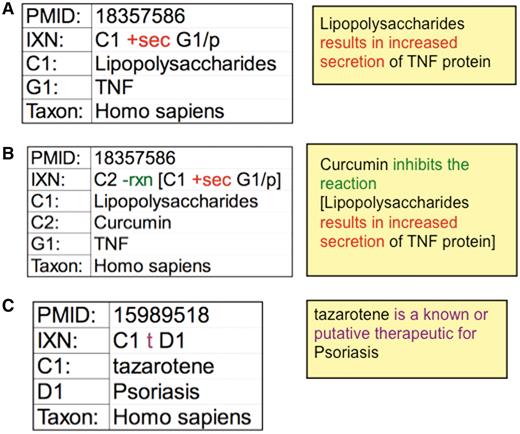
CTD curation codes. (A) Biocurators use controlled vocabularies and mnemonic codes to construct interactions describing the molecular interaction (increased secretion) between the chemical lipopolysaccharides (C1) and the protein product of the tumor necrosis factor gene (G1/p). (B) The interaction can be expanded using brackets and the reaction code (rxn) to indicate how another chemical inhibits the first interaction. (C) Disease curation captures the relationship between chemicals/genes and a disease. Every interaction is directly associated to a PMID and includes the species in which the interaction was studied. The interactions are translated into sentences (yellow boxes) for users to interpret more easily.
While biocurators use the disciplined structured notation and controlled vocabularies to manually curate data, the interactions themselves are translated and displayed on CTD's public web application as color-coded, full-text sentences for users to interpret more easily. These interactions and corresponding data fields are fully downloadable in multiple formats to facilitate further analysis.
Curation tool
Biocurator interface
Originally, curated data were captured in Excel spreadsheets that were then edited, subjected to QC review, loaded into CTD and made public on a monthly basis (10). However, as both the biocuration team and the amount of curated data increased substantially in size, it was necessary to develop an application that would expedite the curation process, centralize all core curation activities, eliminate the bottleneck of spreadsheet integration and enhance the efficiency of editing and QC review.
Interactions are now recorded directly into an online curation tool. Biocurators first enter the PMID of the article to be curated (Figure 4, Step 1). This creates a ‘PubMed Curation Activity’ page for the PMID with a direct link-out to the PubMed abstract (Figure 4, Step 2). Three buttons allow a biocurator to open up an ‘Interaction Entry Page’ (Figure 4, Step 3) to either generate a new interaction (‘New’), edit a previous interaction (‘Edit’) or duplicate a current interaction (‘Clone’); the latter feature is extremely useful in that it allows biocurators to easily replicate an existing interaction and then slightly modify one or more data fields, or build on an existing interaction, instead of having to re-enter all of the same information for each interaction. Finally, biocurators also capture the email address of the corresponding author (Figure 4, Step 4), which allows authors to be notified when their data are presented on the public website. This simple step raises awareness of CTD to potential new users, and provides a mechanism for feedback from authors regarding the quality of the curation of their data.
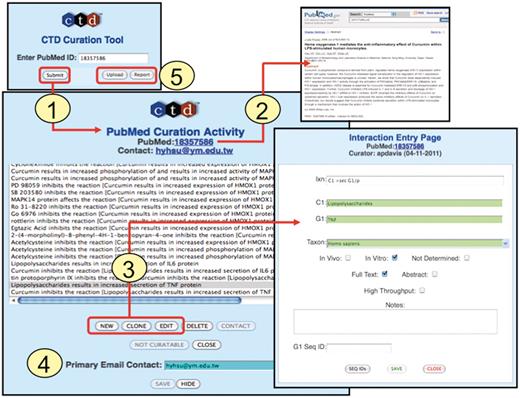
Curation tool overview. (1) Biocurators submit a PMID to create a ‘PubMed Curation Activity’ page. (2) This page has a hyperlink to the PubMed abstract, which the biocurators use for curation. (3) Based upon the abstract, biocurators can then enter new interactions, edit pre-existing interactions, or clone interactions (to modify any data field to generate a new interaction without having to re-enter all the fields each time). On the ‘Interaction Entry Page’ biocurators construct the interaction using structured notation and mnemonic codes and fill in the necessary data fields. Additional internal data not yet currently displayed on the public website can also be selected, including: in vivo versus in vitro methods, full-text versus abstract curation (to help with subsequent text-mining evaluations), if the curation was derived from a high-throughput assay, any type of gene accession ID and curator notes (for any other helpful comment about the curation). (4) When available, the email address of the corresponding author is stored. (5) Additional features allow the biocurator to upload data en masse from an Excel spreadsheet or generate a report of their previously submitted work.
The curation tool interface has additional features for the convenience of the biocurator (Figure 4, Step 5). The ‘Upload’ button allows the biocurator to upload an Excel spreadsheet of interactions, instead of manually entering them into the tool one at a time. This feature is especially useful and time saving when curating extensive tables of microarray data from an article. The biocurator typically first copies and pastes the key features of the table (usually gene symbols and gene accession IDs) into an Excel spreadsheet, then adds the necessary data fields (e.g. coded interactions, species, high-throughput, etc.) into other columns in the spreadsheet, and uploads en masse all the interactions to the curation tool. The ‘Report’ button allows biocurators to retrieve all of their previously submitted curation to review and edit, if necessary. A ‘Not Curatable’ button allows biocurators to flag a PMID as not containing any relevant data to CTD. Given the high volume of papers curated by CTD, the tracking of such rejected PMIDs, along with curated PMIDs, is essential to ensure that newly triaged papers are filtered and removed from the corpus of articles if they have already been examined.
For a new interaction, the curation tool provides the biocurator with an ‘Ixn’ field in which the coded interaction can be entered (Figure 5). After the biocurator composes the interaction and tabs out of the cell, the curation tool automatically displays the necessary data fields required to correctly complete the curation.
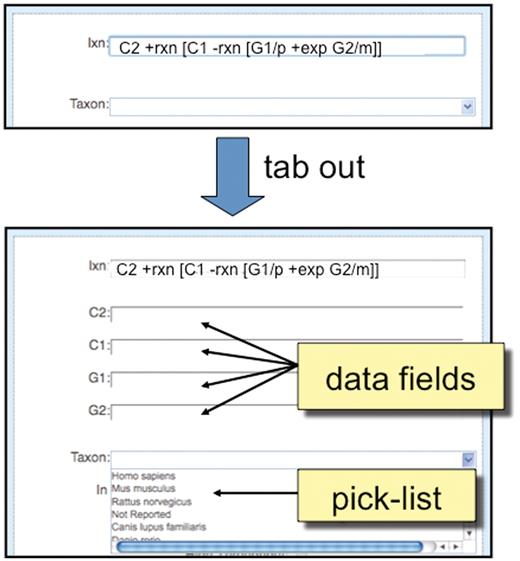
Detailed view of ‘Interaction Entry Page’. After a biocurator composes a new interaction and tabs out of the cell, the curation tool automatically pops up the required data fields (here, C2, C1, G1 and G2) to correctly complete the interaction. Since ‘Taxon’ is a requirement of all interactions, it is always displayed in the curation tool window, and biocurators can either use a pick-list to select the most commonly entered species or directly type in any species.
QC measures
The curation tool is designed with several visual QC features to help prevent errors. Color cues (loosely based on a traffic light paradigm) are used to help visually alert the biocurator to a particular type of error and therefore facilitate the curation process. For example, if the interaction field contains a spelling error or the notation does not match any official term, the field turns red, indicating ‘STOP’ and includes an error message (Figure 6A). As well, chemical, gene, disease and organism terms entered by a biocurator are compared against the corresponding controlled vocabularies in real time and the tool alerts the biocurator if there is a discrepancy among the terms (Figure 6B). Red indicates that the entered term does not match any official term or synonym in the respective controlled vocabulary, and that the biocurator must stop and enter a new term. Green indicates that the entered term matches only one official term, and is therefore acceptable to continue (‘GO’). Yellow cautions that the entered term does not match any official term, but does match a synonym that resolves to only one official term; the tool also automatically replaces the entered synonym with the official term but still signals the biocurator to proceed with caution. Finally, purple alerts that the entered term matches a synonym that cannot be resolved to a single official term; since the curation tool cannot resolve which official term was intended, the biocurator must resolve it and re-enter a new term to continue. Although this traffic light paradigm facilitates the curation process, it is not essential that CTD biocurators be able to recognize color; the ability to ‘Save’ interactions is not enabled until all of the controlled vocabulary terms have been validated.
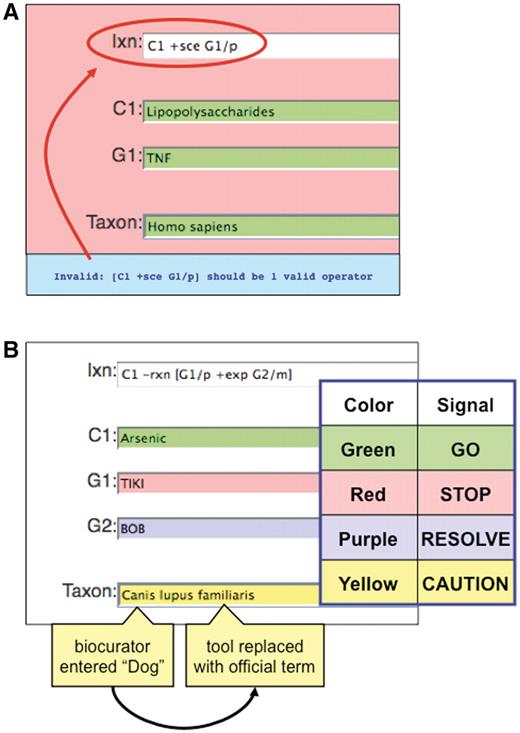
Color-coded QC. (A) If an invalid curation code (here, ‘sce’) is entered in the interaction field (Ixn), the tool automatically alerts the biocurator by coloring the window red (‘STOP’) and producing an error report at the bottom of the page (red circle). The interaction cannot be saved until the biocurator fixes the error. Notice that the terms for C1, G1 and Taxon are correctly entered and the fields remain green. (B) Terms entered by a biocurator for chemicals (C1), genes (G1, G2), diseases (data not shown) and Taxon are automatically compared against CTD’s controlled vocabularies and are color-coded according to their correspondence. Here, the C1 term Arsenic is an acceptable official term and is highlighted in green. The G1 term TIKI, however, does not match any official gene symbol or synonym in CTD, so the curation tool alerts the biocurator in red. The G2 term BOB does not match any official gene symbol in CTD, but is a synonym for more than one gene; since the tool cannot deduce which was the intended official symbol, the term is flagged as purple for the biocurator to resolve. In Taxon, however, the biocurator originally entered ‘Dog’ and the curation tool was able to resolve it as a synonym to just one official term; the tool automatically replaces ‘Dog’ with that term (Canis lupus familiaris) but still cautions the biocurator to double-check the automatic selection made by the curation tool.
Software design and engineering
As a result of the success of the CTD notation and the associated spreadsheet-based curation process, it was extremely important that the tool's software be engineered to closely match the curation workflow, building upon the success of the notation while minimizing the disruption caused by the move from spreadsheets. In addition, the curation tool was designed to resolve inefficiencies of spreadsheet-based curation, including the obvious lack of centralization, the inefficiency inherent in coupling an extremely flexible notation with a fixed column spreadsheet, and the lack of immediate interactive QC for the biocurator. It was also important to meet the needs of a very geographically dispersed team of CTD biocurators, potentially international in scope, with a high degree of individual software and hardware configuration variability. Due to these factors, as well as the technical requirements associated with the tool itself, a web-based solution that integrated the curation notation intact was chosen for the curation tool.
The tool's ‘Interaction Entry Page’ dynamically tailors and displays the actor fields for each chemical (C1), gene (G1) and disease (D1) specific to the interaction notation entry (Figure 5), which is more efficient for the biocurator than having to tab through fixed spreadsheet fields to get to a particular column. The QC process is immediate, and all errors associated with the interaction are displayed on a real-time basis without the biocurator having to leave the screen. In fact, many core QC edits are completed before the onscreen ‘Save’ button is ever enabled.
Another key component of software design is the use of passive messaging where possible. Biocurators were concerned about having to mouse-click through endless QC-related error messages or informational message boxes. Instead, we implemented a passive messaging-based traffic light paradigm for term validation. Other passive visual cues are included throughout the application. Active messaging (i.e. requiring the biocurator to mouse-click) is reserved for only serious operations, such as confirming the deletion of previously entered data. The vast majority of the curation tool's messaging is asynchronous in nature, i.e. passive onscreen messages or visual cues.
In terms of QC, as indicated above, basic edits, such as term validation, occur as the biocurator is curating; however, many of the more complex edits occur after the biocurator has pressed the ‘Save’ button. For example, if the biocurator entered the (erroneous) notation C1 +sce G1/p and then pressed ‘Save’, a more complex QC test would be performed on the server-side of the tool's software indicating that +sce was an invalid operator (Figure 6A). Even in these cases, an error message will appear without the biocurator ever having to leave the screen or the screen being refreshed; here, the screen background turns red (‘STOP’) and the error message is displayed at the bottom (Figure 6A).
The reason this type of messaging paradigm is possible is because of the extensive use of powerful J2EE (Java 2 Enterprise Edition)-based technologies; these technologies enable software developers to make simple, highly efficient asynchronous remote procedure calls between the client and the server. The curation tool employs MVC (Model-View-Controller) architecture, using primarily JSP (Java Server Pages), Javascript, servlets and AJAX (Asynchronous JavaScript and XML), in conjunction with Tomcat, and a PostgreSQL database management system. Security is managed using the Spring framework in conjunction with Apache and LDAP (Lightweight Directory Access Protocol).
As indicated above, some biocurators prefer to continue to use spreadsheets at times, typically to enter microarray data or as a result of the unusual nature of an individual PubMed article. In these cases, the spreadsheets are submitted using an ‘Upload’ feature (Figure 4, step 5) and errors are returned to the biocurator on a real-time basis via a summary report. The biocurator may then correct any errors and resubmit the entire spreadsheet recursively until all the errors are cleared.
Database engineering and architecture
Database overview
CTD used to be powered using Oracle 10 database management system until late 2010, when we migrated all of our databases to PostgreSQL 9. PostgreSQL has outperformed Oracle in virtually every metric we measured, with no loss of significant functionality, and the migration was much more seamless than we anticipated. CTD is logically comprised of three major databases (Figure 7), including: (i) a 3rd Party Database, which contains transient data extracted from third parties (e.g. controlled disease vocabularies from MeSH and OMIM, etc.); (ii) the Curation Database, which contains novel, persistent manually curated interaction and associated data; and (iii) the Public Web Application (PWA) Database, which integrates data from the Curation Database and the 3rd Party Database, and is the sole source of data for the CTD public web application.
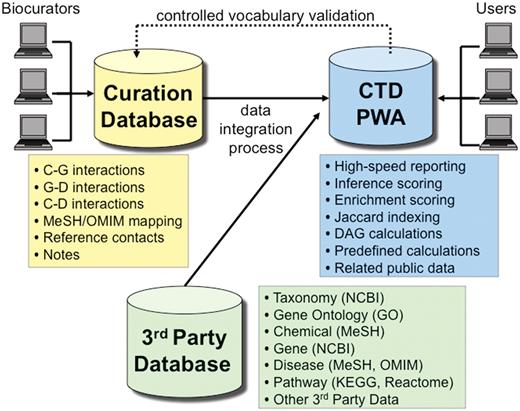
CTD/PostgreSQL logical database architecture. CTD is logically comprised of three major databases: Curation Database (yellow), 3rd Party Database (green) and Public Web Application (PWA) Database (blue). Biocurators, via the web, submit manually curated interactions and information that end up in the Curation Database. The 3rd Party Database contains data extracted from external sources (e.g., NCBI, GO, MeSH, OMIM, etc.). The PWA Database is loaded on a monthly basis and represents an integration of the Curation Database and the 3rd Party Database and is designed as a high-speed reporting database with selective denormalizations and data rollups. The PWA Database also contains novel, associative data (e.g. calculations for inference scores, enrichment scores, and Jaccard indexing, etc.). Users access CTD via the PWA.
The CTD data model is normalized to reduce data redundancy and enhance data integrity (19); data structures are generalized where appropriate to store related data classes in common structures. Each database was individually designed with its particular purpose in mind. The Curation Database and the 3rd Party Databases are fully normalized, transactional databases; the PWA is designed as a high-speed reporting database with selective denormalizations and data rollups to support the functionality and performance requirements of an online application.
There is no persistent data contained in the 3rd Party Database; each month it is completely purged of existing data and is reloaded by a suite of processes with the latest available data extracted from external parties. The purging of existing data is necessary for both simplicity and performance. The dynamic nature of the third party data and the pure volume of the data make it infeasible to use online updates of existing data for processing. Rather, it is enormously more efficient and less complicated to utilize high-speed bulk processing tools to completely reload the third party data each month.
The primary source of the Curation Database is information entered using the curation tool; all of CTD’s persistent curation-related activities are tracked in the Curation Database. The data contained here are continuously updated by CTD biocurators, but the curation itself is not immediately made public. On a monthly basis, the PWA Database (the source of all CTD public data) is completely purged, reloaded with the latest available data, undergoes QC and is made available to the public. The PWA Database represents a comprehensive integration of third party and curation data, and like the Curation Database, also contains novel data. All indirect inference calculations as well as their network topology-based scores, CTD analytic scoring (e.g. the Jaccard-based indexing for ‘GeneComps’ and ‘ChemComps’), and GO/Pathway statistical enrichment calculations for chemicals are contained exclusively in the PWA Database (6; King et al., manuscript submitted for publication).
Curated interaction storage
When a biocurator enters such a complex interaction, it is broken down by the curation tool's server-side software into multiple individual interactions, with appropriate parent–child relationships, and stored in an interaction table. The curated terms are tracked in a separate table, as are the term form types (e.g. G2/p is a gene with a term form type of ‘protein’) and the actions and associated action degree types (e.g. +act). There are four major interaction-related tables in all.
Once the interaction is saved to the curation tool, a full-text prose version is displayed for the biocurator; for the interactions example above, it would be shown as: ‘rimonabant inhibits the reaction [[zinc binds to and results in increased activity of CNR1 protein] inhibits the reaction [IFNG protein affects the reaction [Lipopolysaccharides results in increased abundance of Nitric Oxide]]]’
Although the full-text prose version is displayed for the biocurator, it is not actually stored in the Curation Database; rather, it is generated using a set of stored procedures solely for purposes of interaction confirmation by the biocurator. Similarly, if the biocurator were to edit that particular interaction, the interaction notation would be displayed for the biocurator as above; however, the notation is not stored in the Curation Database, but rather is generated by the curation tool server-side software based upon the entries in the interaction-related tables.
Whenever a biocurator enters a term, it is validated against the version of the PWA database currently available to the public (Figure 7), since the PWA Database is the authoritative database for term validation at any point in time. To minimize database traffic and to optimize validation performance (there are close to 2 million terms and synonyms currently stored in CTD), all of the terms and synonyms are stored in cache upon Tomcat start-up. Consequently, real-time validation is extremely fast.
Accession IDs, as well as terms, are stored in the Curation Database for each curated term. Unfortunately, over time, third party accession IDs and associated terms change; sometimes the accession ID simply disappears from the controlled vocabulary, and other times the underlying term associated with the accession ID changes. The curation tool provides a report for biocurators to periodically identify and redress these discrepancies.
The interactions stored in the PWA Database are denormalized for speed; full-text prose version is stored, as are XML and HTML versions of the interactions. The terms for each interaction are associated with one another as Cartesian products in order to provide users with full associative search capability.
Summary
CTD biocurators manually curate chemical–gene–disease interactions from the peer-reviewed scientific literature. To help streamline this process, we developed a simple, yet robust, curation paradigm that multiplexes several third party and novel controlled vocabularies to describe a vast range of possible interactions. These interactions are composed as grammatical sentences using mnemonic codes. This strategy allows biocurators to rapidly capture information from an article into a structured format using notation and controlled vocabularies. To further facilitate this endeavor, we developed an online curation application. The curation tool obviates the previous need for Excel spreadsheets, streamlines curation into a single web-based tool, automatically imposes quality control standards using color-coding visual cues, and allows biocurators to more easily work remotely.
The third party data and the manually curated data are logically stored in independent PostgreSQL 9 databases. On a monthly basis the PWA Database (which represents a comprehensive integration of third party and manually curated data, as well as novel analytic data of its own) is completely purged, reloaded with the latest available data, and then made available to the public via the PWA.
Recently, several databases have published information about their own curation tools. Because of the different objectives of each database, however, it is often difficult to compare the applications directly. One common theme is the integration of automatic processing of information (often using controlled vocabularies) that then requires manual oversight and approval by a biocurator, whether it be for gene nomenclature based on orthologs (20) or gene structure based on sequence comparison (21). Another active challenge is the incorporation of text-mining systems into the curation pipeline (22). Previously, we described both our own text-mining system and our biocuration baseline metrics for manual curation, previous to the implementation of the new curation tool described here (10). In subsequent studies, it will be of interest to (i) measure and compare the new curation metrics (using this tool) against our previous baseline metrics, and (ii) to find ways to integrate our text-mining process and paper ranking system into our curation tool to further increase productivity and efficiency.
Finally, the curation paradigm and web-based tool described here are easily expandable, allowing CTD to accommodate the curation of additional data types and new biological ontologies and concepts, such as anatomy, cell ontology, phenotypes and exposure science.
Citing and linking to CTD
To cite CTD, please see: http://ctd.mdibl.org/about/publications/#citing. Currently, over 25 external databases link to or present CTD data on their own websites. If you are interested in establishing links to CTD data, please notify us (http://ctd.mdibl.org/help/contact.go) or follow these instructions at http://ctd.mdibl.org/help/linking.jsp.
Funding
National Institute of Environmental Health Sciences (NIEHS; R01ES014065); National Library of Medicine (NLM); NIEHS (R01ES014065-04S1); National Center for Research Resources (NCRR; P20RR016463).
Conflict of interest. The content is solely the responsibility of the authors and does not necessarily represent the official views of the National Institutes of Health.
Acknowledgements
We thank Michael Rosenstein and Ben King for continual CTD maintenance, refinement and improvement. We are also indebted to our dedicated team of professional biocurators, Drs Cynthia Saraceni-Richards, Susan Mockus, Robin Johnson, Heather Keating, Jean Lay, Kelley Lennon-Hopkins and Daniela Sciaky.
