


Abstract
The Rat Genome Database (RGD) is the premier repository of rat genomic and genetic data and currently houses >40 000 rat gene records as well as human and mouse orthologs, >2000 rat and 1900 human quantitative trait loci (QTLs) records and >2900 rat strain records. Biological information curated for these data objects includes disease associations, phenotypes, pathways, molecular functions, biological processes and cellular components. Recently, a project was initiated at RGD to incorporate quantitative phenotype data for rat strains, in addition to the currently existing qualitative phenotype data for rat strains, QTLs and genes. A specialized curation tool was designed to generate manual annotations with up to six different ontologies/vocabularies used simultaneously to describe a single experimental value from the literature. Concurrently, three of those ontologies needed extensive addition of new terms to move the curation forward. The curation interface development, as well as ontology development, was an ongoing process during the early stages of the PhenoMiner curation project.
Database URL:http://rgd.mcw.edu
Introduction
Rat models have been used for many decades to study physiological and pathological processes. Many rat strains have originated in physiology laboratories that have selectively bred animals for traits related to specific biomedical interests (1, 2). Rattus norvegicus is well characterized in the areas of cardiovascular and pulmonary studies, pharmacology, immunology, toxicology, nutrition, behavior and aging, as well as cancer and organ transplantation. In recent years, some large-scale physiological projects have made phenotypic data sets from many rat strains freely available online. Those projects include the PhysGen Program for Genomic Applications (PGA) (3) (http://pga.mcw.edu) and the National BioResource Program in Japan (NBRP) (4) (http://www.anim.med.kyoto-u.ac.jp/nbr/). The PGA was designed to produce high-throughput phenotype data for a targeted set of inbred, consomic and mutant strains under a variety of environmental conditions. NBRP has generated a large phenotype data set for inbred and mutant strains under baseline conditions. The Rat Genome Database (RGD) PhenoMiner project endeavors to present, extend and expand the quantitative phenotypic data presented by those two large-scale projects.
For many years, RGD has curated and displayed qualitative phenotype data for strains, quantitative trait loci (QTLs) and genes. Qualitative phenotypes have been described with the Mammalian Phenotype (MP) ontology (5), which, for the most part, consists of terms describing abnormal phenotypes. The curation of quantitative phenotype data is meant to give a finer-grained view of phenotypes to make comparison between strains more accurate. Instead of comparing two rat strains knowing that each have ‘decreased systemic arterial systolic blood pressure’ as annotated with MP, quantitative annotations allow the database user to know how much lower the ‘mean arterial blood pressure’ is in one strain compared with a different strain or to the same strain under different conditions. In addition, the PhenoMiner annotations provide additional data such as animal number, animal age, the measurement method used to collect the data and more. The quantitative phenotype annotations greatly increase the depth of the phenotype data available to the database user.
To curate and display quantitative data, a number of different elements needed to be brought together. First, user-side software development was required so the data could be presented in an efficient user-interactive manner. Second, to test that type of interface and to present a sizable initial base of data, PGA (>30 000 records) and NBRP data (>3 000 records) were imported, formatted and made available through the PhenoMiner user-side interface (2, 6). The PhenoMiner data are accessed through RGD’s phenotypes and models portal (http://rgd.mcw.edu/phenotypes/). Users select a combination of strain, clinical measurement, measurement method and/or experimental condition to find data of interest (6). This idea of using a combination of terms to extract specific phenotypic data sets from the database is the basis for the name PhenoMiner. The third element necessary for RGD’s quantitative phenotype data curation was a tool for curators to annotate phenotype data from the biomedical literature. To be able to present data that is comparable between studies and protocols, standardized language (ontologies or structured vocabularies) needed to be used in the annotations. Standardized ontologies/vocabularies also allow comparison of data between different species. That could be particularly useful in translational research, which relies on comparison of data between laboratory animals and humans. Although quantitative data could vary widely between species for any particular phenotype, the ontology/vocabulary terms and relative quantitative changes among different conditions would allow comparisons between species to be made.
Multiple ontologies/vocabularies are used to populate five required fields and an additional optional field. During initial literature curation for PhenoMiner, vigorous ontology development was required for three of the ontologies (Clinical Measurement Ontology, CMO; Measurement Method Ontology, MMO and Experimental Condition Ontology, XCO) because the PhenoMiner project was initiated simultaneously with the original development of these three ontologies (7). The three ontologies were developed to address gaps that were not being filled adequately by existing publicly available ontologies. The CMO was developed partly as an offshoot of the development of the Vertebrate Trait Ontology (VT) from the Animal Trait Ontology (http://www.animalgenome.org/bioinfo/projects/ato/) (8). The existing phenotype ontologies (like MP or the Human Phenotype Ontology) were not developed for use with numerical measurement values and are not suitable for quantitative annotation. Attachment of numerical values to the CMO has been the key purpose of developing and using the CMO. The Ontology for Biomedical Investigations (http://obi-ontology.org/page/Main_Page) has partial overlap of terminology with the MMO and XCO, but it was decided that new ontologies created in-house and specifically for methods and conditions of quantitative phenotype data would be the most efficient way to proceed.
Beyond the bulk loading of large data sets and the initial manual curation initiative, manual literature curation will continue, as well as the uploading of phenotype data directly to RGD by rat researchers who wish to make their data publicly available (http://rgd.mcw.edu/wg/home/phenominer-data-upload). In the future, PhenoMiner curation will be done concurrently with QTL curation to more efficiently gather data from the same journal article. Also, non-QTL rat physiology data will be curated from the literature in targeted sets, based on the phenotype category of the research.
PhenoMiner curation tool
To begin the process of literature curation of quantitative phenotype data, the appropriate literature was assembled. Instead of searching PubMed for rat phenotypic literature as a starting point for manual PhenoMiner curation, the RGD team of curators began with articles previously curated for rat QTLs. Many QTL articles report phenotypic data for parent strains and congenic strains used in the determination of the QTLs. Therefore, a significant time savings was made by having a preselected literature to be curated. That was extremely helpful because PhenoMiner curation is a time-consuming process, even without a literature search. The initial PhenoMiner literature was sorted according to phenotype. Blood pressure articles were curated first, followed by cancer, diabetes, renal function and inflammatory processes.
The five required categories of curated information in a PhenoMiner annotation are experiment name, rat strain, clinical measurement, measurement method and experimental condition. Each of those is represented by a specific ontology or vocabulary, as shown in Table 1. In the case of experiment name, one of two ontologies/vocabularies is used for a single annotation. The VT (a collaboration among RGD, Mouse Genome Informatics (MGI) (10) and Animal QTL database (QTLdb) (8)) is used for physiological phenotype data, and the RGD/Comparative Toxicogenomics Database (CTD) disease vocabulary (RDO) is used for pathological phenotype data. The RDO disease vocabulary consists of MEDIC (11) plus additional terms and relationships added at RGD. It was necessary to add a disease vocabulary for a subset of experiment names because the VT does not cover pathology and many experiments could not be described appropriately without disease terms. The rat strain ‘ontology’ (RS) provides the official nomenclature for every rat strain annotated. The CMO provides terms to describe what is being experimentally measured. The numerical value assigned to the CMO term is the ‘quantity’ in the quantitative phenotype annotation. The MMO provides the information of how the ‘quantity’ was measured. Finally, XCO provides the term or terms to describe the condition or conditions under which the experiment was run. The XCO term may also have a numerical descriptor for quantity and/or duration of the experimental condition.
Required ontologies/vocabularies for PhenoMiner annotations, URLs for available download sites for those ontologies/vocabularies and relevant literature references
| Curation category | Ontology/ vocabulary | OBO file downloads | References |
|---|---|---|---|
| Experiment name—physiological | VT | ftp://rgd.mcw.edu/pub/ontology/vertebrate_trait/http://purl.bioontology.org/ontology/VT | |
| Experiment name—pathological | RDO | ftp://rgd.mcw.edu/pub/ontology/disease/ | (8) |
| Rat strain | RS | ftp://rgd.mcw.edu/pub/ontology/rat_strain/http://purl.bioontology.org/ontology/RS | |
| Clinical measurement | CMO | ftp://rgd.mcw.edu/pub/ontology/clinical_measurement/http://purl.bioontology.org/ontology/CMO | (5) |
| Measurement method | MMO | ftp://rgd.mcw.edu/pub/ontology/measurement_method/http://purl.bioontology.org/ontology/MMO | (5) |
| Experimental condition | XCO | ftp://rgd.mcw.edu/pub/ontology/experimental_condition/http://purl.bioontology.org/ontology/XCO | (5) |
All ontologies listed here can be browsed in RGD’s ontology browser (http://rgd.mcw.edu/rgdweb/ontology/search.html) (9).
To begin annotating a study in PhenoMiner (Figure 1A), the curator must access the reference identification number (ID) in the curation tool. The tool provides the option of importing a reference by entering a PubMed ID or an RGD ID, similar to the general RGD curation tool (12). If a curator enters a PubMed ID, the tool will download the corresponding abstract from PubMed, assign an RGD ID to that abstract, load the citation into the PhenoMiner curation tool and create a study ID (SID) for that reference. If an RGD ID is entered or the abstract from the entered PubMed ID is already in RGD, the curation tool will load the citation and create a SID for that reference. In the context of manual PhenoMiner curation, a ‘study’ refers to a single published article. During the initial phase of manual PhenoMiner literature curation, only pre-existing RGD IDs were needed because all of the references had previously been imported from PubMed for QTL curation. Once the reference is selected, the next step (Figure 2A) is to choose ‘Add Experiment’ for that study. The curator must select a VT term or an RDO term, which matches the experiment being described. This is done on the ‘Create Experiment’ page (Figure 2B), which features an autocomplete text box for entering an ontology/vocabulary term ID or term. The branch icon to the right side of the term ID selection text box links to the ontology browser (9) in a separate window, providing extra help in finding the most appropriate experiment name. Multiple experiment names may be entered in succession to generate multiple experiments associated with one study. For every experiment entered, a unique experiment ID (EID) is generated to track the data for both curators and end users.
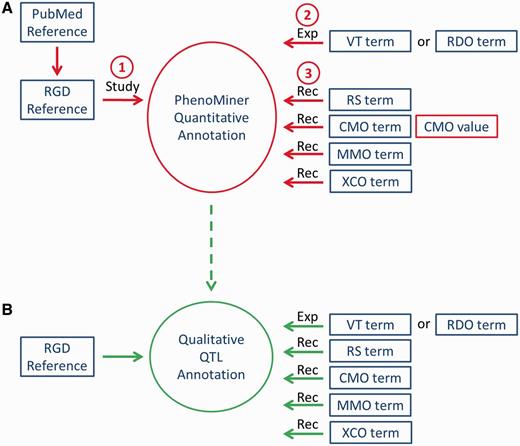
Workflow of PhenoMiner curation. (A) The quantitative PhenoMiner curation workflow showing the sequence that establishes first, the ‘Study’, second, the experiment name (Exp) and third, all the details of the annotation ‘Record’ (Rec). (B) Workflow for the new PhenoMiner-style qualitative annotation of QTLs. This workflow uses the same ontologies as the PhenoMiner curation, but uses the general curation tool because no numerical values are entered.
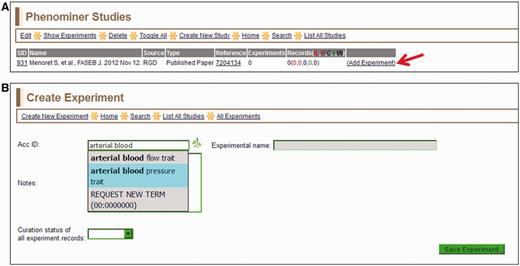
(A) Selected study page—this page displays the citation, a reference link and other information about the study. Clicking the ‘Add Experiment’ link (red arrow) returns the ‘Create Experiment’ page. (B) Create Experiment page—this page features an autocompleting text box for entering term IDs for either vertebrate trait terms (VT) or disease terms (RDO). The text box will accept a VT or RDO ID or any key word(s) found in VT or RDO terms. If a suggested term is selected, the ID is automatically entered in the selection text box and the term itself will be automatically entered in the accompanying ‘Experimental name’ box.
To proceed to the record (full annotation) creation, the curator selects the ‘All Experiments’ link in the menu bar. All experiments for the study being curated are listed on the ‘View Experiments’ page (Figure 3). To access the data entry page for records (‘Create Record’ page), the curator clicks the ‘Add Record’ link (red arrow in Figure 3) at the right end of the appropriate experiment line.
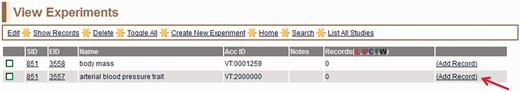
View Experiments page—this page lists all experiments for the particular study being curated, in this case ‘body mass’ (EID 3558) and ‘arterial blood pressure trait’ (EID 3557) for SID:851 (listed on left side of page).
The ‘Create Record’ page (Figure 4) is where the rest of the data for a single record is entered. It consists of a series of autocomplete text boxes, drop-down text boxes and editable plain text boxes. All of the data entered are associated with terms from five ontologies/vocabularies: RS, CMO, MMO, XCO and the optional MA (Mouse Adult Gross Anatomy Dictionary) (13). The entry boxes for the ontologies/vocabularies are autocomplete text boxes, just like the one for experiment name entry (Figure 2). Each entry box also has a branch icon to its right side, for easy access to the ontology browser. Four required fields are associated with the rat strain (Figure 4A): ‘animal count’, ‘min age’ (in days), ‘max age’ (in days) and ‘sex’. The first three fields are plain alphanumeric text boxes that take either a number or ‘N/A’ if the number is not included in the data from the reference. The ‘sex’ field is a drop-down box with choices of ‘both’, ‘male’, ‘female’ or ‘unspecified’.
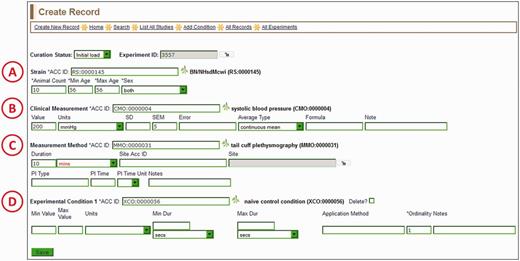
Create Record Page—most of the information for a manual PhenoMiner annotation is entered here. Four ontology/vocabulary terms are required and many more optional fields allow the addition of basic experimental information. In this example, the rat strain (A) is BN/NHsdMcwi, the CMO term (B) is ‘systolic blood pressure’, the MMO term (C) is ‘tail cuff plethysmography’ and the XCO term (D) is ‘naïve control condition’. The optional MA term goes in the ‘Site ACC ID’ text box in the measurement method section (C).
The main information to be entered in the clinical measurement section (Figure 4B) is the ‘Value’, ‘Units’ and ‘SD’, ‘SEM’ or ‘Error’. The ‘Value’ is a single measurement average generated for one rat strain by the reported experiment in the literature, accompanied by the appropriate units and error. The units are in a drop-down list, which is updated on an ongoing basis with units found in the literature by the RGD curators. A flat list for units was used for a couple of reasons. First, many units found in the physiological literature are not found in available unit ontologies (i.e. the Units Ontology or the Units of Measurement Ontology) (http://bioportal.bioontology.org/). Second, many ‘units’ involve ratios of units, which are more easily used as pre-constructed terms in a drop-down list rather than being constructed by multiple entries in the curation software interface. Additional fields for clinical measurement include ‘Average Type’ (for anything other than a simple mean), ‘Formula’ (to support a calculated measurement value) and ‘Note’ (for any information the curator may want to add for enhancement of the annotation).
The measurement method section (Figure 4C) is for entering information about the procedures used to make the clinical measurement. ‘Duration’ is a field for the elapsed time of the measurement. ‘Site Acc ID’ is an optional ontology/vocabulary field, which accepts mouse adult anatomy terms (MA) to indicate the anatomical site of the measurement. ‘PI Type’ is the type of insult (if present) used during the experiment to provoke a change in the measurement (for example, an injection of a drug given to the subject to affect blood pressure measurement). ‘PI Time’ is the post-insult time, meaning the latency period between insult and measurement.
The experimental condition section (Figure 4D) is the only section that accepts multiple entries. The ‘Add Condition’ link on the menu bar at the top of the ‘Create Record’ page allows a curator to add as many experimental conditions as necessary. Because editing may warrant removing an experimental condition, a ‘Delete?’ checkbox is located to the right of the saved experimental condition term. The experimental condition section also includes ‘Min Value’, ‘Max Value’, ‘Min Dur’ and ‘Max Dur’ fields. The ‘Value’ fields are used to describe concentrations of drug, diet supplements or other numerically definable experimental condition. The ‘Dur’ fields are used to indicate the duration of a condition, if applicable. ‘Application Method’ is a free text field to label the condition as injection, gavage or other process. The ‘Ordinality’ is a required field for the experimental condition, and it indicates the sequence of conditions, in case of multiple conditions. Consecutive ‘Ordinality’ numbers indicate sequential conditions and identical ‘Ordinality’ numbers indicate simultaneous conditions.
After entering data to all appropriate fields and clicking the ‘Save’ button, the record is logged as an addition to that particular experiment (EID, second entry from left in Figure 5). All the data fields are presented to the curator on one line so when multiple lines are viewed, it is easy to scan for differences between the lines. With so many different fields to fill, it was important to have a versatile editing function in the curation tool. In the menu bar of any list of studies, experiments or records in PhenoMiner, there is an ‘Edit’ link, which links to a data entry page nearly identical to that used for creation of that study, experiment or record. Any field can be altered on the editing pages. Not only can single records be edited, but multiple records can be edited simultaneously. This is convenient because some phenotyping experiments have many different rat strains as subjects, with all the supporting information being identical. That means that it is easy to change a common incorrect entry for as many records as necessary. Another convenient feature is the ability to duplicate records. If the ‘Create New Record’ link on the menu bar is selected, a blank template is opened. However, if the check box to the left of a record in the ‘View Records’ window is checked, the ‘Create New Record’ feature will duplicate the selected record on the ‘Create Record’ page. Then, a curator may change one or more fields to generate a new record, instead of re-entering all the identical data manually for the new record.

View Records page—a typical annotation viewed in the PhenoMiner curation tool with all data visible on one line.
All of the PhenoMiner studies in RGD can be accessed through the ‘List All Studies’ link on the menu bar at the top of all PhenoMiner curation tool pages. The ‘PhenoMiner Studies’ page (Figure 6) lists all the studies in the PhenoMiner curation tool. The columns can all be sorted by clicking on the column headings. From each line, the ‘Edit Study’ page can be accessed by the hyperlinked SID, the reference abstract can be accessed from the ID in the reference column, the ‘View Experiments’ page for any study can be accessed from the hyperlinked number in the experiments column and the ‘Create Experiment’ page can be accessed from the ‘Add Experiment’ link at the right side of each line.
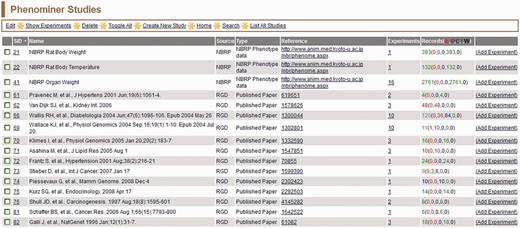
PhenoMiner Studies page—this is a one-page view of all studies in the PhenoMiner curation tool. The columns are all sortable by clicking on the headings. Important to note is the ‘Records’ column, which shows the number of records and status of those records. The status is color-coded—IL (red): initial load; IP (dark red): in progress; C (blue): curated; F (green): final; W (black): withdrawn.
All annotations carry a ‘Curation Status’, which is shown in the ‘Records’ column. The ‘Curation Status’ can be set on any level (study, experiment, record) of the ‘Create’ or ‘Edit’ pages. The Curation Status is set with a drop-down menu, which indicates if the annotation is ‘Initial Load’, ‘In Progress’, ‘Curated’, ‘Final’ or ‘Withdrawn’. ‘Initial Load’ is the default status, so both ‘Initial Load’ and ‘In Progress’ indicate the annotations have not been completed. When curators have completed annotations for a particular study, all those annotations are marked ‘Curated’. Then an editor checks the annotations for consistency and accuracy, before changing the status to ‘Final’. All ‘Final’ annotations are loaded into the user-side interface so the data can be accessed through the public database.
An additional related side project involves annotating QTLs qualitatively with the ontologies/vocabularies used for the quantitative phenotype annotations (Figure 1B). This is done in the general curation tool because it does not need any numerical data and it is displayed on QTL report pages, instead of in the PhenoMiner end-user interface. Because most of the initial articles for PhenoMiner manual curation contain QTLs already annotated in RGD, those QTLs were re-annotated in parallel with the PhenoMiner quantitative curation. This allowed information in the more standardized format of ontologies/vocabularies to be associated with those QTLs, superseding information that was only associated with the QTLs in curator notes. This qualitative annotation component also allowed some quality control involving updates of strain nomenclature assigned to QTLs and updates of disease terms assigned to QTLs. Moving forward, PhenoMiner-style qualitative curation of QTLs will be incorporated into the process of regular QTL curation.
PhenoMiner curation and ontology development
Because three of the ontologies (CMO, MMO and XCO) used in PhenoMiner curation originated simultaneously with the PhenoMiner curation project, ontology development controlled the pace of the curation process. Internally, RGD has implemented an ontology development process similar to the SourceForge (http://sourceforge.net/projects/geneontology/) term request tracker system that the Gene Ontology Consortium (14) has used for years. As curators annotate articles and find data that cannot be described with a current CMO, MMO or XCO term, they send a specific request to a single ontology editor. That editor is a screener who decides the correct wording for the term, the correct place for the term in the ontology and assigns any synonyms and/or definition, if necessary. The requested terms are then reviewed by a second ontology editor who verifies or changes the wording and placement of the terms in the ontology tree. The second editor then enters the new terms into the ontologies via OBO-EDIT software (15), and adds any missing synonyms and/or definitions. For XCO terms that are chemical names, an xref (cross-reference to the same or similar information) to the appropriate ChEBI (Chemical Entities of Biological Interest) (http://www.ebi.ac.uk/chebi/) database entry is included in the ontology term file. Xrefs for other XCO, CMO and MMO terms may be added in the future to map them to other ontologies/vocabularies.
Many new terms were needed as the curators annotated articles in different physiological categories. The majority of the requested terms (>500) have been for the CMO. These terms tend to be more experiment-specific than the MMO terms. The requested XCO terms are also specific, but because multiple clinical measurements in one reference are often made using identical conditions, the CMO term requests also outnumber the XCO requests. In addition to term requests, requests for units to accompany the values recorded for CMO and XCO terms are also handled by the same process as the term requests. The units are maintained as flat lists, which reside in drop-down menus in the clinical measurement and experimental condition sections of the ‘Create Record’ page of the curation tool (Figure 4B and D). Just like the ontology terms, the units are added on a continuing basis. New term and unit requests came in waves as the curators moved through the different categories of phenotypes during the curation of the backlog of QTL literature. Even though a lag in time existed between the term/unit requests and entry of those terms/units into the ontologies/vocabularies/lists, the curators continued to make annotations using placeholder ‘terms’/IDs (‘Request New Term’/***:0000000). When term/unit requests were fulfilled, annotations were revisited and the placeholder terms/units were replaced.
PhenoMiner curation and software development
Early in the course of the PhenoMiner project, adjustments to the curation tool needed to be made to optimize and streamline the data entry. With so many data entry fields and various types of text boxes for those fields, it took much back and forth communication between curators and the software developer to find the best design for data entry and editing. As with other curation tools (12), the software developer continued improving the tool while the curators were using it until it was deemed to be as efficient as possible.
Originally, all of the ontology-term entry boxes were designed as plain-text entry boxes. It was soon apparent that entry errors could be numerous and time-consuming to correct. To address this, the entry boxes were changed to term-ID entry boxes with an autocomplete feature for entered text. Now, only a valid term ID will be accepted in the ontology-term entry boxes, which eliminates typographical errors and invalid IDs. Thus, quality control of ontology term entry is done automatically as the terms are entered.
The use of units for CMO and XCO values experienced another set of problems. Again, the original format included plain-text entry boxes. To standardize curator entries for consistency and to eliminate typographical errors, the plain-text entry boxes were replaced with drop-down lists of units. Because different authors may use different units for the same type of experiments, standard units had to be assigned for each CMO term. This would allow seamless comparisons of data in the PhenoMiner end-user interface. What it meant for the curators was a restriction to units that could be converted to the standard unit. The curation tool automatically checks each unit entry to determine if that unit can be converted to the standard unit. If a unit cannot be converted, the tool returns an error message that requests a different unit.
The editing function was also a feature that developed during the course of the initial curation efforts. At first, only single annotations could be edited. Because single experiments can have many data points that vary only slightly in their annotated descriptions, the curators needed a way to change common data entries in many annotations simultaneously. The developer was able to change the editing software such that bulk edits could be done with multiple annotations simultaneously, thus accelerating the editing process.
Although the PhenoMiner curation tool is in a finished stage, it is likely that future curation will drive more requests for software adjustments.
Technical aspects of the phenominer curation tool, database and user interface
PhenoMiner originally started as a stand-alone project with a goal to visualize the existing rat phenotype data collected in the PGA project. After the data visualization tool was completed, RGD decided to curate rat quantitative phenotype data from the biomedical literature. Because the pre-existing RGD curation tools could not work with the PhenoMiner database schema, development of a separate curation tool was necessary. The new curation tool uses features specifically designed for annotating quantitative experiment data as well as curation steps that differ from other curation tools at RGD.
The database schema of PhenoMiner comprises entities at different levels corresponding to the curation software user interfaces to enter information for ‘Study’ name, ‘Experiment’ name and ‘Experiment Record’. ‘Study’ is the top-level entity. One ‘Study’ is associated with multiple ‘Experiments’, and one ‘Experiment’ is associated with multiple ‘Experiment Records’. Each ‘Experiment Record’ is associated with one ‘Rat Sample’ (rat strain ID), one Clinical Measurement, one Measurement Method and one ‘Experimental Condition Group’. One ‘Experimental Condition Group’ may include multiple experimental conditions. The ‘Measurement Value’ is stored in the ‘Experimental Record’ table. Information of Rat Strain, Clinical Measurement, Measurement Method and Experimental Condition Group are stored in individual database tables. This makes it possible to reuse the information with different ‘Experimental Record’ values. The flow of data from curation tool to user interface is shown in Figure 7. More information about the technical aspects of the PhenoMiner curation tool and end-user display will be described elsewhere (Liu,W., de Pons,J. et al., unpublished data).
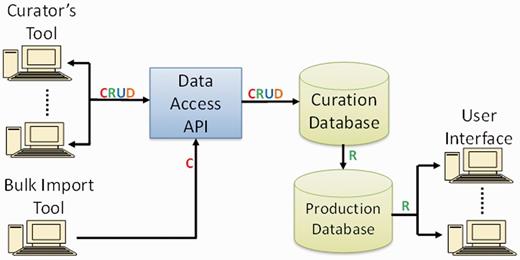
PhenoMiner software components and data flow. Operations in data flow: C = create, R = read, U = update, D = delete (API = application programming interface).
Summary
RGD has recently established a quantitative phenotype curation paradigm that takes advantage of seven different ontologies/vocabularies. Some of those ontologies/vocabularies were built with a focus on the PhenoMiner project, with ongoing ontology development as the curation proceeded. Beyond the PhenoMiner project at RGD, the CMO, MMO and XCO have been used in a human clinical data project (COVER) (http://cover.wustl.edu/Cover/) and the VT and CMO have been used to annotate animal QTLs in the Animal QTLdb (http://www.animalgenome.org/bioinfo/projects/ato/main.html) (8).
In addition to >33 000 bulk loaded PhenoMiner annotations from two large-scale rat physiology projects, >4500 PhenoMiner annotations have been added to the database in the initial manual curation phase of the project. In the animal QTL projects only terms are used, so quantitative animal data comparable with the PhenoMiner data is not currently available. In the case of the human data, access is somewhat restricted by an e-mail request system for data from the COVER project.
Both the bulk-loaded, high-throughput data and manually curated literature data are available in the PhenoMiner end-user interface (http://rgd.mcw.edu/phenotypes/) where studies across many rat strains, methods and conditions can be compared. This allows researchers to easily compare their data with that of other rat researchers. The quantitative phenotype data can also help researchers decide what rat strain would be the best model for a particular disease or phenotype they are studying. Future additions to PhenoMiner data will include user-uploaded data and manual curation of rat non-QTL phenotype data from biomedical literature.
Funding
This work was supported by the National Heart, Lung and Blood Institute on behalf of the National Institutes of Health (HL064541 and HL094271). Funding for open access charge: National Heart, Lung and Blood Institute on behalf of the National Institutes of Health [HL64541].
Conflict of interest. None declared.
