


Abstract
The Maize Genetics and Genomics Database (MaizeGDB) team prepared a survey to identify breeders’ needs for visualizing pedigrees, diversity data and haplotypes in order to prioritize tool development and curation efforts at MaizeGDB. The survey was distributed to the maize research community on behalf of the Maize Genetics Executive Committee in Summer 2015. The survey garnered 48 responses from maize researchers, of which more than half were self-identified as breeders. The survey showed that the maize researchers considered their top priorities for visualization as: (i) displaying single nucleotide polymorphisms in a given region for a given list of lines, (ii) showing haplotypes for a given list of lines and (iii) presenting pedigree relationships visually. The survey also asked which populations would be most useful to display. The following two populations were on top of the list: (i) 3000 publicly available maize inbred lines used in Romay et al. (Comprehensive genotyping of the USA national maize inbred seed bank. Genome Biol, 2013;14:R55) and (ii) maize lines with expired Plant Variety Protection Act (ex-PVP) certificates. Driven by this strong stakeholder input, MaizeGDB staff are currently working in four areas to improve its interface and web-based tools: (i) presenting immediate progenies of currently available stocks at the MaizeGDB Stock pages, (ii) displaying the most recent ex-PVP lines described in the Germplasm Resources Information Network (GRIN) on the MaizeGDB Stock pages, (iii) developing network views of pedigree relationships and (iv) visualizing genotypes from SNP-based diversity datasets. These survey results can help other biological databases to direct their efforts according to user preferences as they serve similar types of data sets for their communities.
Database URL: https://www.maizegdb.org
Introduction
The cost of generating DNA-based biological data types is declining continuously, enabling individual researchers and research groups to generate large amounts of accurate and specific data about their systems of interests (1). After the initial wave of sequencing ‘reference’ genomes, i.e. high-quality nucleotide sequences of representative lines for a given species, the focus is now being shifted to sequencing multiple accessions for each species, and identifying genomic regions showing diversity in the nucleotide sequences (2). Not all nucleotide-level variations are functionally meaningful. Some are only remnants of random mutations that transpired during each species’ evolutionary journey, and do not have any obvious function. Conversely, other variations play a significant biological role in controlling agronomically important traits such as drought or pest resistance. The challenge for many research groups is to sift through collections of diverse regions and identify genotypes that control specific aspects of plant development that are useful to agronomy (3).
As centuries-long genetic research demonstrates, the identification of trait-determining genotypes has not been an easy task (4). This task is now facilitated by the abundance of data generated by more affordable DNA sequencing technologies. However, an increase in data also brings a new set of challenges toward statistical evaluation of genotypes and associated phenotypes. The regions identified by quantitative trait loci (QTL) studies, may span a few million nucleotides, whereas current association studies can zero in to the single nucleotide level, and support hypotheses that a single (rarely) or several defined loci play an important part in determining a specific trait (5). When there is a long list of putative regions and with favorable alleles possibly belonging to multiple germplasm accessions, extracting relevant information is challenging.
Deploying appropriate visualization applications that allow facile interpretation of experimental and computational outcomes may significantly facilitate this discovery process. Depending on specific research questions, visualization of biological data can take a wide range of forms (6). In most cases, multiple visualization methods are required to explore the data from multiple perspectives.
Another challenge for researchers is access to visualization tools. Multiple visualization applications are available as desktop applications for personal computers using popular operating systems, such as Windows or Linux. Some of those applications, especially the ones that can be installed on GUI-based systems (e.g. Windows or Mac OS systems), are easier to use for researchers. That being said, most bioinformatics applications are increasingly being built for Linux systems, and require some knowledge of command-line operations to be installed and used, creating a sometimes insurmountable barrier for researchers to harness the powerful features afforded by these applications. An alternative to desktop applications is applications that are accessible and functional through web browsers, but these applications require specialized skills to build and ongoing funds and personnel to maintain, which may not be available to researchers who work within the framework of short-term funding systems. Fortunately, MaizeGDB has long-term, federally mandated funds to be used for the benefit of maize researchers, and can devote resources to develop web-based tools.
Following its mandate, MaizeGDB (7) prepared a survey and asked the maize researchers what types of datasets should be provided through MaizeGDB and how they want these datasets to be visualized. These types of surveys are extremely important for biological databases, as they provide immediate insights into the needs of their user base, and can guide future tool development (8, 9) and curation (10). In this article, we provide the details of how MaizeGDB prepared a survey to identify the visualization needs of maize researchers with a special emphasis on maize breeders. We also share the outcomes and our interpretation of this survey, hoping that this approach will benefit other model organism databases as well.
Materials and methods
Preparation of the survey
One role of MaizeGDB is to distribute surveys and communication items that are approved by the Maize Genetics Executive Committee (MGEC), the elected body representing the maize research community. The MaizeGDB team created the first draft of the survey questions. We then sought input from local maize researchers in person on the Iowa State University campus, and at the Maize Genetics Conference, which is the most popular conference attended by the international maize research community. Harnessing this direct stakeholder input, we modified the questions, added new ones and changed the order of the questions. We then contacted the MGEC, and, after receiving their feedback, asked their permission to distribute the survey.
Number of respondents
After being approved by the MGEC, we sent the survey to maize “cooperators”. In the maize research community, maize cooperators are broadly defined as either past attendees to the Maize Genetics Conference or any person who submits a request to MaizeGDB to become a maize cooperator. As the maize community’s database, MaizeGDB maintains the list of the maize cooperators, and sends out infrequent communications that have been approved by the MGEC to this list. The list of maize cooperators is otherwise kept private. We sent the survey to 2476 maize cooperators, and received 48 unique responses. At first glance, the number of responses seems low. However, it is worth comparing this number with the number of votes cast during the election of the MGEC members around the same time we conducted our survey. During the elections, the same cooperator list was used, and 327 people voted in the first round of elections and 317 in the second round. Another number to compare is the corn breeder’s cooperator list that was generated in the NCC167 Corn Breeding Research meeting in 2013 where 103 members signed up. Given the specificity of the survey, 48 respondents is a fair representation of maize genetics researchers who also have strong interests in breeding. Informal post-survey personal communication with some maize researchers anecdotally indicated that when researchers feel that their expertise is inadequate, they do not take these types of surveys.
Results and discussion
Rationale for a survey and steps for tool development
Figure 1 shows the simplified flowchart detailing the steps we followed to prepare the survey. MaizeGDB is guided by a project plan that covers a 5-year period. The project plan is developed with the assistance of the National Program Leadership at the U.S. Department of Agriculture–Agricultural Research Service based on the input they received from agricultural stakeholders. These stakeholders include the maize genetics and breeders community, the Maize Genetics Executive Committee and commodity groups such as the National Corn Growers Association. The project plan is then peer-reviewed, and rated for funding. The project plan defines the objectives, goals and deliverables for the project and provides a framework and roadmap for the MaizeGDB project. In addition, an advisory group that consists of mainly maize researchers, called the MaizeGDB Working Group, provides yearly feedback on MaizeGDB activities. Through these two channels, the project plan and review process MaizeGDB Working Group feedback, MaizeGDB was tasked to prepare a survey to assess the needs of the community for genomic and diversity data visualization tools, especially for maize breeders.
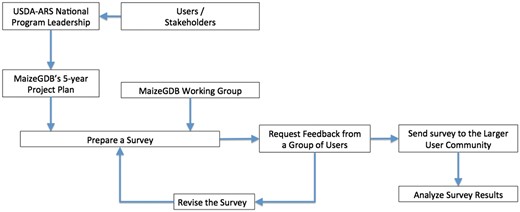
Flowchart showing the survey preparation workflow at MaizeGDB.
A variety of different approaches can be taken for survey preparation. Often the surveys are detailed and it requires sustained effort on the part of the survey participants when the survey is taken. In contrast, the MaizeGDB team sees surveys as a start of a conversation with our users; and we keep the surveys intentionally short to increase users’ motivation for participation, but stay in touch with them after they fill out the survey to make our tools better. As a team, we are in fact in constant contact with our users; our curators are physically located at user locations at UC Berkeley and University of Missouri with many maize researchers nearby. We also have a very engaged community: the maize research community appreciates and values MaizeGDB greatly, and is always willing to provide feedback to MaizeGDB as a service so that MaizeGDB can be a better resource for the community. When we survey our community and create tools, it is always an ongoing and iterative process, which includes a great deal of one-on-one feedback from the users. It is not uncommon that we release tools to address one user need, and subsequently improve them to address additional user needs as the time goes by.
The first step before creating a survey is to research and evaluate available tools, solutions and datasets that meet the objective’s goals. This step allows the team to help determine if current solutions exist or if new solutions need to be developed. It is only through actually using the available tools that their strengths and weaknesses can be assessed. After the evaluation period, we meet with a selected sample of stakeholders (including domain knowledge experts and potential users) to verify our results and to better understand their needs. With the input of the stakeholders, we create a survey to get broad input on the stakeholder’s needs. Once the results of the survey are collected and tabulated, we again meet with a subset of stakeholders to better understand the survey results. At this point, MaizeGDB creates a development plan and will start developing and/or deploying tools and generating and/or curating datasets based on the feedback from the survey and to meet the goals and deliverables of the project plan (Figure 2). Especially for public-facing projects, beta-testing groups are formed to test the resources before they are released to the general public. After thorough testing with various web browsers, the tools and datasets are released on the MaizeGDB staging site. The staging site allows for additional internal testing before being moved to the MaizeGDB production server where it will be available to all public users. There is no final step to this process: we continually interact with the stakeholders to evaluate their needs and how best to update tools and datasets to meet these needs.
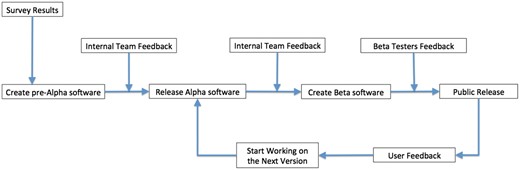
Software release and enhancement cycle at MaizeGDB.
Survey
In the Supplementary Materials section, we provide the survey questions and raw survey responses without personally identifiable information. Below, we provide our interpretation of the survey responses.
Survey respondents
Organizations
Based on self-identification, the respondents are largely principal investigators (55%) or scientists/postdocs (23%). The remaining respondents are graduate students and technicians. No undergraduate students took the survey. Interestingly, 10% of the respondents chose “Other” to designate his/her role. The respondents’ organization types are overwhelmingly academia (64%). The rest are from government (20%) and industry (16%). Only one person chose the “Other” category.
Respondents’ research focus
The research focus of the respondents primarily belongs to two related areas: 38% specified “Breeding,” while 33% chose “Quantitative Genetics.” In addition, 11% responded as “Biochemical and Molecular Genetics,” and 7% as “Computational Biology.” These responses show the survey takers are largely biologists with either a breeding or quantitative genetics background. We discovered while creating our survey that some consider these two terms to be interchangeable, as we discuss below.
Breeders
As we consulted maize researchers for the survey, we realized that the term “breeder” has different meanings for different researchers. To some, a breeder is narrowly defined as a classical breeder who works in the field with varieties, and makes crosses based on observations without any direct application of statistics. For these researchers, quantitative geneticists use statistical methods, and “breeders” do not. Another divergence for the meaning of “breeders” arose during our personal conversations: some researchers who were widely known as breeders in the maize community did not consider themselves as breeders, because, they (paraphrasing) “only work on maize varieties to understand the genetic mechanisms, and not directly improve them.” Though differences in the definitions of a breeder are not directly related to the goals of the survey, we were intrigued by this divergence, and asked the respondents whether they identify themselves as breeders with 53% of them answering this question positively. Among those self-identified breeders, 62% of them chose breeding as the focus of their current research program, while 29% chose quantitative genetics. Interestingly, one of the comments left in our survey by a self-identified non-breeder, called breeders as “too close to for profit,” and urged us not to create tools for them. Unintentionally, our survey revealed different undertones of how a breeder is defined and perceived by others in the maize research community. To increase the participation and, in a way to reduce the prejudice, we stopped calling the survey as “survey for breeders.” The absence of “breeders” was reflected in the subject line of our e-mail: “Survey for Diversity and Pedigree Visualization Tools at MaizeGDB.” The final version of the survey was sent to the whole community only once and it was entitled “Survey for Diversity and Pedigree Visualization Tools for Corn Breeders Data Center at MaizeGDB.” The wording still mentions “breeders,” but it is in the context of a section in our interface: “Corn Breeders Data Center at MaizeGDB.”
Data and its visualization
What type of data would be most beneficial to visualize?
The respondents overwhelmingly voted four types of data that would be beneficial to visualize. Respondents were allowed to choose multiple categories, and each of the following types of data received 70% of the votes: (i) pedigree relationships; (ii) Haplotype analysis in a given list of lines; (iii) single nucleotide polymorphisms (SNPs) in a region for a given list of lines; and (iv) QTL regions. The first three were specified as the respondents’ top priorities.
How do you want (diversity and pedigree) data to be visualized?
In the survey, we did not provide multiple categories for this question and intentionally left it open-ended. Our goal was to seek input from our users in case we omitted any critical type of data. We received broad input in this category, and the raw answers can be found in the Supplementary Materials. In summary, the respondents suggested providing displayed data in different downloadable and commonly used formats, including in the comma-separated values (CSV) file format, as this format can be used to upload data to a wide range of scientific software. In addition to the survey results, our personal communications during the Maize Genetics meeting revealed another feature request being the ability to create journal-quality images for publications. Although desktop software applications do usually include this feature, web-based applications rarely have the inherent ability to generate high-quality images.
Any other type of data you would like to see visualized at MaizeGDB?
The responses largely centered on establishing relationships between genotypes and phenotypes. Respondents recommended creating connections among lines to display genotypic diversity. Some suggested in the comments to allow users to choose and display lists of SNPs along with linkage disequilibrium values. Also, respondents indicated that they would like to have highly integrated displays enriched with line-specific genetic and QTL information.
Maize populations/lines
Which publicly available maize inbreds/founders/populations would be most beneficial to visualize in pedigree views at MaizeGDB?
During the preparation stage of the survey, we asked the maize researchers to cite a range of populations and lines that will be useful to the broader maize genetics and breeding community. Even during the survey preparation stage, some population names were independently mentioned several times. The answers to this question indicated two populations that need to be prioritized for visualization: “3000 inbred lines from Romay et al. (11)” and “Expired Plant Variety Protection Act" lines (ex-PVPs) with 56 and 67% of the respondents choosing these populations respectively.
It was not surprising that these two populations were selected by the respondents, as these lines are widely used in the community. Romay et al. (11) applied a novel genotyping-by-sequencing technology to 2815 maize inbred lines to identify 681 257 SNPs. These seeds are publicly accessible through the Germplasm Resources Information Network (GRIN) database, and can be ordered through USDA-ARS North Central Regional Plant Introduction Station located in Ames, IA. The traits of some of these lines have been studied for decades, and Romay et al.’s work now enables plant researchers to relate these traits to genotypic variations. As to the second population, the PVP Act of 1970 provides intellectual property protection and associated rights to breeders for up to 25 years (for maize the protection is for 20 years). After the expiration date, the public, which includes scientific researchers, can then use these lines. Because these lines are already known to have commercially valuable phenotypes, the understanding of the genomic basis underlying these specific phenotypes is scientifically interesting.
What publicly available lines should be prioritized for tool development at MaizeGDB?
In addition to populations, we sought to identify specific lines that will be useful to maize researchers, because we could then offer them as examples in our new visualization tools. Some responses to this question included a good guideline for the future: always include the lines that have assembled genomes. This recommendation makes sense, because when researchers sequence maize lines, they choose the lines that are of high interest to the maize research community; lines that were, unsurprisingly, also studied for decades. In fact, most of the lines indicated in the survey responses were either sequenced, in the process of being sequenced, or likely to be sequenced. Consequently, these lines are already genotyped and part of the population used by Romay et al. (11)
Software that maize researchers use for research
Our goals to collect the software commonly used by the researchers were: (i) we wanted to find out what software are available that we were not aware of, (ii) design or implement a web-based software with similar views and functionalities that are available in these commonly-used desktop software, knowing that these views are already useful for researchers. Knowing what software is used and incorporating the features of these software would then increase the utility of the software we will implement on our site.
Software applications used by maize researchers show a wide range of complexity and availability. Microsoft Office was mentioned frequently, especially Excel. Given its ubiquity, competitive price, and ease of use, it is not surprising that Microsoft Office products are applications of choice for maize researchers. On the other end of the spectrum, specialized statistical applications such as full-suite software SAS and the popular programming language R were frequently stated. R is a powerful and free analysis and visualization language with rich libraries. Other software that are cited were TASSEL (12) (Trait Analysis by aSSociation, Evolution and Linkage) for associating variation with traits, and PRISM plant breeding software for breeding data management and sharing (available from Central Software Solutions).
Online tools
The most popular online tool cited by maize researchers was BLAST (13). Other “tools” included online databases such as MaizeGDB, iPlant (now CyVerse), NCBI and some web-based applications that these databases use for genome browsing (e.g. GBrowse (14)).
Conclusions
Visually expressing data in useful formats is always a challenge as it requires creating integrated views that are rich in information content, yet simple enough to avoid visual clutter. An infamous example of such a cluttered view is the “hairball” view of protein-protein interaction networks (15), whereby a view provides all the interactions in one figure, and ultimately makes it impossible to extract information. For any visualization to be useful, it is important to ask in the beginning of the project how users will benefit from it. The one-size-fits-all visualization for every researcher and for every research problem does not exist, and limited resources prohibit creating views for each different problem. By asking the maize researchers themselves what they need to accomplish their work, we are able to prioritize tasks and curation, and devote resources to areas with the greatest need.
As it can be seen in the Supplementary Materials, the maize research community responded to our survey enthusiastically and provided specific directions for tool development and curation. The survey determined that people want the following four outcomes and relationships visualized: (i) pedigree relationships, (ii) haplotype analysis in a given list of lines, (iii) SNPs in a region for a given list of lines and (iv) QTL regions. As a direct response to the survey results, MaizeGDB has started to enrich data on its pages and develop tools. Driven by the survey results we will: (i) display immediate progenies of current stocks at the MaizeGDB Stock pages; (ii) load the most recent ex-PVP lines from GRIN into the maize database so they are accessible from the MaizeGDB Stock pages and integrated with other data; (iii) develop network views of pedigree relationships; and (iv) visualize genotypes from diversity datasets.
We are in the process of building new tools as a result of this survey, and we are at the stage of contacting the beta users. Out of 48, 30 people agreed to serve as a beta testers, and we will be contacting them as we develop our web-based tools.
Supplementary data
Supplementary data are available at Database online.
Acknowledgements
We would like to thank the maize research community for their continuous support of MaizeGDB as their community’s database. We specifically thank the following researchers who worked with us closely during the preparation of the survey: Paul Scott, Jode Edwards, Thomas Lubberstedt, Ed Buckler, Bill Tracy, Mark Millard, among others. We would like to thank Margaret Woodhouse and Jesse Walsh for reviewing this manuscript.
Funding
United States Department of Agriculture-Agricultural Research Service. Funding for open access charge: United States Department of Agriculture-Agricultural Research Service.
Conflict of interest. None declared.
References
Author notes
Present address: Taner Z. Sen, USDA-ARS, Western Regional Research Center, Crop Improvement and Genetics Research Unit, 800 Buchanan St., Albany, CA 94710, USA.
Citation details: Sen,T.Z., Braun,B.L., Schott,D.A., et al. Surveying the Maize community for their diversity and pedigree visualization needs to prioritize tool development and curation. Database (2017) Vol. 2017: article ID bax031; doi:10.1093/database/bax031
