


Abstract
The ability of current kinetic models to simulate the phenotypic behaviour of cells is limited since cell metabolism is regulated at different levels including enzyme regulation. The small molecule regulation network (SMRN) enables cells to respond rapidly to environmental fluctuations by controlling the activity of enzymes in metabolic pathways. However, SMRN is not as well studied relative to metabolic networks. The main contributor to the lack of knowledge on this regulatory system is the sparsity of experimental data and the absence of a standard framework for representing available information. In this paper, we introduce the KinMod database that encompasses more than 2 million data points on the metabolism and metabolic regulation network of 9814 organisms KinMod database employs a hierarchical data structure to: (i) signify relationships between kinetic information obtained through in-vitro experiments and proteins, with an emphasis on SMRN, (ii) provide a thorough insight into available kinetic parameters and missing experimental measurements of this regulatory network and (iii) facilitate machine learning approaches for parameter estimation and accurate kinetic model construction by providing a homogeneous list of linked omics data. The hierarchical ontology of the KinMod database allows flexible exploration of data attributes and investigation of metabolic relationships within- and cross-species. Identifying missing experimental values suggests additional experiments required for kinetic parameter estimation. Linking multi-omics data and providing data on SMRN encourages the development of novel machine learning techniques for predicting missing kinetic parameters and promotes accurate kinetic model construction of cells metabolism by providing a comprehensive list of available kinetic measurements. To illustrate the value of KinMod data, we develop six analyses to visualize associations between data classes belonging to separate sections of the metabolism. Through these analyses, we demonstrate that the KinMod database provides a unique framework for biologists and engineers to retrieve, evaluate and compare the functional metabolism of species, including the regulatory network, and discover the extent of available and missing experimental values of the metabolic regulation.
Database URL: https://lmse.utoronto.ca/kinmod/KINMOD.sql.gz
Introduction
The main goal of metabolic modelling is to mathematically simulate cell metabolism under changing environments and utilize this knowledge to optimize bio-products manufacturing (1). Metabolism is a complex system of chemical reactions regulated at different levels, i.e. transcription and translation regulation, inhibition and activation via allosteric regulation of enzymes (2, 3). When facing environmental fluctuations, cells adapt to the new condition by tuning the capacity of enzymes through metabolic regulation (4). This small molecule regulatory network acts on a time scale much faster than gene regulation (5–7); metabolic regulation has a significant role in the metabolic response to fluctuation (8, 9). The dynamic behaviour of cells in changing environments has been investigated using kinetic modelling; however, available models are not able to capture a comprehensive view of the metabolism and the metabolic regulation (10, 11). The main challenge in developing a complete coarse-grained model of metabolism is our incomplete knowledge of multi-omics data needed for parameter estimation (9, 10, 12–14).
Multi-omics data is scattered across various biochemical and enzymology databases such as BRENDA (15), UniProt/Swiss-Port (16), PubChem (17) and Protein Data Bank (PDB) (18). These databases are essential references in metabolic engineering, covering information on the properties of classified enzymes and metabolites, including data on the reactions, kinetic parameters, substrates, products and small molecule regulators (15, 16). Yet, each of these resources partially covers metabolism; thus, exploring possible connections between an attribute of interest and all other attributes is challenging (19). Moreover, each dataset supports a unique notation language to represent multi-omics data. Therefore, the existence of a standard notation language is lacking in multi-source information.
Here, we present the KinMod database that links the kinetic parameters data of 9814 organisms to enable novel data analytics opportunities and practical understandings of cellular metabolism. In the present work, we aim to create a novel hierarchical data model of multi-omics data to enable querying structured data that has initially been scattered across multiple references. This work collects multi-source data covering diverse segments of metabolism and standardizes the complex relationships and descriptions of data into computerized processing and reasoning called ontology. The constructed ontology in this paper presents a more complete picture of metabolic regulation and enables data mining of metabolic rules and interactions across various organisms using machine learning approaches. Finally, we investigate six types of analysis that can be performed on the KinMod database to extract relations within or across organisms to find insights into the metabolic regulatory network. To the best of our knowledge, the KinMod database is the first bioinformatics tool that investigates the functional metabolism of cells, including their regulatory network, on a large scale and presents information that enables machine learning approaches.
Materials and methods
More than 10 M data points were extracted from biological and chemical data references, BRENDA (15), PDB (18), Swiss-Prot (16) and PubChem (17). Extracted data were related to different sections of the metabolism (Figure 1A). Duplicate compounds were identified using the first layer of InCHI. Also, redundancy in reactions was omitted using structural information of reactants and EC numbers (Figure 1B). Then, data points were mapped to an ontology of hierarchical classes. The final ontology encompasses more than 2M curated data points (Figure 1C). The constructed ontology enables extracting meaningful relationships within- and cross-species. An instance of a within-species relationship is the percentage of metabolic enzymes of Escherichia coli with at least one small molecule regulator compared to those with no identified regulatory interactions. An example of the cross-species relationship is the percentage of organisms in the KinMod database that do not have any reaction or regulator in the list of the well-known reactions and identified metabolic regulators (Figure 1D). In the following sections, we discuss each panel in more detail.
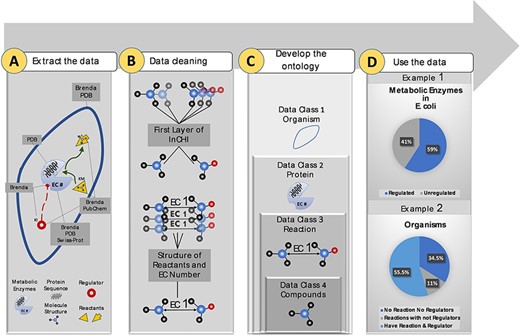
Visual abstract of the current study. Panel (A): Kinetic data scraped from BRENDA, PDB, PubChem and Swiss-Prot, each focused on separate sections of metabolism. Panel (B): Redundancy in compounds and reactions is filtered. Panel (C): Standard representation of multi-source data in hierarchical ontologies. Panel (D): The KinMod database enables extracting statistics of within- and cross-species relationships. (Example 1) 59% of enzymes in Escherichia coli have at least one known regulator, an example of the within-species relationship. (Example) 55.5% of organisms have at least one established reaction and regulator, an instance of the cross-species relationship.
Data extraction and cleaning
Kinetic parameters (inhibition, saturation and enzyme turnover constants, KI, KM, kcat, and compounds names were mined from the BRENDA database. SMILES (20), InChIKey (21) and InChI (22) were scrapped from PubChem for all retrieved compounds. Then, duplicate compounds were purified using the connectivity and proton layer of the InChI string. Structural properties belonging to other InChI layers, such as stereochemistry, were neglected in distinguishing replicated compounds. Also, compounds with unknown structures were excluded from the database (supporting information, section 1-1). Moreover, reaction strings with distinguished reactants were scrapped from the BRENDA database. Then, they were annotated with 2D structural information of reactants and stoichiometric coefficients. Incomplete BRENDA reactions with missing substrates or products were excluded from the rest of the analyses. Duplicate reactions were identified by comparing stoichiometric coefficients and 2D structures of reactants. EC numbers of proteins and organisms were collected from the BRENDA and PDB database. Then, sequences were generated for each EC number using the PDB database. Furthermore, all active site information for each protein and Gene Ontology classification (23) were compiled from the Swiss-Prot database. Finally, each protein sequence was assigned with Swiss-Prot and PDB identifiers. Other features for compounds, enzymes and organisms were collected accordingly (Table 1).
Hierarchical data relationship, available classes in ontology and a complete list of class attributes available in the KinMod ontology database
| Class number | Class definition | Class attributes | Child class(es) | Parent class(es) | Source |
|---|---|---|---|---|---|
| 1 | Organism | —Genus —Species | Protein | – | BRENDA (15) |
| 2 | Protein | —Recommended Name —Systematic name —PDB Id —Swiss-Prot Id —EC number —Protein sequence —Binding site —Molecular weight —Gene Ontology (GO) | —Reactions —Compounds (regulators) | Organism | —BRENDA (15) —PDB (18) —Swiss-Port (16) |
| 3 | Reaction | —Reaction formula —Reaction Unique String —Stoichiometric coefficients | —Compounds (reactants) | Enzyme | —BRENDA (15) —PDB (18) |
| 4 | Compound | —Name —PubChem Cid —Synonyms —KEGG Id —Molecular weight —Chemical formula —Smiles —InCHIKey —InCHI —Charge —KI value —KM value —kcat value | – | Enzyme reaction | —BRENDA (15) —PubChem (17) —KEGG (28) |
Ontology development
An ontology database is a systematic description of knowledge as a set of classes and relationships between them and has been widely used to analyse biological and chemical information (24–27). We specify biological data into classes and define a hierarchical relationship between them to enable this description. In the KinMod ontology database, each data class is characterized by a proper set of attributes and is linked to parent or child classes. Organisms are categorized with data class number 1. Each organism contains a set of proteins defined with data class number 2. Important protein properties such as amino acid sequences and EC nomenclature are associated with this class. The protein class is linked to appropriate reactions (class three) and compounds (class four) regulating the enzyme activity with associated KI parameters. Moreover, compounds are also child class of reactions in the form of substrates and products; the kinetics of enzyme saturation (KM values) and enzyme turnover rate (kcat values) were associated with each substrate (Table 1).
Data availability
KinMod database files and supporting information on how to query the SQL database can be found at: https://github.com/LMSE/KinMod.
Database overview
Data content
The KinMod database contains omics data on 9814 organisms, 67 651 proteins, 18 558 biochemical reactions and 166 969 compounds. The KinMod database also includes 41 967 protein sequences generated from the PDB database on 14 250 proteins with 3369 unique EC numbers (Figure 2). Moreover, 26 854 proteins are assigned with a total of 91 020 binding sites data from the Swiss-Prot database. In addition, 20 971 proteins are linked with proper regulator molecules and 15 932 experimentally measured KI values are available for 3923 of these proteins. Finally, 37 103 KM values are available for 7762 chemical reactions. In total, the KinMod database encompasses more than 2 million data points. The hierarchical data structure in the database enables the investigation of relationships and attributes of interests. Below, we discuss five types of analysis that can be accomplished using the KinMod database: analysis of available organism models, EC numbers, regulator molecules, kinetic parameters and the cross-species similarity of functional metabolism.
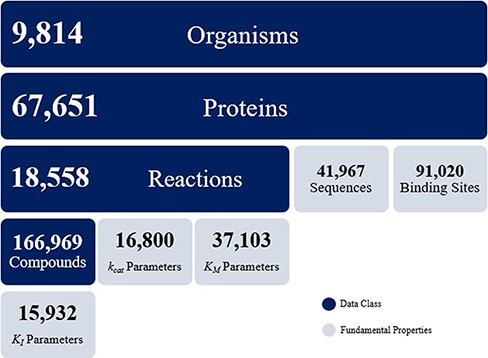
Data overview of the KinMod database.
A comparison of available models
Figure 3 illustrates a classification of available organism models in the KinMod database based on the number of associated regulators and proteins. The yellow class contains the Homo sapiens and Rattus norvegicus models with the most connected kinetic data points. Several models, including E. coli and Saccharomyces cerevisiae, are classified in the black category with the second highest number of available omics data. Although kinetic models of core metabolism of E. coli and S. cerevisiae have been constructed in previous years, large-scale kinetic models of organisms in the yellow and black categories are still lacking. The main contributor to this lack of models is likely the absence of a tool to combine existing omics data in a standard structure for the input of kinetic models. The KinMod database aims to address this requirement, however, it should be noted that further development of KinMod is required to address coding variation, since the parameters are currently not linked to specific strains, and take a pangenomic approach for data organization. Finally, Figure 3 suggests that the brown category lacks sufficient experimental data points compared to the other classes.
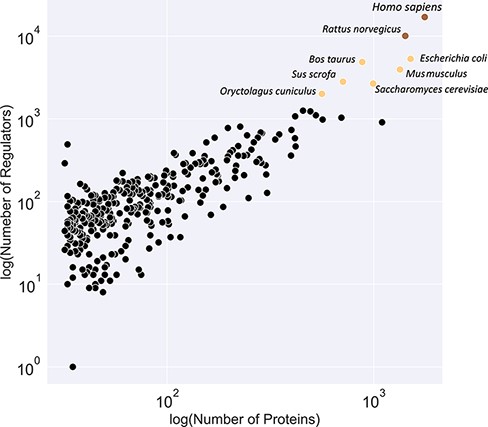
Classification of organisms based on their number of proteins (x-axis) and regulators (y-axis) into three classes (brown, yellow and black). The brown class represents intensively studied organisms with more than 10K regulators and 1K proteins, whereas the black category denotes moderately researched models with less than 2K effectors and 500 proteins.
A comparison of EC numbers
A total of 67 651 proteins in the KinMod database are represented with 6181 distinct EC numbers with well-defined four layers, among which 24 149 proteins corresponding to 4345 EC numbers are linked to at least one clearly stated regulator molecule. Figure 4 investigates data spread for seven EC classes by considering the number of regulator molecules interacting with them and the number of distinct species inheriting them in metabolism. In total, oxidoreductase EC(1) documents the highest number of regulated enzymes, followed by transferases EC(2) and hydrolases EC(3). Tyrosinase (EC 1.14.18.1), belonging to oxidoreductases EC(1), is the most regulated enzyme with 1447 different regulator molecules, appearing in the metabolism of 166 individual species. Tyrosinase is a promiscuous enzyme abundantly found in a wide variety of eukaryote and prokaryote cells (29, 30) and plays a crucial role in the metabolism of xenobiotics and drugs, resulting in a decrease in drug concentration and efficiency (31). Also, it dramatically regulates melanogenesis within melanocytes and determines the skin colour (32). Recently, this enzyme has been the focus of many computational studies (33), as its inhibition assists scientists in maintaining a high concentration of drugs when treating severe diseases such as melanoma. The supporting information, Table 1, lists key enzymes that interact with more than 600 regulator molecules. Hence, providing a comprehensive kinetic database facilitates simulating regulatory mechanisms of crucial enzymes such as tyrosinase and studying downstream metabolic changes.
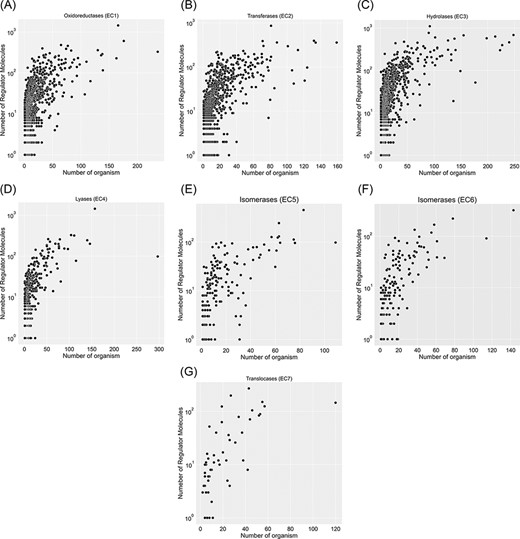
Visualization of seven EC classes based on the number of regulators interacting with each EC number and the number of specific organisms that inherit them in metabolism. EC(1) represents the highest number of regulated enzymes among the seven categories.
A comparison of regulator molecules
In the KinMod database, 166 969 compounds can participate in a similar biochemical reaction or regulatory interactions across species. Thus, only 21 496 unique molecular structures can be identified among 166 969 KinMod compounds. Out of 21 496 molecules, 15 320 show regulatory effects in the form of inhibition, activation or both. A total of 13 035 regulator molecules exhibit only inhibition, 542 act solely as activators and the remaining 1743 exhibit both inhibitory and activating effects. The remaining 6176 molecules only participate in biochemical reactions as substrates or products.
Figure 5 categorizes regulator molecules based on their regulatory effect (inhibitors, activators or both) and visualizes data on molecular weight and the number of interacting enzymes. Molecules with many interacting enzymes are usually natural cofactors, metal ions or synthetic drug molecules (supporting information Figure S5). Cofactors and metal ions are frequently associated with metabolic regulations across organisms. Metal ions such as Ca2+, Cu2+ and Zn2+ are important signalling molecules involved in many regulatory interactions with cellular functions (34). Also, cofactors such as NADH/NAD+ are fundamental regulators of various biological processes, such as energy metabolism, calcium homeostasis, mitochondrial functions, gene expression, antioxidation/generation of oxidative stress, immunological functions and cell death (35). Moreover, heavy regulators with many interactions with enzymes are complex structures with multiple reaction sites. These molecules are an example of non-specific inhibitors that drastically influence metabolism due to interacting with numerous metabolic enzymes. For instance, aprotinin is a broad-spectrum inhibitor for serine protease with a molecular weight of 6512 Da. It was initially isolated from the cow’s pancreas in 1930 and widely used as an antifibrinolytic agent in cardiac surgery to reduce blood loss. It was used until 2007 when this molecule’s acute kidney injury properties were discovered, and this drug was withdrawn from the market (36).
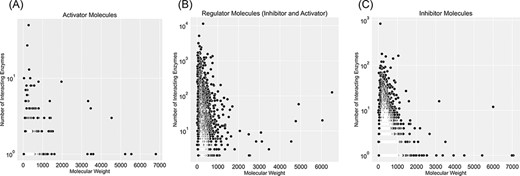
Visualization of compound categories, inhibitors, activators and molecules that are both inhibitors and activators, based on the number of interacting enzymes and their molecular weight.
A comparison of kinetic parameters
Finally, the hierarchical data structure in the database can provide the user with experimentally measured kinetic parameters for each protein and reaction. Due to the complexity of in vivo measurements, experimental data on KI, kcat and KM values are not fully discovered yet. The KinMod database can be used to visualize missing kinetic data to assist experiment designs for estimating unknown parameters. Moreover, the KinMod database can provide kinetic data distribution for given enzymes across organisms on which appropriate statistical analyses are applicable. As an instance, Figure 6 illustrates a heatmap of available KI measurements for all the regulators of EC 1.14.18.1 across organisms KI values of this enzyme are mostly less than 0.5 |${\mu M}$| (top heatmap); greater values can be seen across organisms (bottom heatmap). As the value of KI parameters decrease the inhibition power increases. Thus, the top heatmap visualizes more potent regulator molecules than the bottom chart. The skewed distribution of KI measurements is visualized in supporting information Figure S4. Although measured kinetic parameters for EC 1.14.18.1 number are mainly in the same order of magnitude within organisms, a significant difference is observable across species. Moreover, similar regulatory molecules are reported across organisms. However, it is unclear if missing values are due to a lack of regulatory interaction with proteins in other species or if these are due to missing experiments to measure them. A similar pattern is observable for KM values of metabolic reactions catalysed by EC 1.14.18.1 in Figure 7. Although, the order of magnitude of KM changes dramatically across organisms and missing values are noticeable, variations of KM values are negligible within organisms and missing values can be replaced with appropriate statistical measurements such as mean or median. Here, we propose that the KinMod database can be used to visualize available knowledge on the kinetic parameters and thus facilitate kinetic parametrization for reactions and proteins.
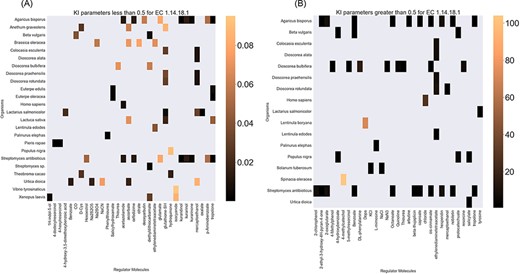
A heatmap of EC 1.14.18.1 |${{\rm{K}}_{\rm{I}}}$| values of regulator molecules (x-axis) seen in particular organisms (y-axis). As the distribution of |${{\rm{K}}_{\rm{I}}}$| is highly skewed, data is visualized in two heatmaps (the first heatmap presents a heatmap of values less than 0.5 and the second figure represents a heatmap of parameters greater than 0.5). Lower values of |${{\rm{K}}_{\rm{I}}}$| parameters are associated with higher inhibition effects.
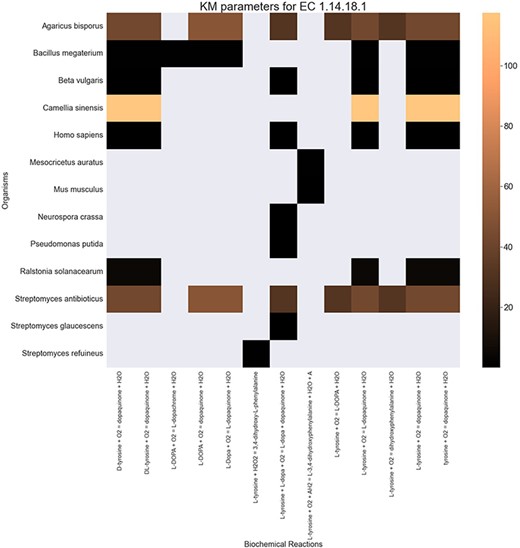
A heatmap of |${{\rm{K}}_{\rm{M}}}$| values for all the reactions catalysed by 1.14.18.1 (x-axis) seen in particular organisms (y-axis).
Cross-species similarity of functional metabolism
Calculating similarity between genomes of different organisms using tools such as BLAST (37) does not fully account for the functional relation of species (38, 39) as genes with unassigned functionality can encode up to 50% of genomes (38, 40). Thus, unanswered questions on the regulatory network and metabolism adaptation cannot be investigated by considering gene sequence only (41). Here, we present an analysis for clustering species based on enzymatic activities associated with their metabolism. As previously suggested (42, 43), we consider only EC numbers for representing metabolic enzymes to allow the mapping of functions between organisms. In this analysis, we queried 317 organisms from the KinMod database, whose metabolism was annotated with at least 1% of four-level EC numbers with known regulators (see supporting information for MySQL query). Then, we randomly sampled 174 organisms (sample size is calculated for a confidence interval of 95%) and analysed the similarity of their metabolism based on available regulated EC numbers in each organism to perform a statistical comparison (Figure 8).
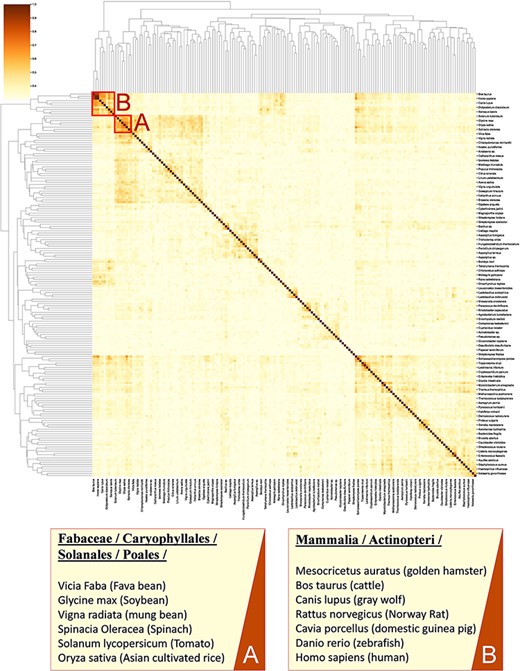
A cluster map of a random sample of 174 models based on their similarity in functional metabolism. Red box A contains species belonging to Magnoliopsida (flowering plants) class. Box B include species of class Mammalia and Actinopteri.
Figure 8 illustrates distinct species clusters with the functional relationship between metabolisms across species. As an instance, red box A contains species belonging to Fabaceae, Caryophyllales, Solanales and Poales orders. These orders belong to the class of Magnoliopsida (flowering plants) and include families of bean, tomato, spinach and rice. Accordingly, the metabolic behaviour of these species and their regulatory network are significantly related. To the best of our knowledge, no metabolic similarity analysis has been performed on these species to validate this framework.
As another example, red box B contains mammalians (Homo sapiens and rodents such as R. norvegicus) and an actinopteri species, Danio rerio (zebrafish). According to this analysis, actinopteri and Homo sapiens are likely to be metabolically related, although evolutionarily distinct. Many studies (44, 45) suggest that zebrafish can be used in gene knockout studies as 70% of human genes have shown similar properties and functionality to the zebrafish genome, compared to 80% of human genes to the rodents genes (44, 46). Here, we propose that zebrafish’s functional metabolism and regulatory network are also comparable to Homo sapiens, with a similarity score of 59.3%. At the same time, mammalian cell similarity scores to Homo sapiens vary between 51.8% in Mesocricetus auratus and 68.9% in R. norvegicus. Due to these metabolic similarities, new findings (45–47) have utilized zebrafish for drug discovery and investigating the effects of xenobiotics on metabolic pathways. Similarly, other clusters in Figure 8 can be interpreted and functional metabolism can be compared.
Discussion
Currently, the application of kinetic models is limited due to a lack of a standard platform for presenting multi-omics data across organisms. Current kinetic models focus only on E. coli core metabolism and neglect most regulatory interactions in metabolism. Nevertheless, the accuracy of such models has significantly improved over the years, and they continue to include more data points on the E. coli model. The KinMod database can facilitate kinetic model construction by providing standardized data points on the metabolism, especially the regulatory network.
The KinMod database is a unique platform that combines scattered data across multiple sources to build value in large-scale assessments of metabolism. It uses 2D structural data of compounds to reduce redundancy among omics data. It focuses on the interpretation of attributes and relationships between metabolic regulatory networks and thus complements existing regulation data. It has a very low barrier to use because it follows a hierarchical data model, and all data points are fully defined with a proper set of attributes. Although the current version of the database only includes data from BRENDA, PDB, Swiss-Port and PubChem, it can be easily expanded to include more references in systems biology. Finally, as the experimental data on kinetics accumulate in the KinMod database, the accuracy, range and variety of mentioned analyses increases.
This platform is still limited to the availability of experimental data points and in vivo measurements of kinetic parameters. The hierarchical data structure of this database allows the user to identify missing measurements and design appropriate experiments to fill in the missing data. The rational design of experiments with the aim of finding at least one kinetic data point for each protein is required to address the complexity and sparsity of multi-omics data. Furthermore, in order to extensively meet the objective of supporting kinetic model construction, it should be noted that the KinMod database does not fully capture complex enzyme and regulator relationships that might be required to build kinetic models. For example, protomer formulas for enzymes as well as other details of regulatory mechanisms are not included in KinMod. Although KinMod currently has inhibitor and activator tags for regulatory relationships between molecules and enzymes, it would be preferred that more of the aforementioned parameters be added to the database to allow for more accurate development of kinetic models. Finally, the KinMod database currently classifies reactions using independently built reaction strings that utilize structural components of substrates and products. In order to allow for connection between the reactions in KinMod and other commonly used databases such as SEED and BioCyc, it would be necessary to sort through the reactions using structural identifiers of the substrates, products or proteins. It would be beneficial to further develop this database by adding reaction mechanisms and possible identifiers to KinMod, but it is currently limited by BRENDA’s representation of reactions.
In summary, our unique multi-omics database integrates information on genomics, experimentally obtained metabolite kinetic data, small molecular metabolic regulation and enzyme kinetics and is a comprehensive resource for developing machine learning methods for parameter estimation based on sequence information and for developing large-scale kinetic models of metabolism.
Supplementary data
Supplementary data are available at Database Online.
Funding
Authors would like to acknowledge funding from NSERC Discovery grant to Radhakrishnan Mahadevan. Authors would also like to acknowledge the Genome Canada Bioinformatics and Computational Biology program.
Conflict of interest
There are no conflicts of interests.
