


Abstract
Robust advances in interactome analysis demand comprehensive, non-redundant and consistently annotated data sets. By non-redundant, we mean that the accounting of evidence for every interaction should be faithful: each independent experimental support is counted exactly once, no more, no less. While many interactions are shared among public repositories, none of them contains the complete known interactome for any model organism. In addition, the annotations of the same experimental result by different repositories often disagree. This brings up the issue of which annotation to keep while consolidating evidences that are the same. The iRefIndex database, including interactions from most popular repositories with a standardized protein nomenclature, represents a significant advance in all aspects, especially in comprehensiveness. However, iRefIndex aims to maintain all information/annotation from original sources and requires users to perform additional processing to fully achieve the aforementioned goals. Another issue has to do with protein complexes. Some databases represent experimentally observed complexes as interactions with more than two participants, while others expand them into binary interactions using spoke or matrix model. To avoid untested interaction information buildup, it is preferable to replace the expanded protein complexes, either from spoke or matrix models, with a flat list of complex members.
To address these issues and to achieve our goals, we have developed ppiTrim, a script that processes iRefIndex to produce non-redundant, consistently annotated data sets of physical interactions. Our script proceeds in three stages: mapping all interactants to gene identifiers and removing all undesired raw interactions, deflating potentially expanded complexes, and reconciling for each interaction the annotation labels among different source databases. As an illustration, we have processed the three largest organismal data sets: yeast, human and fruitfly. While ppiTrim can resolve most apparent conflicts between different labelings, we also discovered some unresolvable disagreements mostly resulting from different annotation policies among repositories.
Database URL:http://www.ncbi.nlm.nih.gov/CBBresearch/Yu/downloads/ppiTrim.html
Introduction
The current decade has witnessed a significant amount of effort toward discovering the networks of protein–protein interactions (interactomes) in a number of model organisms. These efforts resulted in hundreds of thousands of individual interactions between pairs of proteins being reported (1). Repositories such as the BioGRID (2), IntAct (3), MINT (4), DIP (5), BIND (6, 7) and HPRD (8) have been established to store and distribute sets of interactions collected from high-throughput scans as well as from curation of individual publications. Depending on its goals, each interaction database, maintained by a different team of curators located around the world includes and annotates interactions differently. Consequently, while many interactions of specific interactomes are shared among databases (1, 9), no one contains the complete known interactome for any model organism. Constructing a full-coverage protein–protein interaction network therefore requires retrieving and combining entries from many databases.
This task is facilitated by several initiatives developed by the proteomics community over the years. The IMEx consortium (10) was formed to facilitate interchange of information between different primary databases by using a standardized format. The Proteomics Standards Initiative Molecular Interaction (PSI-MI) format (11) allows a standard way to represent protein interaction information. One of its salient features is the controlled vocabulary of terms that can be used to describe various facets of a protein–protein interaction including source database, interaction detection method, cellular and experimental roles of interacting proteins and others. The PSI-MI vocabulary is organized as an ontology, a directed acyclic graph (DAG), where nodes correspond to terms and links to relations between terms. This enables the terms to be related in an efficient and algorithm-friendly manner.
Consistently annotated data sets are useful for development and assessment of interaction prediction tools (12–15). Furthermore, such data sets also form the basis of interaction networks, for which numerous analysis tools have been developed (16, 17). Depending on biological aims of a tool, different entities (nodes) and potentially weighted interactions (edges) may be preferred. The chance of conflicting predictions from different tools can be reduced by starting from a consistently annotated data set that faithfully represents all available evidences. Such data set ought to be comprehensive but also non-redundant: the same experimental evidence for an interaction should appear once and only once. To maintain a coherent development of biological understanding, it is indispensable to keep the reference data sets up-to-date.
We examined several primary interaction databases with the aim of constructing non-redundant (in terms of evidence), consistently annotated and up-to-date reference data sets of physical interactions for several model organisms. Unfortunately, the common standard format used by most primary databases still does not allow direct compilation of full non-redundant interactomes. This mainly results from the fact that different primary databases may use different identifiers for interacting proteins and different conventions for representing and annotating each interaction. Combining interaction data from BIND (6, 7) (in two versions called ‘BIND’ and ‘BIND_Translation'), BioGRID (2), CORUM (18), DIP (5), HPRD (8), IntAct (3), MINT (4), MPact (19), MPPI (20) and OPHID (21), the iRefIndex (22) database represents a significant advance toward a complete and consistent set of all publicly available protein interactions. Apart from being comprehensive and relatively up-to-date, the main contribution of iRefIndex is in addressing the problem of protein identifiers by mapping the sequence of every interactant into a unique identifier that can be used to compare interactants from different source databases. In a further ‘canonicalization’ procedure (23), different isoforms of the same protein are mapped to the same canonical identifier. By adhering to the PSI-MI vocabulary and file format, iRefIndex provides largely standardized annotations for interactants and interactions. Construction of iRefIndex led to the development of iRefWeb, a web interface for interactive access to iRefIndex data (23). iRefWeb allows an easy visualization of evidence for interactions associated with user-selected proteins or publications. Recently, the authors of iRefIndex and iRefWeb published a detailed analysis of agreement between curated interactions within iRefIndex that are shared between major databases (24).
However, aiming to maintain all information from original sources, iRefIndex requires users to perform additional processing to fully achieve the aforementioned goals. In particular, iRefIndex considers redundancy in terms of (unordered) pairs of interactants rather than in terms of experimental evidence associated with an interaction. Consequently, there will be features one desires to have that may not fit well within the scope of iRefIndex. For example, one may wish to treat interactions arising from enzymatic reactions as directed and to be able to selectively include/exclude certain types of reactions such as acetylation. In many cases, the information about post-translational modifications is available directly from source databases, but is not integrated into iRefIndex. Another issue that propagates into iRefIndex from source databases has to do with protein complexes. Some databases represent experimentally observed complexes as interactions with more than two participants, while others expand them into binary interactions using spoke or matrix model (1). Turinsky et al. (24) recently observed that this different representation of complexes is responsible for a significant number of disagreements between major databases curating the same publication. From our earlier work (25), we found that such expanded complexes may lead to nodes with very high degree and often introduce undesirable shortcuts in networks. To fairly treat the information provided by protein complexes without exaggeration, it is preferable to replace the expanded interactions, either from spoke or matrix models, with a flat list of complex members. Additionally, we discovered that the mapping of each protein to a canonical group by iRefIndex would sometimes place protein sequences clearly originating from the same gene (for example, differing in one or two amino acids) into different canonical groups.
To achieve the goal of constructing non-redundant, consistently annotated and up-to-date reference data sets, we developed a script, called ppiTrim, that processes iRefIndex and produces a consolidated data set of physical protein–protein interactions within a single organism.
Materials and methods
Our script, called ppiTrim, is written in the Python programming language. It takes as input a data set in iRefIndex PSI-MI TAB 2.6 format, with 54 TAB-delimited columns (36 standard and 18 added by iRefIndex). After three major processing steps, it outputs a consolidated data set, in PSI-MI TAB 2.6 format, containing only the 36 standard columns (Supplementary Table 1). The three processing steps are: (i) mapping all interactants to NCBI Gene IDs and removing all undesired raw interactions; (ii) deflating potentially expanded complexes; and (iii) collecting all raw interactions, originated from a single publication, that have the same interactants and compatible experimental detection method annotations into one consolidated interaction. At each step, ppiTrim downloads the files it requires from the public repositories and writes its intermediate results as temporary files.
Phase I: initial filtering and mapping interactants
In Phase I, ppiTrim takes the original iRefIndex data set and classifies each raw interaction (either a binary interaction corresponding to a single line in the input file or a complex supported by several lines) into one of four distinct categories: removed (not examined further), biochemical reaction, complex or potentially part of a complex, and other (direct binary binding interaction). It removes interactions marked as genetic, originating from publications specified through a command line parameter or having interactants from organisms other than the main species of the input data set (the allowed species can be explicitly provided or any interaction with interactants having different Taxonomy IDs is removed). Additionally, ppiTrim removes all interactions from OPHID and the ‘original’ BIND. The former is removed because it contains either computationally predicted interactions or interactions verified from the literature using text mining (i.e. without human curation). The latter is removed because it processes the same original data set as BIND_Translation (7).
As a first step, the script seeks to map each interactant to an NCBI Entrez Gene (26) identifier. For most interactants, it uses the mapping already provided by iRefIndex. In the cases where iRefIndex provides only a Uniprot (27) knowledge base accession, the script attempts to obtain a Gene ID in three different ways. First, it searches the iRefIndex mappings.txt file (found compressed in ftp.no.embnet.org/irefindex/data/current/Mappingfiles/ for any additional mappings. This part is optional because the mappings.txt file is very large even compressed and it would not be feasible to perform automatic download each time ppiTrim is run. Secondly, for all unmapped Uniprot IDs, it retrieves the corresponding full Uniprot records using the dbfetch tool from EBI (www.ebi.ac.uk/Tools/dbfetch). If a direct mapping to Gene ID is present within the record as a part of DR field, it is used. Otherwise, the canonical gene name (field GN) is used to query the NCBI Entrez Gene database for a matching Gene record using an Eutils interface. If a single unambiguous match is found, the record's Gene ID is used for the interactant. No mapping is performed if multiple matches are obtained. Every mapped Gene ID is checked against the list of obsolete Gene IDs, which are no longer considered to have a protein product existing in vivo. The interactants that cannot be mapped to valid (non-obsolete) Gene IDs are removed along with all raw interactions they participate in.
After assigning Gene IDs, the script considers the PSI-MI ontology terms associated with interaction detection method, interaction type and interactants’ biological roles. Using the full PSI-MI ontology file in Open Biomedical Ontology (OBO) format (28), it replaces any non-standard terms in these fields (labeled MI:0000) with the corresponding valid PSI-MI ontology terms. The terms marked as obsolete in the PSI-MI OBO file are exchanged for their recommended replacements (Supplementary Table 2). The single exception are the interaction detection method terms for HPRD ‘in vitro’ (MI:0492, translated from MI:0045 label in iRefIndex) and ‘in vivo’ (MI:0493) interactions, which are kept throughout the entire processing.
Source interactions annotated with a descendant of the term MI:0415 (enzymatic study) as their detection method or with a descendant of the term MI:0414 (enzymatic reaction) as their interaction type are classified as candidate biochemical reactions. This category also includes any interactions (including those with more than two interactants) where one of interactants has a biological role of MI:0501 (enzyme) or MI:0502 (enzyme target). In the recent months, the BioGRID database has started to provide additional information about the post-translational modifications associated with the ‘biochemical activity’ interactions, such as phosphorylation, ubiquitination, etc. This information is available from the BioGRID data sets in the new TAB2 format but is not yet reflected in the PSI-MI terms for interaction type provided in the PSI-MI 2.5 format or in iRefIndex. Since the post-translational modifications annotated by the BioGRID can be directly matched to standard PSI-MI terms (Supplementary Table 3), the script downloads the most recent BioGRID data set in TAB2 format, extracts this information and assigns appropriate PSI-MI terms for interaction type to the candidate biochemical reactions from iRefIndex that originate from the BioGRID.
Any source interaction not classified as candidate biochemical reaction is considered for assignment to the candidate complex categories. This category includes all true complexes (having edge type ‘C’ in iRefIndex), interactions having a descendant of MI:0004 (affinity chromatography) as the detection method term or MI:0403 (colocalization) as the interaction type, as well as the interactions corresponding to the BioGRID's ‘Co-purification’ category. Interactions with interaction type MI:0407 (direct interaction) are never considered candidates for complexes. All source interactions not falling into candidate biochemical reaction or candidate complex categories are considered ordinary binary physical interactions.
Phase II: deflating spoke-expanded complexes
The Phase II script attempts to detect spoke-expanded complexes from ‘candidate complex’ interactions and deflate them into interactions with multiple interactants. First, all candidate interactions are grouped according to their publication (Pubmed ID), source database, detection method and interaction type. Each group of source interactions is turned into a graph and considered separately for consolidation into one or more complexes. When a portion of a group of interactions is deflated, we replace these source interactions by a complex containing all their participants. Each collapsed complex is represented using bipartite representation in the output MITAB file (the same as the original complexes from iRefIndex, but using newly generated complex IDs) and the references to the original source interactions are preserved (Supplementary Table 1). Two procedures are used for consolidation: pattern detection and template matching (Figure. 1). The deflation algorithm for each new complex is indicated in the output file through its edge type (Table 1).
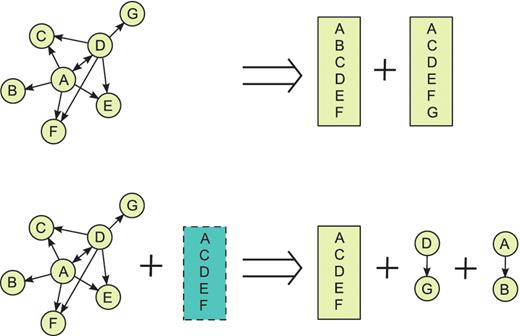
ppiTrim uses two procedures for complex deflation: pattern detection (top) and template matching (bottom). As an example, assume that a graph ABCDEFG, shown on the left, could be constructed from complex candidate interactions annotated by the BioGRID from a single publication. The arrows indicate bait to prey relationships, with the interaction A–D being repeated twice, once with A and once with D as a bait. Pattern-detection algorithm (top) would recognize A and D as hubs of potentially spoke-expanded complexes and thus replace all pairwise interactions on the left with complexes ABCDEF and ACDEFG. Suppose that the complex ACDEF was reported from the same publication by a different database. Then, template matching procedure (bottom) would generate the complex ACDEF (with all other annotation, such as experimental detection method, retained from the original interactions) and remove all original interactions except D–G and A–B. After performing both procedures, ppiTrim consolidates the results so that the overall result would be replacing the original interactions by complexes ACDEF, ABCDEF and ACDEFG with edge type codes `R', `A' and `A', respectively. The interactions A–B and D–G would not be retained since they are contained within the deflated complexes ABCDEF and ACDEFG.
Edge type codes used by ppiTrim
| Code | Description |
|---|---|
| X | Undirected binary interaction (physical binding) |
| D | Directed binary interaction (biochemical reaction) |
| B | Biochemical reaction without indication of directionality |
| C | Original complex (from iRefIndex) |
| G | Spoke-expanded complex; deflated by pattern matching from BioGRID's 'Co-purification' and 'Co-fractionation' categories (reliable) |
| R | Potential spoke-expanded complex; deflated by template matching of a `C'-complex |
| A | Potential spoke-expanded complex (BioGRID only); deflated by pattern detection |
| N | Potential spoke-expanded complex; deflated by template matching of a `G'- or `A'-complex |
Pattern detection procedure is used only for the interactions from the BioGRID. Unlike the interactions from the DIP, those interactions are inherently directed since one protein is always labeled as bait and other as prey (in many cases this labeling is unrelated to the actual experimental roles of the proteins). The pattern indicating a possible spoke-expanded complex consists of a single bait being linked to many preys. Since all interactions in the BioGRID's 'Co-purification’ and 'Co-fractionation’ categories arise from complexes that are spoke-expanded using an arbitrary protein as a bait (BioGRID Administration Team, private communication), a bait linked to two or more preys can in that case always be considered an expanded complex and deflated. Such deflated complexes are assigned the edge type code ‘G'. The remainder of the complex candidate interactions from the BioGRID were obtained by affinity chromatography and are, in most cases, also derived from complexes. Here we adopted a heuristic that a bait linked to at least three preys can be considered a complex. Clearly, some experiments involve a single bait being used with many independent preys, in which case this procedure would generate a false complex. Therefore, complexes generated in this way are assigned a different edge type code (`A') and the user is able to specify specific publications to be excluded from consideration as well as the maximal size of the complex.
The second procedure is based on matching each group of candidate interactions to the complexes indicated by other databases (templates), mostly from IntAct, MINT, DIP and BIND. In this case, the script checks for each protein in the group whether it, together with all its neighbors, is a superset of a template complex. If so, all the candidate interactions between the proteins within the complex are deflated. The neighborhood graph is undirected for all source databases except the BioGRID. The new complexes generated in this way are given the code ‘R'. The script also attempts to use complexes generated from the BioGRID's interactions through a pattern-detection procedure as templates, in which case the newly generated complexes have the code ‘N'. Any source interactions that cannot be deflated into complexes are retained for Phase III.
Phase III: normalizing interaction-type annotation
Overview
The goal of the final phase of ppiTrim is to consolidate all evidence for an interaction, obtained from a single experiment, into one consolidated interaction record. Every source publication contains descriptions of one or more experiments that result in reported interactions. Unfortunately, distinct experiments within each publication are not annotated in all source databases, with the exception of the interactions from IntAct and MINT that appear to distinguish experiments using a numbered suffix to the author's name in the ‘Author’ field. It is therefore necessary to rely on the experimental detection method terms to determine whether source records from different databases, with the same interactants and source publication, represent the evidence for the same interaction. Ideally, all such records with the same detection method can be collapsed into one consolidated interaction, although this may undercount multiple evidences from the same publication obtained by distinct experiments. However, different databases have different annotation policies and do not necessarily use the same PSI-MI term to annotate a given experimental method. To resolve detection method term disagreements, we use the PSI-MI ontology structure (Figure. 2). Two compatible terms assigned by different source databases are considered to represent the same experimental method within a publication. These annotated records are thus consolidated.
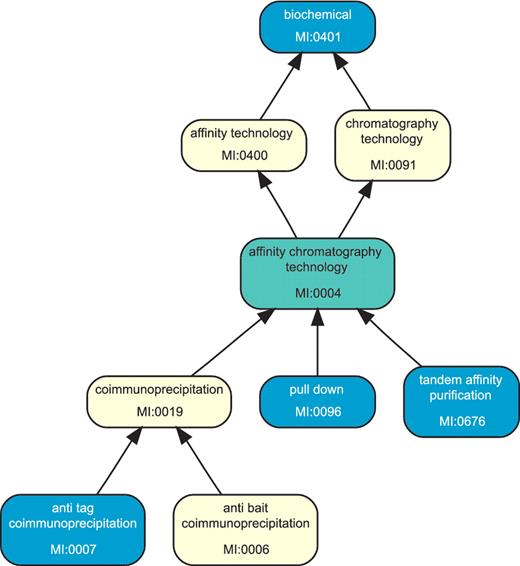
The picture shows a part of the PSI-MI ontology graph for interaction-detection method associated with a hypothetical cluster of source interactions involving the same interactants from the same publication. The terms colored blue are associated with the source interactions within the cluster, while those marked yellow and green are present in the ontology but do not label any source interaction from the cluster. The entire cluster as shown is consistent, with the term MI:0401 as the maximal element. Its finest consistent term is MI:0004 (colored green) since the cluster members smaller than it are not comparable between themselves. Removing the source interactions labeled by MI:0401 from the cluster would result in three distinct subclusters. If two subclusters contain no interaction from the same source database, they would be reported as conflicts.
The Phase III algorithm proceeds as follows. All source interactions and complexes (original as well as deflated in Phase II) are divided into ‘clusters'. Interactions that share the same interactants and the source publication are placed into the same cluster. The order of interactants is significant only for biochemical reactions, which are treated as directed interactions (only when direction can be ascertained). Each cluster is processed independently and divided into subclusters based on compatibility of the PSI-MI terms for interaction detection method. Interactions from each subcluster are collected into a single consolidated interaction, which is output to the final data set. The consolidated record preserves references to all original interactions. Each consolidated interaction is assigned a single PSI-MI term for interaction-detection method that most specifically describes the entire collection of annotation terms within the subcluster. For easier reference, each consolidated interaction is given a unique ppiTrim ID, which is similar to RIGID from iRefIndex. This is a SHA1 hash of a dot-separated concatenation of its interactants (Gene IDs), publication(s), detection method, interaction type and edge type. Every complex uses its ppiTrim ID as its primary ID.
Reconciling annotation
The DAG structure of an ontology naturally induces a partial order between the terms: for two terms u and v, we say that u refines v (u is smaller v, u precedes v) if there exists a directed path in the DAG from u to v. Two PSI-MI terms can be considered compatible if they are comparable, that is, one refines the other. Every non-empty collection of terms U can be uniquely split into disjoint sets Ui, such that every Ui has a single maximal element (an element comparable with and not smaller than any other member) and contains all members of U comparable with its maximal element. Every subcollection Ui is then consistent because there exists at least one term within it that can describe all its members, while any two members from different subcollections are incomparable. The ‘finest consistent term’ of a subcollection Ui is the smallest member of Ui that is comparable with all its members (it can also be defined as the smallest member of the intersection of the transitive closures of all the members of Ui.). If Ui is a total order, where all members are comparable pairwise, the finest consistent term is the minimal term. On the other hand, the minimal term need not exist (Figure 2), so that the finest consistent term is higher in the hierarchy and represents the most specific annotation that can be assigned to Ui as a whole.
To produce consolidated interactions from a single cluster, each of its members (interactions) is identified with its PSI-MI term for information-detection method. For every cluster member, the set of all other members with compatible annotations (`compatible set') is computed. As a special case, the following detection method tags are treated as smaller than any other: ‘unspecified method’ (MI:0686), ‘in vivo’ and ‘in vitro’ (The latter two are from HPRD only). In this way, non-specific annotations are considered as compatible with all other, more specific evidences. Compatible sets are further grouped according to their maximal elements. Within each group, the union of the compatible sets produces a subcluster. The finest consistent term for each subcluster is found by considering all PSI-MI terms on the paths from the subcluster members to its maximum — the search is not restricted to those terms that are within the subcluster (Figure 2).
Conflicts
We consider two subclusters of the same cluster to be in an unresolvable conflict if there is no source database shared between them. This definition takes into account that a source database may report an interaction several times for the same publication, using the same or different interaction-detection method. If two databases annotate the same interaction using incompatible terms, this is most likely due to an error or specific disagreement about the appropriate label, rather than that each database is reporting a different experiment from the same publication. Unresolvably conflicting interaction records, after consolidation, point to each other using ppiTrim ID in the ‘Confidence’ field.
ppiTrim also collects statistics about resolvable conflicts in its temporary output files. A resolvable conflict is the case where source interactions within a single subcluster have compatible but different experimental detection method labels.
Evaluation of the script
To test ppiTrim, we applied it to the yeast (Saccharomyces cerevisiae), human (Homo sapiens) and fruitfly (Drosophila melanogaster) data sets from iRefIndex release 8.0-beta, dated 19 January 2011. The script was run on 13 June 2011 and used the then-current versions of Uniprot and NCBI Gene databases. We restricted protein interactors to allowed NCBI Taxonomy IDs: 4932 and 559 292 for yeast, 9606 for human and 7227 for fruitfly data sets. When processing the yeast data set, we accounted for two special cases. First, we specifically removed the genetic interactions reported by Tong et al. (29) because they were not labeled as genetic for all source databases. Secondly, we excluded the data set by Collins et al. (30) from Phase II and retained all its interactions as binary undirected. This data set is present only in the BioGRID and can be considered computationally derived and partially redundant. Collins et al. (30) reprocessed the data from Gavin et al. (31) and Krogan et al. (32) to obtain an improved set of pairwise interactions. Collins et al. (30) used hierarchical clustering to recover protein complexes, but these are not present in the BioGRID. In spite of its redundancy, we decided not to entirely remove this data set but also not to attempt to deflate its potential complexes because bait/prey assignments may not be meaningful in this case.
Results and discussion
The results of applying ppiTrim to process iRefIndex 8.0 are shown in Tables 2–5. The statistics of ID mapping (Tables 2 and 3) show that a considerable number of interactants could be additionally mapped to Gene ID in human and fruitfly data sets, thus enabling us to take into consideration a few thousand of raw interactions that would otherwise be filtered. This is also evident in terms of iRefIndex RIGIDs (Supplementary Table 4), which associate all raw interactions with interactants with same sequences to a single record. For yeast, the number of interactions gained by mapping to Gene IDs is small because most of mapped IDs were not valid.
Processing source interactions
| Species | Initial | Removed | Without Gene ID | Retained | With mapped Gene ID |
|---|---|---|---|---|---|
| Saccharomyces cerevisiae | 400 449 | 173 815 | 3608 | 223 026 | 880 |
| Homo sapiens | 382 094 | 148 724 | 2738 | 230 632 | 161 87 |
| Drosophila melanogaster | 154 770 | 324 77 | 9476 | 112 817 | 3427 |
Statistics of initial processing of raw interactions from iRefIndex. Shown are the initial number, total number removed due to filtering criteria, number removed due to missing Gene ID, total number of retained and the number retained containing at least one interactant with mapped Gene ID.
Mapping CROGIDs from iRefIndex into Gene IDs
| Species | Initial CROGIDs | Aditional mapped | Final | ||||
|---|---|---|---|---|---|---|---|
| Total | Mapped | Orphans | Total | Valid | CROGIDs | Gene IDs | |
| Saccharomyces cerevisiae | 6159 | 5552 | 607 | 433 | 47 | 5599 | 5618 |
| Homo sapiens | 14 047 | 11 432 | 2615 | 1261 | 1261 | 12693 | 11786 |
| Drosophila melanogaster | 9379 | 7810 | 1569 | 566 | 566 | 8346 | 7846 |
Statistics of mapping CROGIDs into Gene IDs. Columns 2–4 show the total number of CROGIDs considered, the number that could be directly mapped to GeneIDs and the number of `orphans' that are not associated with a Gene ID in the iRefIndex file. Columns 5 and 6 show the number of CROGIDs additionally mapped to GeneIDs, while the last two columns show the final number of CROGIDs accepted and the corresponding number of Gene IDs. It is possible for a CROGID to map to multiple Gene IDs (if multiple genes encode the same protein sequence) as well as for multiple CROGIDs to map to a single GeneID (if our additional mapping links them to the same gene).
Deflating spoke-expanded complexes
| Species | Publications | Pairs | Complexes | |||||
|---|---|---|---|---|---|---|---|---|
| Initial | Remaining | C | G | R | A | N | ||
| Saccharomyces cerevisiae | 3924 | 118 819 | 28 643 | 7729 | 323 | 5384 | 3190 | 1311 |
| Homo sapiens | 10 317 | 56 111 | 35 650 | 8382 | 181 | 1143 | 1443 | 304 |
| Drosophila melanogaster | 398 | 1722 | 1053 | 220 | 16 | 82 | 33 | 3 |
Shown are the numbers of complexes obtained by deflating binary interactions with affinity chromatography (or related) as experimental method. Types of complexes are indicated by one-letter codes described in Table 1. The counts of pairs shown include those from publications with fewer than three interactions (per database), which could never be deflated into complexes.
Final consolidated data sets
| Species | Publications | Input pairs | Consolidated | Conflicts | ||||
|---|---|---|---|---|---|---|---|---|
| Biochem | Other | Complexes | Directed | Undirected | Resolvable | Unresolvable | ||
| Saccharomyces cerevisiae | 6303 | 5780 | 119 329 | 10 778 | 5525 | 63 648 | 19 344 | 454 |
| Homo sapiens | 22 660 | 2446 | 199 094 | 6483 | 2042 | 85 480 | 26 478 | 1333 |
| Drosophila melanogaster | 564 | 51 | 111 862 | 227 | 33 | 27 981 | 19 430 | 11 |
For each species, shown are the numbers of input pairs (input complexes are those from Table 4), classified as either biochemical reactions (potentially directed) or others; also shown are the final numbers of consolidated interactions (classified as complexes, directed or undirected). The `other' column accounts only for those interactions that were not deflated into complexes in Phase II. The last two columns show the total numbers of resolvable and unresolvable conflicts between consolidated interactions. An unresolvable conflict is an instance where two consolidated interactions, originated from the same publication, are reported using incompatible experimental detection method labels by different databases. A resolvable conflict is the case where source interactions within a single consolidated interaction have different (but compatible) experimental detection method labels.
We chose to standardize proteins using NCBI Gene identifiers rather than the iRefIndex-provided canonical IDs (CROGIDs) for several reasons. NCBI Gene records not only associate each gene with a set of reference sequences, but also include a wealth of additional data (e.g. list of synonyms) and links to other databases such as Gene Ontology (33) that are important when using the interaction data set in practice. In addition, Gene records are regularly updated and their status evaluated based on new evidence. Thus, a gene record may be split into several new records or marked as obsolete if it corresponds to an open reading frame (ORF) that is known not to produce a protein. For network analysis applications, it is desirable that only the proteins actually expressed in the cell are represented in the network and hence the gene status provided by NCBI Gene is a valuable filtering criterion. Our results in yeast (Table 3) support this premise: most CROGIDs without Gene ID are associated with sequences derived from ORFs that were subsequently declassified as genes. However, CROGIDs do have one advantage over NCBI Gene IDs in that they are protein-based and hence identical protein products of several genes (like histones) are clustered together.
There are several reasons that our algorithm was able to introduce many additional associations of CROGIDs to Gene IDs. First, iRefIndex only provides mappings to Gene IDs for interactors that have a sequence that exactly matches a sequence in an NCBI RefSeq record (Ian Donaldson, private communication). By a case-by-case examination of some orphaned yeast sequences that could be mapped to Gene ID, we found that they were orphans because they differed in one or two amino acids from that protein's reference representative in RefSeq but were not clustered with that representative's Gene record. Additional mappings can be found through database cross-reference from a Uniprot record pointing to a Gene ID. The iRefIndex canonicalization procedure captures some of these associations in the mappings.txt file but they are not available in the main iRefIndex MITAB files. We have found (Supplementary Table 5) that some CROGIDs (mostly in human) can be additionally mapped by using this information in the mappings.txt file. Notably, ppiTrim accesses a more recent version of Uniprot then iRefIndex and is thus able to find more mappings by accessing Uniprot cross-references directly. Finally, there is a substantial number of Uniprot records that do not have a cross-reference to NCBI Gene but can be linked to a Gene record through their canonical gene names. This last approach can be suggested as an improvement for iRefIndex canonicalization processing.
Around 10% of CROGIDs could not be mapped to Gene IDs even after processing with ppiTrim algorithms. A few interactors (Supplementary Table 5) have only PDB accessions as their primary IDs since their interactions were derived from crystal structures. In such cases, often only partial sequences of participating proteins are available. These partial sequences cannot be fully matched to any Uniprot or RefSeq record and hence are assigned a separate ID. Hence, an improvement for our procedure, that would account for this case as well as for those unmapped proteins that differ from canonical sequences only by few amino acids, would be to use direct sequence comparison to find the closest valid reference sequence. This task may not be technically difficult (a similar procedure was applied by Alves et al. (34) to construct protein databases for mass spectrometry data analysis) but is beyond the scope of ppiTrim, which is intended as a relatively short standalone script. In our opinion, such additional mappings would best be performed at the level of reference sequence databases such as Uniprot or RefSeq, which contain the curator expertise to resolve ambiguous cases.
Protein complexes obtained through chromatography techniques provide information complementary to direct binary interactions. While it is often difficult to determine the exact layout of within-complex pairwise interactions, an identification of an association of several proteins using mass spectroscopy is an evidence for in vivo existence of that association. Unfortunately, in spite of its great importance, the currently available information within iRefIndex is deficient because of different treatments of complexes by different source databases. Our results (Table 4) show that the apparently inflated complexity of interaction data sets can be substantially reduced by attempting to collapse spoke-expanded complexes. For yeast, this results in almost three-quarters reduction of the number of candidate interactions. The majority of new complexes falls into ‘G’ and ‘R’ categories, which can be considered most reliable. For the human data set, reduction is small as a proportion although in absolute terms the number of new complexes is over 3000. The fruitfly data set did not contain many candidate interactions or complexes and hence not many new complexes were obtained.
In general, it is difficult to assess whether newly generated complexes from ‘A’ and ‘N’ categories are biologically justified, that is, whether they represent a functional entity. If a bait and its preys genuinely originate from a single experiment, they definitely form a physical association that may be a part of or an entire functional complex. Since ppiTrim preserves the experimental role labels and the original interaction identifiers, little information is lost by deflating such associations into a single record. On the other hand, for some publications, especially those involving experiments with ubiquitin-like proteins as bait, each bait–prey association may represent a separate experiment and it does not substantiate that different prey proteins may be co-present in the cell. For example, BioGRID provides 158 physical associations from the paper by Hannich et al. (35), each involving the yeast Smt3p (SUMO, a ubiquitin-like) protein as a bait. In this case, it is not true that all the involved preys together form a large complex with the bait. ppiTrim avoids this particular case by not deflating potentially too large complexes (the maximum deflated complex size is tunable by the user with the default of 120 proteins), but one can assume that some of deflated ‘complexes’ do not exist in vivo.
To more closely investigate the fidelity of generated complexes, we randomly sampled 25 ‘A’ and ‘N’ deflated yeast complexes from the final output of ppiTrim and examined their original publications. Out of these 25 complexes, 15 originated from high-throughput publications [mostly Gavin et al. (31) and Krogan et al. (32) — Supplementary Table 6], while 10 came from small experiments (Supplementary Table 7). In all high-throughput cases, the deflated complex represents a true experimental association. In the cases when authors present their own derived complexes, which in many cases can be found separately under the ‘C’ category, our deflated complexes form parts of larger derived complexes. Indeed, such derived complexes are obtained by assembling the results of several bait–prey experiments, each of which forms a single deflated complex. The results are more varied for low-throughput publications. In most cases, deflated complexes clearly correspond to functional complexes, although it is sometimes difficult to fully relate author's conclusions with their reported results. In two cases, the inferred association is incorrect due to curation errors in the original database. We have also found a single case where the publication authors directly state that proteins in a deflated complex do not form a stable complex.
While our sample is extremely small, it does indicate several issues arising from deflation of bait–prey relationships. In most cases, deflated complexes form parts of what are believed to be functional complexes. It appears that curation errors or ambiguities may be a more significant source of wrongly inferred associations than our main assumption that a bait with several preys in a single publication represents a single unit. Overall, we feel that the benefits from reduction of interactome complexity outweigh the disadvantages from potentially over deflating interactions. The best way to solve the problem of different representations of protein complexes would be at the level of source databases (BioGRID in particular), by re-examining the original publications. Our complexes from the ‘R’ category, where deflated complexes fully agree with an annotated complex from a different database, could serve as a guide in this case.
Overall, our processing significantly reduced the number of interactions within each of the three data sets considered (Table 5). This indicates a significant redundancy, particularly for protein complexes, original and deflated (compare Table 4 with Table 5), and for binary interactions. The directed interactions (biochemical reactions) are relatively rarer and largely non-redundant at this stage. Given their importance in elucidating biological function, the directed interactions are expected to be discovered more fully with time. However, one should note that PSI-MI format can only represent a static relationship among a set of physical entities involved in the same event, but cannot actually represent two sides of a reaction e.g. . Certain pairs of PSI-MI biological role terms can be combined to represent interaction direction e.g. enzyme and enzyme target, but these are weak compared to the rich ways that pathway databases like Reactome (36) represent events.
To demonstrate the utility of our conflict resolution method, we present the counts for resolvable and unresolvable conflicts in Table 5. Resolvable conflicts significantly outnumber the unresolvable ones. Examining the most common examples of resolvable conflicts (Supplementary Table 8), one can see that a majority of them indeed represent the same experiment. Possible exceptions are human interactions annotated by HPRD, which have ambiguous detection method labels. To address this and similar problems, ppiTrim provides the maxsources confidence score (Supplementary Table 1), which is an estimate of the maximal number of independent experiments contributing to a consolidated interaction. An interesting example of a resolvable conflict in Supplementary Table 8 is the 444 instances of a consolidated interaction containing source interactions with detection method labels MI:0004 (affinity chromatography technology), MI:0007 (anti-tag coimmunoprecipitation), and MI:0676 (tandem affinity purification). This case is very similar to the one described in Figure 2: the last two terms are incompatible but the first resolves the conflict as the finest consistent term.
Upon closer examination of the few unresolvable conflicts (Table 6), it can be seen that most common conflicts arise as instances of few specific labeling disagreements between databases. In many cases, such disagreements arise from using different sub-terms of affinity chromatography (Figure 2) and can be resolved by assigning a more general term consistent with both conflicting terms. In many other cases, the conflicts are due to BioGRID internally using a more restricted detection method vocabulary than the IMEx databases (DIP, IntAct and MINT). However, in some rare cases, an unresolvable conflict arises when different databases annotate different experiments from the same publication. For example, each of DIP, BioGRID and IntAct report several raw interactions from the paper by Blaiseau and Thomas (37) (pubmed:9799240), where yeast Met4p protein interacts with each of Met28p, Met31p and Met32p in binary interactions. The paper reports several experiments using different techniques including northern blotting, yeast two-hybrid and electrophoretic mobility shift assays. For the interaction between Met4p and Met28p, BioGRID and IntAct report only MI:0018 (yeast two-hybrid) method, while DIP reports only MI:0404 (comigration in non-denaturing gel electrophoresis), resulting in unresolvable conflict. Hence, in this case, each database on its own provides incomplete evidence for this interaction.
Most common interaction detection method PSI-MI term conflicts
| Term A | Sources A | Term B | Sources B | Counts |
|---|---|---|---|---|
| MI:0007 (anti-tag coimmunoprecipitation) | M | MI:0676 (tandem affinity purification) | DI | 132 |
| MI:0004 (affinity chromatography) | B | MI:0363 (inferred by author) | I | 60 |
| MI:0018 (two hybrid) | DIMN | MI:0096 (pull down) | BI | 43 |
| MI:0071 (molecular sieving) | DIN | MI:0096 (pull down) | B | 32 |
| MI:0030 (cross linking study) | DIMN | MI:0096 (pull down) | B | 22 |
| MI:0007 (anti-tag coimmunoprecipitation) | IM | MI:0676 (tandem affinity purification) | DI | 1227 |
| MI:0018 (two hybrid) | BDHIM | MI:0096 (pull down) | BM | 17 |
| MI:0096 (pull down) | B | MI:0107 (surface plasmon resonance) | DM | 6 |
| MI:0008 (array technology) | I | MI:0049 (filter binding) | M | 5 |
| MI:0019 (coimmunoprecipitation) | IM | MI:0096 (pull down) | BI | 5 |
Top five most common interaction detection method PSI-MI term unresolvable conflicts for yeast (top) and human (bottom) data sets are shown. Source databases are indicated by one-letter codes B (BioGRID), D (DIP), I (IntAct), H (HPRD), M (MINT) and P (MPPI).
The ppiTrim algorithms work best if accurate and fully populated fields for interaction detection method, publication and interaction type are available in its input data set. This requirement is mostly fulfilled. Nevertheless, we have noticed two minor inconsistencies. The first, which will be fixed in a subsequent release of iRefIndex (Ian Donaldson, private communication), involves the PSI-MI labels for interaction detection method for CORUM interactions and complexes. These are missing from iRefIndex although they are present in the original CORUM source files. The second issue concerns missing or invalid Pubmed IDs for certain interactions. We found that a number of interactions with missing Pubmed IDs come from MINT. Upon inspection of the original MINT files, we discovered that in many cases MINT supplies a Digital Object Identifier (DOI) for a publication as its identifier instead of a Pubmed ID (although the corresponding Pubmed ID can be obtained from the MINT web interface). To ensure consistency with other source databases within iRefIndex, it would be desirable to have the Pubmed IDs available for these interactions as well.
In this article, we have identified the tasks needed for using combined interaction data sets provided by iRefIndex as a basis for construction of reference networks and developed a script to process them into consistent consolidated data sets. We see ppiTrim as answering a temporary need for a consolidated database and hope that most of the issues that required processing will be eventually fixed in upstream databases and distributed through IMEx consortium. At this stage we have not addressed the issue of quality of interactions although such information is available in some databases for some publications (23). Utilizing the quality information in consolidating data sets demands a universal data-quality measure that is not yet existent.
Funding
This work was supported by the Intramural Research Program of the National Library of Medicine at the National Institutes of Health. Funding for open access charge: the National Institutes of Health.
Conflict of interest. None declared.
Acknowledgements
We thank Dr Donaldson for his critical reading of this manuscript and for providing us with the proprietary version of iRefIndex 7.0 data set, which was used for initial development of ppiTrim.
