


Abstract
RegulonDB provides curated information on the transcriptional regulatory network of Escherichia coli and contains both experimental data and computationally predicted objects. To account for the heterogeneity of these data, we introduced in version 6.0, a two-tier rating system for the strength of evidence, classifying evidence as either ‘weak’ or ‘strong’ (Gama-Castro,S., Jimenez-Jacinto,V., Peralta-Gil,M. et al. RegulonDB (Version 6.0): gene regulation model of Escherichia Coli K-12 beyond transcription, active (experimental) annotated promoters and textpresso navigation. Nucleic Acids Res., 2008;36:D120–D124.). We now add to our classification scheme the classification of high-throughput evidence, including chromatin immunoprecipitation (ChIP) and RNA-seq technologies. To integrate these data into RegulonDB, we present two strategies for the evaluation of confidence, statistical validation and independent cross-validation. Statistical validation involves verification of ChIP data for transcription factor-binding sites, using tools for motif discovery and quality assessment of the discovered matrices. Independent cross-validation combines independent evidence with the intention to mutually exclude false positives. Both statistical validation and cross-validation allow to upgrade subsets of data that are supported by weak evidence to a higher confidence level. Likewise, cross-validation of strong confidence data extends our two-tier rating system to a three-tier system by introducing a third confidence score ‘confirmed’.
Database URL:http://regulondb.ccg.unam.mx/
Introduction
We have for years gathered pieces of knowledge about regulation of gene expression in Escherichia coli K12, essentially at the level of transcription initiation (1). Detailed information from original scientific literature about transcription factors (TFs), promoters, allosteric regulation of RNA polymerase (RNAP), transcription units (TUs) and operon structure, small RNAs, riboswitches and regulatory interactions, is available in RegulonDB (1), as well as in EcoCyc (2). Our aim has been to sort out and display this knowledge in a clear and comprehensive fashion for the scientific community. Most of the data accumulated in these databases have been derived from classical molecular genetics wet-laboratory experiments of the pre-genomic era and extracted from peer-reviewed papers by manual curation. Now, with the onset of the genomic era and the concomitant progress in bioinformatics, results derived from high-throughput (HT) technologies and computational predictions, which produce a flood of new data, have also been added to the databases. The integration of data of diverse origins raises a big challenge, since the level of confidence associated with individual objects varies considerably depending on the type of evidence and methodology used. Thus, we are currently facing the danger of contaminating the solid and reliable data obtained by traditionally single-object type of experiments, with a deluge of potentially low-quality data derived from computational predictions and HT methods.
A possible solution is the assignment of confidence scores to individual objects. This allows the user to capture at a glance the reliability of data and filter out high-quality data from that with lower confidence scores. For instance, in NeXtProt, a database of human proteins, a three-tier confidence score describes the quality of data, termed gold, silver or bronze, where bronze is not annotated (3). Similarly, in YeTFaSCo, a database for TF motifs from Saccharomyces cerevisiae, low, middle or high confidence scores are assigned to the objects (4). The criteria to generate such confidence scores vary from database to database; some evaluate the confidence by manual expert curation, whereas others use a detailed scoring system. For instance, MINT and IntAct, two databases for protein–protein interactions, use weighted scoring systems (5,6). MINT integrates weighted criteria, such as the type of experiment, the number of independent types of evidence or recognition/trust of the scientific community, which is a measure of the number of citations (6). IntAct evaluates the type of experiment as well as the type of detected interaction in a cumulative fashion (5).
In RegulonDB, we have introduced in version 6.0 a two-tier rating system for the strength of evidence (7), classifying evidence as either ‘weak’ or ‘strong’. That is, we rate the reliability of the data as a function of the experiment supporting the conclusion. For example, in the case of protein–DNA interactions, strong evidence is assigned to experiments that directly show such interactions, as footprinting (FP) with purified proteins, while weak evidence is assigned to gel mobility shift assays using cell extracts, computational predictions or author statements. Strong evidence requires solid physical and or genetic evidence, while weak evidence results from more ambiguous conclusions when alternative explanations or potential false positives are prevalent. In our current rating of classical experiments (see Supplementary Table S1), the evidence score is derived from a single experiment, and the strengths of evidence pointing to the same assertion are not added up, that is, several types of weak evidence do not become a strong one. Our classification is continuously updated and found at http://regulondb.ccg.unam.mx/evidenceClassification.jsp.
In this report, the confidence of HT methods is evaluated in two stages: In the first stage, individual HT methods are classified into weak or strong evidence in a similar way as the classical wet-laboratory experiments and computational methods are currently classified in RegulonDB. Due to the inherent noise and potential experimental artefacts, the majority of HT protocols are classified as weak evidence, with few exceptions (Table 1). In a second stage, we extend the evidence classification and move towards a classification of confidence. To this end, we present an approach to actively evaluate the confidence for HT evidence, which is achieved either by a statistical validation of datasets, or, alternatively, by independent cross-validation. Cross-validation integrates multiple evidence by combining independent types of evidence, with the intention to confirm individual objects and mutually exclude false positives. Both statistical validation and cross-validation allow to upgrade subsets of data that are supported by weak evidence to a higher confidence level. Moreover, cross-validation of strong confidence data extends our two-tier rating system to a three-tier system by introducing a third confidence score, ‘confirmed’.
Evidence classification of HT methods
| Evidence code in RegulonDB | ||
|---|---|---|
| 1. TSSs | ||
| Strong evidence | Identification of TSSs using at least two different strategies of enrichment for primary transcripts, consistent biological replicates | RS-EPT-CBR |
| Identification of TSSs of ncRNA, using at least two different strategies of enrichment for primary transcripts, consistent biological replicates, and evidence for a non-coding gene | RS-EPT-ENCG-CBR | |
| Weak evidence | All other RNA-seq protocols | RS |
| 2. Regulatory interactions | ||
| Strong evidence | ChIP analysis and statistical validation of TF-binding sites | CHIP-SV |
| Weak evidence | ChIP analysis; example: ChIP-chip and ChIP-seq | CHIP |
| Gene expression analysis using RNA-seq or microarray analysis | GEA | |
| Genomic SELEX (systematic evolution of ligands by exponential enrichment) | GSELEX | |
| ROMA (run-off transcription microarray analysis) | ROMA | |
| 3. TUs | ||
| Strong evidence | Mapping of signal intensities by RNA-seq and evidence for a single gene, consistent biological replicates | MSI-ESG-CBR |
| PET (paired end di-tagging) | PET | |
| Weak evidence | Mapping of signal intensities by microarray analysis or RNA-seq | MSI |
Classification of HT-protocols—transcription start sites
RNA-seq protocols
RNA-seq is a powerful application used to quantitatively analyse transcriptomes. Examples are the comparative analyses of complete sets of RNA transcribed in different growth conditions, the identification of regulons, transcription start sites (TSSs), and TUs (8–18). The basic principle of RNA-seq is the analysis of cDNA libraries by next-generation sequencing technologies, which are obtained by reverse transcription of RNA pools (19–24). This is achieved by a series of consecutive steps: RNA extraction and depletion, reverse transcription into DNA, introduction of adaptor sequences at the 5′- and 3′-ends of the cDNA, PCR amplification of the cDNA library (optional), followed by next-generation sequencing and mapping of the sequence reads into the reference genome. For each step, different protocols have been published, which can be assembled in a modular fashion. As a consequence, RNA-seq protocols exhibit great variability. For instance, protocols differ in the enrichment of RNA, in the construction of the cDNA libraries, and also dependent on whether the analyses aim at the comparative quantification of transcripts, the identification of TSSs or at the analysis of TUs. For quantitative expression analyses, the isolated RNA is fragmented to get an even distribution of reads along the length of the transcripts. In contrast, for the identification of TSSs, that is the identification of primary 5′-ends of transcripts, this step must be omitted.
RNA degradation is a major source of false positives in RNA-seq
The purification and analysis of bacterial mRNA is more challenging than eukaryotic mRNA.
For instance, bacterial mRNA is polycistronic and frequently contains internal initiation and termination sites, resulting in a complex transcriptional profile with overlapping TUs (25). Moreover, isolation of mRNA using oligo-dT selection is not possible since the majority of bacterial RNA lacks poly(A) tails. To remove the abundant ribosomal RNA and increase the rate of mRNA reads, different rRNA depletion methods are required, such as the removal of rRNA by hybridization to rRNA-specific probes (26).
The greatest challenge, however, is the instability of prokaryotic mRNA, which exhibits an average half-life of ∼3–8 min (27,28), ranging from less than a minute to half an hour, resulting in a large fraction of processed RNA molecules. Therefore, the unambiguous identification of TSSs requires an efficient measure to distinguish the 5′-ends of such processed or degraded mRNA ends from those of genuine transcripts.
The enrichment for 5′-triphosphate ends reduces detection of RNA-degradation products
Degradation intermediates and processed RNA products can be distinguished from primary transcripts by means of the chemical nature of their 5′-ends, since the latter transcripts carry 5′-triphosphate ends (5′-PPP) (11,12), while processed and degraded RNA carries a 5′-monophosphate (5′-P). This can be exploited to specifically enrich for primary transcripts. A strategy utilizes 5′-dependent terminator exonuclease (TEX) that degrades RNA carrying a 5′-P end, while RNA carrying 5′-PPP ends are not substrates of this enzyme and therefore are not degraded. In dRNA-seq (differential RNA-seq), reads derived from a TEX-treated library are compared with an untreated library to discriminate between primary and processed 5′-ends (11,12). Comparison of TEX-treated RNA libraries with untreated libraries has demonstrated that a large proportion of RNA libraries is degraded or processed RNA (12). As a consequence, read coverages obtained by dRNA-seq are shifted towards the 5′-end, with peak profiles raising at the position of the TSSs (11). However, the presence of the pyrophosphohydrolase activity in bacterial genomes, coded by the rppH gene in E. coli, which converts 5′-PPP ends into 5′-P ends, masks genuine TSSs. Therefore, the direct subtraction of the 5′-P ends is not an option.
The usefulness of the dRNA-seq protocol has been shown in a recent analysis of the Synechocystis transcriptome. Of the 64 TSS that had previously been identified by classical transcription initiation mapping, 44 were detected in this study and confirmed by the published results (16). In addition to the use of TEX, other protocols can be used for the enrichment of 5′-PPP ends. For instance, the ligation of biotinylated adapters to processed RNAs carrying a 5′-P end allows their removal using magnetic streptavidin (1). Another method is 5′-tagRACE that involves the differential tagging of 5′-P and 5′-PPP ends (29).
Due to the inherent noisy nature of the transcriptome, the random errors of the experiments due to bias in library construction, amplification and sequencing efficiency (30–33), and the fact that it is not straightforward to discriminate between primary from processed transcripts, high reproducibility needs to be fulfilled in order to be confident of the TSSs assignment. Therefore, classification as strong evidence requires that the data are validated by multiple biological and technical replicates, which may be analysed either within the same study or even better, independent studies. In addition, data have to be supported by at least two different enrichment methodologies, for instance a combination of dRNA-seq and the differential ligation of adaptors to processed transcripts (Table 1).
An even more critical case is the identification of TSSs of non-coding RNAs (ncRNAs). Such RNAs lack an apparent open reading frame. Therefore, their corresponding TUs escape detection by conventional sequence analysis. Identification of ncRNAs by RNA-seq is particularly prone to false-positive results, that may occur due to the spurious synthesis of second strand cDNA, or residual genomic DNA contaminating the RNA pool (9,34), as well as ‘false priming’ (35,36), caused by priming of the reverse transcription reaction in hairpin structures in the RNA or other, partially complementary RNA molecules. In addition, it has been reported that a substantial fraction of the detected transcripts could be the result of spurious transcription initiation events at promoter-like sequences (37,38). Therefore, the identification of TSSs of ncRNA by the above combination of different enrichment strategies requires verification and is only classified as strong evidence, if the ncRNA is validated by additional experimental evidence, such as northern blots or quantitative PCR (39,40) (Table 1).
RNA-seq protocols without enrichment for 5′-PPP ends are classified as weak evidence
In addition to the enrichment for primary transcripts, other measures to minimize false TSSs have been employed. These include the use of cutoff values for sequence counts (41,42) or restricting the location of potential TSSs to certain windows within 5′-untranslated regions. Cutoff values are claimed to be efficient measures to reduce the background noise of read starts.
However, these are not suited to reduce the number of false positives derived from non-random RNA degradation (43), stochastic transcriptional events (10) and PCR biases that arise during library construction. Non-random RNA degradation is in part due to sequence preferences for AU-rich regions, as shown for RNAse E, as well as hotspots for RNAses due to secondary structure elements of the RNA (43–45). Similarly, restricting the location of TSSs to certain windows within the 5′-untranslated region of a gene (41) does enrich for bona fide TSSs, but does not efficiently exclude RNA degradation products. In addition, this strategy overlooks genuine TSSs located within genes and in antisense orientation. A recently described transcriptome sequencing approach is flow cell reverse transcription sequencing (FRT-seq) (46), in which RNA is reverse transcribed on the flow cell without further amplification of the cDNA. FRT-seq avoids biases that are introduced at the amplification step, but like RNA-seq, it does not discriminate sufficiently between primary and processed or degraded transcripts. Accordingly, we rate these protocols as weak evidence (Table 1).
Classification of HT protocols—TUs
Identification of TUs by RNA-seq and microarrays
HT technologies assign TUs if the expression levels of neighboring genes correlate. Using microarrays (47–50) or RNA-seq analyses (11,41,42), TUs can be inferred by mapping the hybridization intensities or peak values onto the bacterial genome. Operons are assigned if the continuous coverage extends into one or more co-directional neighbouring genes, including the intergenic regions. Evaluation of expression levels is frequently combined with computational approaches for the prediction of operons, which integrate, for instance, intergenic distances or the location of promoter and TF-binding sites (TFBSs) (51). However, the assignment of TUs on the basis of expression correlation has several limitations. For instance, signal intensities might not correlate with a particular TU if additional transcripts, driven by internal promoters, overlap the TU. Furthermore, differentiation between co-transcription and co-regulation of neighbouring genes that are expressed under similar growth conditions is ambiguous.
Another limitation is that the sequence coverage frequently varies considerably over the length of a transcript. Such non-uniform read distributions occur during the random hexamer priming and PCR amplification step, due to positional nucleotide biases, GC content (31,52), and transcript length biases (53,54). Depending on the fragmentation method employed, read coverages are differently biased towards the transcript ends (23,55). Coverage is more uniform within the transcript if the RNA is fragmented prior to reverse transcription, but relatively depleted for both 5′- and 3′-ends, while fragmentation of the cDNA creates biases towards the 3′-end (23).
Like RNA-seq, microarray analyses suffer from limitations, such as measurement noise, biases due to systematic variations between experimental conditions or sample handling, labelling biases and preferential amplification due to the variable hybridization strength of the probe–target pairs (56–58). Microarray analyses also suffer from signal saturation errors and exhibit a much more narrow dynamic range when compared with RNA-seq (59).
Therefore, the identification of TUs on the basis of uniform levels of signal intensities, using either RNA-seq or microarray analysis, is ambiguous and classified as weak evidence with two exceptions. One exception is the identification of a monocistronic TU that is flanked by neighbouring genes transcribed in the opposite direction, which is classified as strong evidence (Table 1). The other exception is the detection of cotranscribed genes in the same mRNA molecule using paired-end RNA-seq with different insert sizes (1,60). This method provides strong evidence that both RNA ends are derived from the same transcript. As is the case for other methods that are classified as strong evidence, this requires in addition validation by consistent biological replicates (Table 1).
Classification of HT protocols—regulatory interactions
Evidence for regulatory interactions derived from gene expression analysis
Transcriptome analysis by RNA-seq or microarrays may also provide evidence for regulatory binding sites (61–64), based on a comparative analysis of the expression of potential target genes, and dependent on changes in the activity of the TF. For instance, in classical experimentation, a commonly used technique is the analysis of a promoter-lacZ fusion in response to the deletion, over-expression or mutation of the TF. HT transcriptional profiling monitors the entire cascade of changes in gene expression, as a response to the deletion or overexpression of a regulatory protein. However, these responses include indirect effects, such as the regulation by additional TFs, sRNAs, as well as effects due to metabolic changes induced by the altered gene expression. Therefore, as is the case for classical gene expression analyses, the identification of regulatory binding sites by global transcriptome analyses is classified as weak evidence (Table 1).
An alternative method used for the characterization of regulatory networks of TFs and sigma factors is run-off transcription-microarray analysis (ROMA) (65–67). ROMA resembles a HT in vitro transcription assay, using purified RNAP, regulatory proteins and a genomic DNA pool as the template. The resulting mRNA pool is subsequently reverse transcribed into cDNA and analysed on microarrays, relative to the transcripts generated in the absence of the regulatory protein. In contrast to in vivo transcriptional profiling, ROMA avoids false positives stemming from indirect regulation and offers an advantage in the detection of short-lived mRNA transcripts. However, ROMA includes other sources of false positives, most importantly read-through transcripts into adjacent genes due to inefficient transcription termination in vitro, as well as ambiguities derived from impure protein preparation or the microarray analysis as such (65). Therefore, ROMA is classified as weak evidence (Table 1).
Use of chromatin immunoprecipitation technology for the identification of TFBSs
The chromatin immunoprecipitation (ChIP) technology allows probing protein–DNA interactions inside living cells and has been widely used to characterize regulatory transcriptional networks under various physiological conditions (68–71). Briefly, proteins that interact with DNA are covalently crosslinked in vivo to their target sites with formaldehyde. Cells are subsequently lysed and the chromatin is fragmented by sonication or enzymatic treatment. Next, DNA fragments carrying crosslinked protein are co-immunoprecipitated using a highly specific antibody directed against the protein of interest. After reversal of the crosslinking, the enriched DNA fragments are analysed either by hybridization to microarrays, designed as low- or high-density tiling arrays (ChIP-on-chip or ChIP-chip), or by HT sequencing (ChIP-seq), followed by a computational analysis of the sequence data, which involves a statistical analysis for quality control and normalization of the data, the identification of significantly enriched regions and the identification of binding motifs.
Resolution in the initial mapping of the binding regions is much higher for ChIP-seq when compared with ChIP-chip. In ChIP-chip, resolution depends on several factors, such as the size of the fragments generated by shearing, or the density of the tiling arrays, and usually is within a range of 300–500 bp (72), while resolution in ChIP-seq is up to a single base pair with reduced noise and a broader dynamic range (73). For these reasons and due to the rapid development of next-generation sequencing techniques, ChIP-seq is rapidly replacing the analysis by microarrays.
The DNA library obtained by co-immunoprecipitation is enriched in DNA fragments carrying the desired binding regions, but it is not pure. The challenge in ChIP technology is to identify the DNA fragments carrying the bona fide binding sites in a large background, a source of systematic and stochastic noise. False positives can occur at all three basic steps in ChIP technology: (i) the preparation of the DNA pool carrying the potential binding sites, (ii) the characterization of the DNA fragments by hybridization to the microarrays or HT sequencing and (iii) the computational analysis including mapping of the potential binding regions to the genome, peak detection and sequence motif analysis. For instance, false positives derived from the preparation of the DNA pool can be due to non-specific interactions of the protein of interest with DNA or other DNA-binding proteins, or due to cross-reactivity of the antibody. In addition, systematic variations between experimental conditions, such as sample handling, or biases introduced during labelling or amplification steps, such as a GC bias, give rise to false positives at the peak-calling step (31,68,73,74). High background noise has been reported to result from complementary sequences or non-unique gene loci on the chromosome as well as insufficient RNase treatment (75). In addition, it has been reported that false positives can be caused by large protein–DNA complexes, which preferentially form at highly transcribed regions. Such complexes can survive washing and elution steps due to the incomplete reversion of crosslinking and retention of the complexes in spin columns. These complexes are eluted at a later step under denaturing conditions, resulting in a contamination of the DNA pool (75).
Since as mentioned before the lengths of the enriched sequences vary between 300 to 500 bp, this partial result still requires the computational precise identification of the binding sites. Some of the sequences might be false positives with no TFBSs, whereas other sequences may have binding sites for other cofactors. In order to control these issues, and for homogeneity in the evaluation of experiments performed in different laboratories, ideally, the best alternative would be the use of a common computational strategy with well-established programs universally available to the community.
In conclusion, even though ChIP technology is a powerful method, it carries several potential pitfalls and is classified as weak evidence (Table 1). However, confidence scores for individual binding sites can be assessed by a standardized statistical analysis to allow a higher classification of strength of evidence for a subset of the data. This is discussed in more detail in sections below.
Use of genomic systematic evolution of ligands by exponential enrichment for the identification of TFBSs
Genomic systematic evolution of ligands by exponential enrichment (SELEX) is a variant of the classic SELEX protocol. Like ChIP technology, it is a powerful technique to identify DNA-binding sites for a TF. Its basic principle is to enrich fragmented genomic DNA (whereas classic SELEX starts with random DNA) in several iterative cycles consisting of the binding reaction, affinity purification of the complexes formed between DNA and the protein of interest, and amplification of the potential target regions (76–79). One major difference between the ChIP and the SELEX technology is that ChIP is directed towards the identification of sites that are bound in vivo under specific growth conditions, while SELEX identifies binding sites which are bound in an in vitro reaction. In SELEX, false positives can originate from aggregates or unspecific interactions with the affinity matrix. The selection for such nonspecific-bound DNA fragments depends strongly on the number of the iterative cycles (78). In addition, the binding conditions, for instance ionic strength or pH, as well as the high local concentration of protein–DNA complexes upon enrichment on the affinity matrix, might not reflect physiological conditions. Therefore, genomic SELEX as such is classified as weak evidence (Table 1). Classification as strong evidence requires additional, independent evidence, that the identified sites function in vivo (see section for cross-validation).
Statistical validation of ChIP data and consistency with position weight matrices generated from classic experimental evidence
Regulatory binding sites exhibit characteristic sequence patterns, which are commonly represented as sequence logos or position weight matrices (PWMs) and describe the specificity of a DNA-binding protein (80,81). Such PWMs represent a weighted average of aligned sequences and provide the basis for the genome-wide computational predictions of TFBSs (82,83). The sequence motif analysis serves to pinpoint the exact location of binding sites in potential target regions obtained by ChIP. This can be achieved either by scanning for a known sequence motif or by performing a de novo motif analysis (84,85). Moreover, binding sites identified by such a sequence motif analysis come with a statistical confidence score and/or P-value. This offers the possibility to rate the confidence levels of the identified objects according to these values and, using a stringent threshold value, validates subsets of the identified binding sites as strong evidence.
For consistency, such an approach requires the use of defined algorithms and criteria. Here, we present an approach to evaluate the confidence levels of TFBSs using the tools, ‘matrix-quality’ (86,87), ‘peak-motifs’ (88), ‘footprint-discovery’ (89) and ‘matrix-scan’ (90), that belong to the software suite regulatory sequence analysis tools (90). These tools are publicly available at http://rsat.ulb.ac.be/, with the adequate documentation for their utilization.
To identify sites with high confidence, we first obtain a PWM using peak-motifs or footprint discovery. Peak-motifs facilitates the discovery of binding motifs using a combination of several algorithms at a time, and it detects not only the strongest motif but also secondary ones, providing valuable information concerning cofactors, and mechanism of function for TFs (88). The major difference between using this or other previously proposed algorithms lays in its efficiency. The program is significantly faster than other comparable algorithms and allows motif discovery in full-size ChIP datasets (88). Thus, peak-motifs allow to build PWMs from a set of known binding sites, or to perform a de novo motif analysis using the raw ChIP data as an input. The discovered motif is compared with the annotated matrices in RegulonDB, to detect whether they correspond to the annotated one for the TF of the ChIP experiment. Alternatively, a multi-genome approach is useful in cases where only a few binding sites are known for a given TF and there is none annotated matrix. Using the program ‘footprint-discovery’, conserved motifs in promoter regions of orthologous target genes (phylogenetic footprints) can be detected at different taxonomical levels of E. coli (86,89).
Next, the quality of the discovered PWMs, that is the discriminative power of the matrices, can be evaluated by using the program matrix-quality. This program analyses matrices by comparing the theoretical and empirical weight score distributions for each PWM in a group of sequences (86). It can also be used to evaluate the quality of raw datasets derived from ChIP experiments, that is, to evaluate the level of enrichment for putative TFBSs in different collections of sequences, for a given PWM (86). The program uses one matrix representing the TF-binding motif and the peak sequences as input. The output will show a graph displaying one curve for the expected enrichment by chance and the observed enrichment in the peaks. These two curves should show a clear difference of enrichment of binding sites with high scores (86). If there is no enrichment, it can be due to two possibilities: several false positives dilute the collected regions, or the TFBS in that collection is considerably different than the previously reported ones used to build the matrix.
Using the PWM with the best enrichment TFBSs that score above a threshold P-value are identified and localized using matrix-scan. In contrast to aiming at the genome-wide computational prediction of binding sites, our approach for statistical validation requires that the positive predictive value is strongly favoured at the expense of sensitivity. This is important to prevent spurious sites accepted with strong evidence or confidence. We use a P-value of 1e−5 or lower as a stringent cutoff. Binding sites that score above this threshold will be classified as strong evidence, and binding sites, which score below, as weak evidence (Table 1). It is important to note that this approach for evaluating sites produced by ChIP-seq is consistent with the evaluation of the quality of PWMs coming from manual curation (86). That is to say, we are being congruent in assessing evidence for knowledge, irrespective of the methods used to generate it. For a full pipeline application for an experiment of ChIP-chip of PurR sites, see the new RegulonDB paper and Supplementary Material (87).
Classification of multiple evidence and introduction of the new confidence score ‘confirmed’
In the past, we have judged and classified the strength of evidence for single types of evidence. As a consequence, the strength of evidence for a given object or assertion was derived from one experiment, which is the experiment with the highest score. However, in scientific experimental research, an assertion and its degree of confidence are usually derived from a combination of different approaches. Such additional experiments are conducted with two intentions, to confirm or reproduce the assertion on the one hand, and to exclude alternative explanations on the other hand. Reproducibility is a prerequisite, to account for it in HT experiments, we demand the use of biological replicates as well as the use of at least two independent enrichment strategies for the assignment of strong evidence to RNA-seq methods. We now present a strategy to account for the second intention, the exclusion of alternative explanations or false positives, termed ‘independent cross-validation’.
A decrease in the number of false positives is achieved, if false positives can be mutually excluded by evaluating the results of two methods or strategies together, compared with each experiment alone (Figure 1). This requires that the following conditions are met. (i) The two methodologies have to be independent, that is, they should not use common raw materials or common experimental steps. (ii) Both methods have to point to the same object or assertion. Both approaches might, however, analyse different aspects or properties of the assertion. For instance, a promoter can be located by the identification of a TSS or an RNAP-binding site. Cross-validation of TFBSs and promoters requires that the exact location of the object is specified for each individual evidence. For instance, gel mobility shift assays provide evidence for the interaction with a binding region, but the exact location is not determined, and therefore cannot be combined with other evidence for cross-validation of TFBSs. (iii) There must be little overlap in potential false positives or alternative explanations for both independent methodologies. For instance, genuine TSSs mapped by transcription initiation mapping are diluted by false positives derived from RNA processing or degradation. However, these TSSs can be validated by RNAP FP since false positives derived from RNA degradation or processing are excluded by the second experiment. Therefore, if combined, the intersection of both methods should contain TSSs with a higher confidence level than the individual experiments alone. In contrast, the combined evaluation of the following two methodologies does not result in a higher confidence level: To confirm that an activator binds to the 5′-upstream region of a target gene and regulates its expression, it is either possible to analyse in vivo expression of a promoter–reporter gene fusion in a wild-type and mutant background, or to perform gel-mobility-shift assays using cell extracts of wild-type and mutant strains. Here, the alternative explanation for a positive result, which is the indirect regulation of the target gene, is not excluded when evaluating the results of both methods together since it is common to both. (iv) Finally, as a fourth requirement, the sample population needs to be large enough to ensure a low probability for the coincidental identification of a false positive by the two independent methodologies. (v) Cross-validation of HT experiments requires consistent biological replicates.
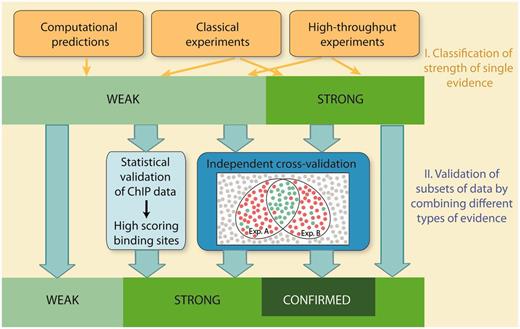
Schematic overview of evaluation of confidence in RegulonDB. Confidence is evaluated in two stages. In the first stage, individual methods are classified into weak or strong strength of evidence. In the second stage, subsets of data are validated by integrating multiple evidence using two strategies, statistical validation and independent cross-validation. Statistical validation is applied for ChIP datasets. It involves the evaluation of both the quality of the dataset and the quality of the discovered PWMs. The analysis validates binding sites, which score above a stringent threshold value. Cross-validation integrates multiple evidence and requires that the types of evidence, that are combined with each other, are independent and mutually exclude false positives. Weak evidence is cross-validated to strong evidence, whereas strong evidence is validated to confirmed evidence.
Using these criteria, we can now define combinations of HT experiments or classical evidence, to allow an upgrade from weak to strong evidence (Table 2). Moreover, it is also possible to cross-validate data, which have been classified as strong evidence. To this end, a third confidence score, designated ‘confirmed’, is introduced. The possible combinations of experiments that allow an upgrade to confirmed confidence are shown in Table 2. By using this approach, we are now able to create a new class of objects or assertions that are annotated with a very high reliability to RegulonDB in a step towards building gold standard sets.
Independent cross-validation of weak and strong evidence
| Cross-validation of weak evidence |
| Regulatory interactions |
| Genomic SELEX, ROMA (run-off transcription-microarray analysis) |
| In vivo gene expression analysis |
| Cross-validation of strong evidence |
| Promoter |
| FP with purified RNA-polymerase |
| In vitro transcription assay using purified proteins |
| Transcription initiation mapping; Examples: 5′-RACE; primer extension; nuclease S1 mapping; RNA-seq data, classified as strong evidence |
| Evidence inferred from SM; Example: Expression analysis when putative promoter element is mutated |
| TFBSs |
| FP using purified protein |
| Evidence inferred from SM; Example: Expression analysis when putative TFBSs are mutated |
| ChIP data, classified as strong evidence; Example: ChIP data, statistical validated |
| Genomic SELEX data, classified as strong evidence; Example: Genomic SELEX, cross-validated by in vivo gene expression analysis |
| TUs |
| Polar mutations which affect transcription of a downstream gene |
| Northern blotting; RNA-seq data classified as strong evidence |
For each object, the types of evidence are given, which can be combined with each other to allow an upgrade to confirmed confidence. Any two methods from different rows can be combined. Types of evidence in the same row cannot be combined with each other. For instance, different protocols for transcription initiation mapping cannot be combined for cross-validation, since these methods use mRNA as the starting material and therefore share a common source of false positives, which is RNA processing or degradation. Similarly, TUs identified by northern blotting cannot be cross-validated by RNA-seq. Cross-validation of TFBSs and promoters requires that the exact location of the object is specified for each individual evidence.
To exemplify this approach, we have cross-validated the evidence for TFBSs of PurR. Shown in Table 3 are the strong types of single evidence from classical experiments, that are supporting the individual binding sites for PurR, FP and evidence derived from a mutational analysis of the TFBSs (SM). In addition, most of these sites are supported by strong evidence derived from the statistical validation of an HT ChIP-chip analysis (87). All three types of evidence, FP, site mutation (SM) analysis and statistical validated ChIP-chip data (CHIP-SV), can be combined for independent cross-validation (Table 2). As a result, 14 out of 23 TFBSs are cross-validated to confirmed evidence, while 9 TFBSs are supported by a single strong evidence and not cross-validated (Table 3).
Independent cross-validation of single types of evidence for PurR-binding sites
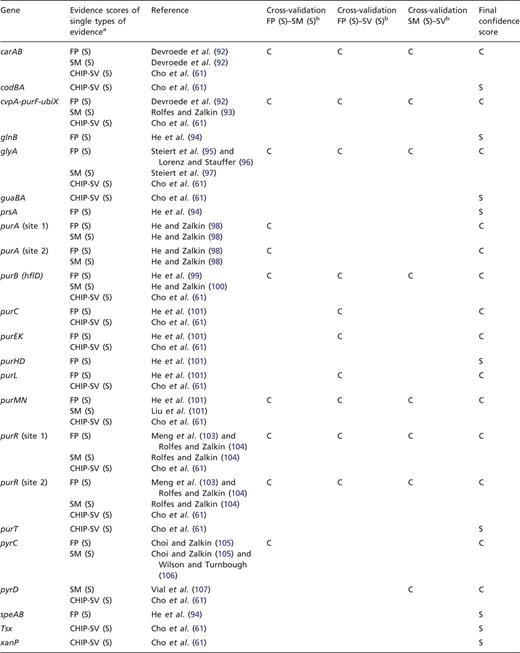 |
aFor each gene or operon, the evidence types that are annotated as strong evidence in RegulonDB are given, as well as the strong evidence derived from the statistical validation of an ChIP-chip analysis of PurR-binding sites (61, 87). bFor independent cross-validation, the three evidence types FP, SM analysis and ChIP-chip data that have been rated as strong evidence by statistical validation (CHIP-SV) (87) are combined pairwise to confirmed evidence.
With the exception of glyA, all of the confirmed binding sites belong to genes involved in the central pathways for the de novo synthesis of purines and pyrimidines (Figure 2), which is in agreement with the role of PurR as the master regulator of these pathways. TFBSs that are supported by strong evidence and not upgraded to confirmed evidence either belong to these pathways, to genes involved in nucleoside or nucleobase uptake (codBA, tsx, and xanP), or nitrogen metabolism (glnB and speA). This demonstrates that independent cross-validation is well suited to identify data that resemble the well-established knowledge of the scientific literature, representing the ‘textbook knowledge’ in RegulonDB.
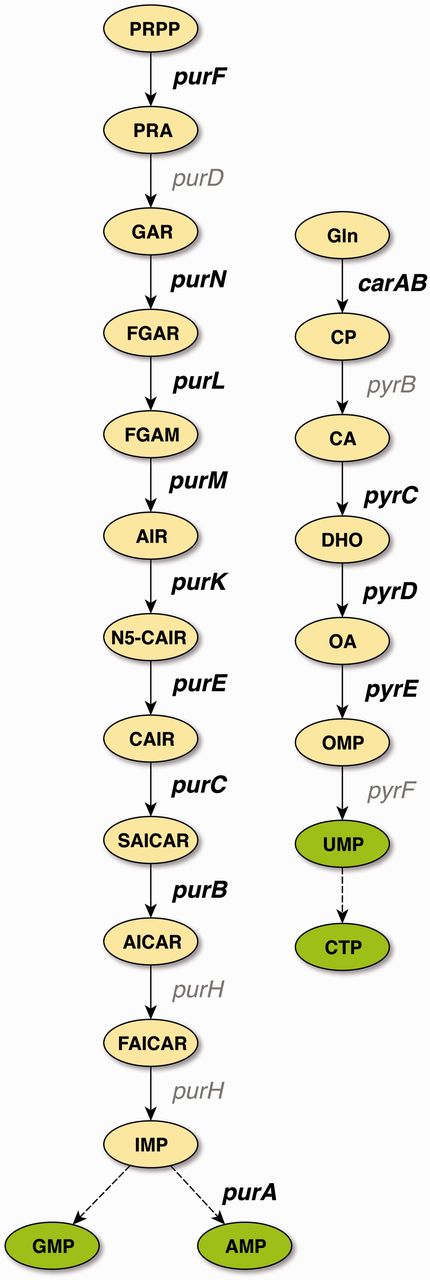
De novo pathways of purine and pyrimidine synthesis in E. coli. PurR is the master regulator for purine (left) and pyrimidine (right) de novo biosynthesis. Genes that carry binding sites that have been cross-validated to confirmed evidence are shown in bold. With the exception of glyA (not shown), all genes that carry binding sites supported by confirmed evidence belong to these two central pathways of nucleotide biosynthesis. Abbreviations: PRPP, 5-phosphoribosyl-1-diphosphate; PRA, 5-phosphoribosylamine; GAR, 5′-phosphoribosyl-1-glycinamide; FGAR, 5′-phosphoribosyl-N-formylglycinamide; FGAM, 5′-phosphoribosyl-N-formylglycinamidine; AIR, 5′-phosphoribosyl-5-aminoimidazole; N5-CAIR, 5′-phosphoribosyl-5-aminoimidazole-N-5-carboxylate; CAIR, 5′-phosphoribosyl-5-aminoimidazole-4-carboxylate; SAICAR, 5′-phosphoribosyl-4-(N-succinocarboxamide)-5-aminoimidazole; AICAR, 5′-phosphoribosyl-4-carboxamide-5-aminoimidazole; FAICAR, 5′-phosphoribosyl-4-carboxamide-5-formamidoimidazole; IMP, inosine 5′-monophosphate; AMP, adenosine 5′-monophosphate; GMP, guanosine 5′-monophosphate; Gln, glutamine; CP, carbamoyl phosphate; CA, carbamoyl aspartate; DHO, dihydroorotate; OA, orotate; OMP, orotidine 5′-monophosphate; UMP, uridine 5(-monophosphate; CTP, cytidine 5(-triphosphate.
Discussion
The data collected in RegulonDB are diverse in two respects. On the one hand, the different types of evidence exhibit a very broad variability in confidence and on the other hand, the objects itself, e.g. TUs, TFBSs or promoters, have different characteristics and are supported by different types of evidence. As a consequence, we need a strategy for confidence assessment that is generally applicable for all kinds of different objects, and such that the strengths of confidence are comparable between the different types of objects.
The criteria presented here follow the same principles of science as applied by wet-laboratory scientists, where data are confirmed by repetitions on the one hand, and by additional experimental strategies to exclude alternative explanations on the other.
The rating of the single evidence is the primary criterion for reliability and provides the foundation of our classification scheme. Validation of the data to upgrade from weak to strong or strong to confirmed evidence requires in addition high congruence, that is confirmation of the data by truly independent methods that reduce alternative explanations for the findings. This approach is superior to a strategy, in which confidence is solely rated according to the number of experiments supporting the assertion, irrespective of the type of evidence. Such a rating system could introduce a bias, due to the weighting of spurious alternative explanations.
It should be pointed out that evidence or confidence scores are always an estimate, not a precise rating. When rating an evidence, we rate the protocol as such, but it is difficult to judge whether for a given experiment the protocol has been properly implemented. This ambiguity pertains also to classical wet-laboratory experiments. For instance, in RegulonDB, a gel mobility shift assay using purified proteins is rated as strong evidence for TFBSs. However, the reliability for such an experiment strongly depends on the conditions, such as salt concentration, pH or protein concentration. Using too high a protein concentration increases the risk for nonspecific interactions or even binding of a different contaminating protein present in the preparation. The judgement, whether such an experiment has been conducted properly or not, is at least in part also the task of the peer-reviewing process for the publication of results.
To judge the confidence level of single types of evidence, the ideal solution would be to precisely assess the success rate of each evidence type, that is, to determine how often an assertion that is derived from a certain evidence is confirmed or disproved by subsequent experiments. However, in scientific publications, an assertion is usually supported by several different experiments which are conducted in parallel to confirm the statement or disprove alternative models. Therefore, each published single evidence is validated to varying extents by the accompanying pieces of evidence and an assessment of the success rate of an individual evidence would actually measure the averaged overall confidence of the published datasets, as well as the additional cited evidence used to support the assertion. For instance, a common method to study the regulation of a target gene by a TF is gene expression analysis, by measuring expression of a fusion between the target promoter and a reporter gene. In RegulonDB, this is classified as weak evidence due to the potential of indirect regulatory mechanisms. In classical experimentation, gene expression analysis is frequently validated by in vitro DNA-binding experiments, which are classified as strong evidence. In fact, all 17 PurR-binding sites that are supported by FP (Table 3) are in addition supported by gene expression analysis, in most cases within the same study. Thus, in an evaluation of the success rate of classical gene expression analysis, this evidence would inherit an apparently strong evidence from the FP experiments. In contrast to these classical experiments, the HT gene expression analysis by Cho et al. (61) finds that the expression of 56 genes or operons is directly or indirectly affected in response to PurR and adenine. This difference in the number of targets detected by classical and HT gene expression analysis demonstrates the potential of detecting indirect regulation, as well as the extent to which classical experiments are verified by additional experiments within each individual study. Therefore, to achieve an adequate rating of single types of evidence, we have to build on our knowledge and expert judgement of direct versus indirect effects and alternative regulatory mechanisms. This will provide the foundation for the overall classification of strength of confidence in RegulonDB.
Our three-tier rating system allows the user to recognize the confidence level of individual data at a glance. To this end, the display of the different types of degrees of confidence has to be clearly visualized. Currently, weak versus strong evidence is visually distinguishable both in RegulonDB and in EcoCyc. For instance, promoters with strong evidence are displayed with a solid line arrow, whereas those with weak evidence are displayed with a dashed-line arrow. This system can be easily extended, by using thick solid lines for confirmed objects.
Another closely related question is, how the different data types, the computational predictions, HT data and classical wet-laboratory experiments, are going to be displayed and made available for users. At present, we filter HT-generated data and only add, for instance ChIP sites that have an identified binding site which occurs within the expected upstream regions close to promoters. In addition, computationally predicted promoters are included within upstream regions only if there is no experimentally determined promoter within the region. These two cases illustrate our role that we can describe as ‘strict guardians’ of the classic paradigm of transcriptional regulation. The advantage of this policy is that the number of less reliable data is kept at a minimum. However, the drawback is that we might be losing valuable information. In fact, we have had situations, where a predicted promoter has been withdrawn due to the experimental identification of a second promoter in the same region, but had to be annotated again later due to the confirmation by additional experiments. Since computational predictions as well as HT data are very valuable data for the scientific community, we definitely need an annotation policy for the display of data of diverse origins (classical experiments, computational and HT data) in an integrated fashion.
Given the criteria here proposed, we consider a better and more useful strategy for the community to expand our ‘downloadable datasets’ that have for years been available in RegulonDB and to offer now a variety of complete datasets including HT-generated datasets in a separate genome browser, with a menu for the user to select which ones to display, such that the data can be toggled in and out on demand, using either the data type or the confidence score as a filter. The HT-generated datasets will previously be marked with our confidence score following the criteria here discussed. The information for any laboratory to submit a dataset is available in RegulonDB.
We are aware that the proposed three-tier system is a logical and consistent expansion of the previous strong and weak assignments we have had for years. This confidence assignment will facilitate the comparison and best integration of the different sources of knowledge of the regulatory network of E. coli. It also facilitates future benchmarking studies for predictive methods as well as for HT studies. These criteria are not unique to a single bacterium, given the common genome organization of regulatory elements and the common experimental challenges, these should be equally applicable to the biocuration and organization of any bacterial regulatory network.
Acknowledgements
We are grateful to Yalbi Balderas for the TF conformation cross-validation discussion, to Stephen Busby for suggesting the introduction of the third confidence level confirmed, and we would also like to thank Alfredo Mendoza for fruitful discussions. We acknowledge César Bonavides-Martínez for his excellent technical support.
Funding
This work was supported by the National Institute of General Medical Sciences of the National Institutes of Health GM071962, by the Consejo Nacional de Ciencia y Tecnología (CONACyT) [CB2008-103686-Q and 179997] and by the Programa de Apoyo a Proyectos de Investigación e Innovación Tecnológica (PAPIIT-UNAM) [IN210810 and IN209312]. Funding for open access charge: National Institutes of Health [GM071962].
Conflict of interest. None declared.
References
Author notes
Citation details: Weiss,V., Medina-Rivera,A., Huerta,A.M., et al. Evidence classification of high-throughput protocols and confidence integration in RegulonDB. Database (2012) Vol. 2012: article ID bas059; doi:10.1093/database/bas059.
