


Abstract
Annotating functional terms with individual domains is essential for understanding the functions of full-length proteins. We describe SDADB, a functional annotation database for structural domains. SDADB provides associations between gene ontology (GO) terms and SCOP domains calculated with an integrated framework. GO annotations are assigned probabilities of being correct, which are estimated with a Bayesian network by taking advantage of structural neighborhood mappings, SCOP-InterPro domain mapping information, position-specific scoring matrices (PSSMs) and sequence homolog features, with the most substantial contribution coming from high-coverage structure-based domain-protein mappings. The domain-protein mappings are computed using large-scale structure alignment. SDADB contains ontological terms with probabilistic scores for more than 214 000 distinct SCOP domains. It also provides additional features include 3D structure alignment visualization, GO hierarchical tree view, search, browse and download options.
Database URL: http://sda.denglab.org
Introduction
A protein domain is a conserved and functional unit of a protein that can fold independently and has distinct functions. Most proteins consist of one or several domains. A unique domain may appear in a variety of different proteins that capture specific functions. Usually, specific functions of protein domains are highly independent, and they are, in many cases, conserved across species (1). For example, the catalytic domain of serine/threonine/tyrosine protein kinases is highly conserved from E. coli to human containing the catalytic function, and shares conserved catalytic regions with both serine/threonine and tyrosine protein kinases (2). The N-terminal of the catalytic domain has been shown to be involved in ATP binding, while the central part of the catalytic domain plays important roles in the catalytic activity of the enzyme (3, 4). A broad range of approaches has been developed to the problem of automatically identifying domain regions in protein sequences based on some degree of relatedness shared between domain sequences. InterPro (5, 6) is the widely used sequence-based domain database, which collates important resources for protein domain classifications: Pfam (7), CATH-Gene3D (8), SMART (9), ProDom (10), SUPERFAMILY (11) and PROSITE (12). The Conserved Domain Database (CDD) (13) maintains domain annotations for sequences. It produces representative sequence fragments, which are in agreement with domain boundaries as observed in protein 3D structure. A more reliable way to assign structures to the domain families is using the structural information. As the widely used hierarchical classification scheme of proteins, SCOP (14) groups protein domains into Class, fold, superfamily and family according to structural and evolutionary relationships (15). The current version of SCOPe version 2.06 (16, 17) contains over 240 000 structural domains.
Assigning ontological terms to specific domains are important for fully understanding functions of proteins. Gene ontology (GO) has been a de facto standard for describing gene and protein function (18, 19). It arranges in a directed acyclic graph and discriminates between molecular function and biological process, as well as subcellular localization. The GO terms in top levels describe general functions such as catalytic activity and binding. While deeper GO terms in the hierarchy represent more specific functions. For sequence-based domains, a few have been manually annotated with GO terms, and several computational prediction methods have been developed. The InterPro2GO mapping (20) is curated manually by the InterPro team, who compare InterPro and protein entries, check the statistic and conservation information, and assign most appropriate and specific GO terms to the InterPro domain. The Pfam2GO mapping is subsequently created by mapping InterPro domains to Pfam domains. Forslund and Sonnhammer (21) developed a probabilistic model to predict the relationship between multiple Pfam domain and annotation GO terms. Rentzsch and Orengo (22) use domain functional families (FunFams) to predict the functions of whole proteins. They group domain sequences into FunFams based on the GO annotations and associate the FunFams with GO terms probabilistically.
Although sequence-based domain annotation and domain-centric protein function prediction have been extensively studied, predicting functions for protein structural domains is, even more, difficult given the lack of comprehensive structural domain information for proteins. Only a few previous efforts have been performed to computationally predict structural domain functions (11, 23, 24). The SUPERFAMILY database (11) contains SCOP domain architecture and classification assignments to sequences at the superfamily level by using hidden Markov models. Based on the sequence homology to SCOP structural domain mapping in SUPERFAMILY, the dcGO database (24) provides GO annotations for SCOP domains in a probabilistic framework at the superfamily and family levels. Daniel and Florencio (23) proposed a scop2go approach, which annotates SCOP domains with molecular function GO terms based on the fold distribution of PDB structures associated with given GO terms. Although these resources are valuable, they only have coarse-grained level function annotation and are largely incomplete in that many domains are still not annotated.
Recently, we proposed a functional annotation approach for structural domains (SDA) that is largely based on 3D structure-based domain-protein mappings (25). We used a Bayesian network to integrate heterogeneous information: (i) protein-to-domain mappings calculated using all-against-all structural alignment of SCOP domains and protein structures from the PDB database; (ii) SCOP-to-InterPro domain mappings calculated using the InterProScan software; (iii) SVM models generated based on the position-specific scoring matrix (PSSM) profiles; (iv) sequence homologs mapped to SCOP domains using a Bayesian network. We showed the advantages of integrating large-scale structure-based mappings and other heterogeneous information sources for structural domain function prediction.
Here, we present the SDA database, which provides domain GO annotations predicted from our integrated method, and also includes links to other databases. The server allows users to query functional annotations for input proteins or domains. The results can be visualized in an interactive 3D viewer and a tree viewer. SDADB is available at http://sda.denglab.org.
Methods and data sources
Structural domains are downloaded from SCOPe version 2.06 (16, 17). GO annotations for the SCOP domains are generated by our structure-based integrative function prediction approach that combines structural mappings with other sequence and evolutionary clues (25). A detailed illustration of the data sources and framework is shown in Figure 1. Briefly, for a query SCOP domain, GO annotations are predicted with four component methods (structure-based, InterPro-based, PSSM-based and sequence homology-based methods). A probability for each annotation is calculated using a Bayesian network trained on a dataset of SCOP domains (ending in dash) generated from single-domain proteins.
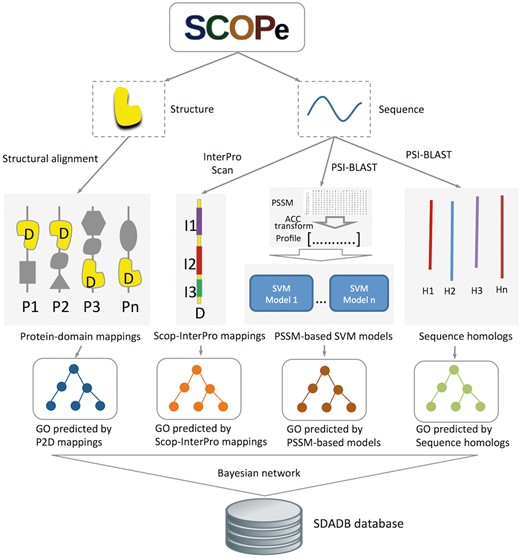
Flowchart of SDADB construction. For each domain in the SCOPe database, GO annotations are predicted with the four component methods: (i) GO annotations predicted using P2D mappings: protein-SCOP domain mappings are calculated by large-scale structure alignment, then the probability that a domain annotated by a specific function is computed; (ii) GO annotations predicted using Scop-InterPro mappings: we use InterProScan to search InterPro domains for the SCOP domain, and transfer the annotations of these InterPro domains in the InterPro2GO database to the target SCOP domain; (iii) GO annotations predicted using PSSM profiles: SVM models for GO function annotation are trained with fixed length of PSSM vectors, which are calculated using ACC transformation; (iv) GO annotations predicted using sequence homologs: we transfer the GO annotations of the sequence homologs in UniProt-GOA to the target SCOP domain. Finally, the SDADB database is built by integrating the outputs of the four component methods with a Bayesian network.
GO annotations predicted using protein-domain structural mappings
GO annotations predicted using Scop-InterPro domain mappings
GO annotations predicted using PSSM profiles
GO annotations predicted using sequence homologs
Integration of the four component methods
The final predicted GOA-SCOP (GO annotation for SCOP domains) data are stored in an MYSQL database. The website is developed using Perl, JavaScript, jQuery (AJAX), CSS and HTML5, and is deployed on an Apache web server. The BioJava (40) and JSmol (41) provide visuals of the P2D alignment. D3 (D3.js) (42) is used for visualizing GO hierarchical tree.
Web server interface
The SDADB database can be queried through the protein/domain accession number (e.g. 1te0/d1te0a2) or protein/domain name (e.g. Stress sensor protease DegS). The server will return a list of GO annotations with corresponding confidence scores (Figure 2A). The detailed annotation information, including GO accession ID, GO type, GO name and associated score, are shown in the table. The associated score denotes the probability of the SCOP domain certain having the GO function. The higher the score is, the more likely the SCOP domain has the function. The default cut-off of the associated score is 0.5. The GO annotations with scores over the cut-off are colored in red. The users can change the threshold according to their own needs. Also, users can search GO annotations in the results and download the detailed results in Excel or CSV file.
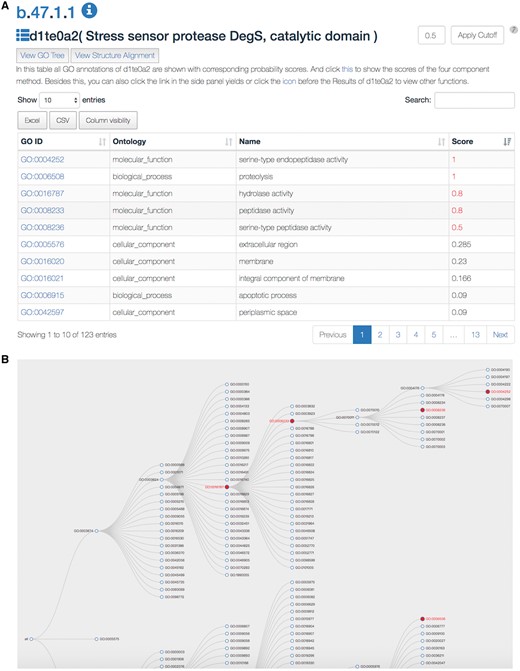
A snapshot of the SDADB web interface. (A) The GO annotations of a query domain are listed. (B) The GO tree view shows the hierarchical architecture of GO for the query domain.
Users can view the annotations by clicking the ‘view GO tree’ button, which shows the hierarchical architecture of GO (Figure 2B). Users can expand or collapse the term nodes. The red nodes in the tree are annotated GO terms of the target SCOP domain. Users can view the GO name by putting the mouse over the node. Another unique feature is the visualization of structure alignment for the domain-protein mappings, which constitutes a major contribution to the function prediction. Users can choose to view the alignment between the target domain and its structural neighbors in 3D view (Figure 3).
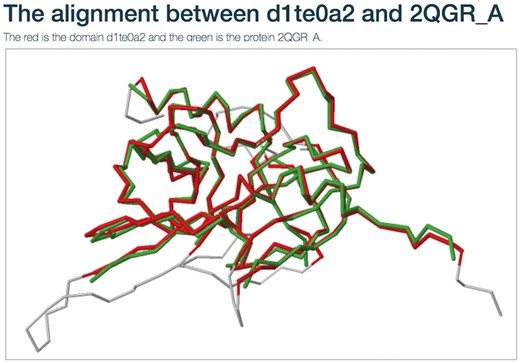
The structure alignment view for the domain-protein mappings.
Results
To evaluate the accuracy of domain functional annotations, we use the dataset obtained from GOA-PDB version 201010 in training and the independent test set from GOA-PDB version 201311 excluding those in GOA-PDB version 201010 for testing. Proteins of the test set that have >90% sequence identity to the proteins in the training set are removed. We use the precision–recall curve and maximum F-measure (Fmax) to measure the overall performance. The precision–recall curve shows the trade-off between precision and recall for different thresholds. A high area under the precision–recall curve denotes high overall performance. F-measure considers both the precision and the recall of the GO prediction results of SCOP domains. It is calculated as the harmonic average of the precision and recall. Maximum F-measure (Fmax) is the maximum value of the F-measure over a varying threshold. The coverage is computed by dividing the number of domains with predicted GO annotations by the total number of domains in SCOPe 2.06. For detailed descriptions of the datasets and performance measures, see Reference (25).
We compare our SDADB database with the four component methods, including structure alignment-based method (Str), Interpro domain-based method (IPR), PSSM profile-based method (PSSM) and sequence homolog-based approach (Seq). The results are summarized in Table 1. We observe that the combined SDADB significantly outperforms the four component methods, with a maximum F-score of 0.833 for MF (molecular function), a maximum F-score of 0.723 for BP (biological process) and a maximum F-score of 0.809 for CC (cellular component). For the coverage, SDADB has GO annotations for most SCOP domains (92.3%). We also compare SDADB with other state-of-the-art approaches on the independent test dataset. As shown in Figure 4, it is clear that SDADB significantly outperforms SDA and other methods for both MF and BP.
Prediction performance comparison of SDADB with the four component methods
| Methods | Coverage | Fmax (MF) | Fmax (BP) | Fmax (CC) |
|---|---|---|---|---|
| Str | 0.802 | 0.806 | 0.690 | 0.767 |
| Blast | 0.918 | 0.755 | 0.616 | 0.687 |
| PSSM | 0.509 | 0.491 | 0.364 | 0.507 |
| IPR | 0.555 | 0.711 | 0.508 | 0.263 |
| SDADB | 0.923 | 0.833 | 0.723 | 0.809 |
| Methods | Coverage | Fmax (MF) | Fmax (BP) | Fmax (CC) |
|---|---|---|---|---|
| Str | 0.802 | 0.806 | 0.690 | 0.767 |
| Blast | 0.918 | 0.755 | 0.616 | 0.687 |
| PSSM | 0.509 | 0.491 | 0.364 | 0.507 |
| IPR | 0.555 | 0.711 | 0.508 | 0.263 |
| SDADB | 0.923 | 0.833 | 0.723 | 0.809 |
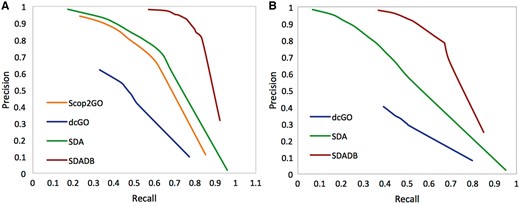
Precision–recall curve of SDADB versus existing methods for molecular function (A) and biological process (B).
Conclusion
The SDADB database provides large-scale detailed GO annotations at the structural domain level. In contrast to the approaches based on sequence and homology information, an advantage of SDADB is that the method integrates structural neighborhood features together with a variety of heterogeneous information, including SCOP-InterPro domain mapping information, PSSMs and sequence homolog features. The SDADB database now contains 3 482 316 GO annotations for 211 282 SCOP domains with a probability >0.1. Of these, 1 479 652 annotations for 204 948 domains have a probability >0.5. Also, SDADB provides P2D mappings for over 191 060 PDB structures. The vast amount of P2D and domain-function mapping data in the SDADB database can help to investigate the functions of full-length proteins since domains are functional units of proteins. The database will also give valuable insights into protein domain evolution, which are not only likely to be fascinating but will also ultimately improve the power and accuracy of protein function prediction approaches.
It is worth pointing out that some common and multifunctional domains may be not well annotated since the presence of a common domain in several proteins does not necessarily imply that these proteins have the same function. Future developments will focus on combining more informative clues and analyzing tools. We also expect the interested user will be able to use the resources provided in the SDADB database as a basis for new efforts on expanding the functional space for both domains and full-length proteins.
Availability
The SDADB database is freely available at http://sda.denglab.org/.
Funding
This work was supported by National Natural Science Foundation of China (61672541); Natural Science Foundation of Hunan Province (2017JJ3287); Natural Science Foundation of Zhejiang (LY13F020038); Fundamental Research Funds for the Central Universities of Central South University (2017zzts727) and Shanghai Key Laboratory of Intelligent Information Processing (IIPL-2014-002).
Conflict of interest. None declared.
References
Author notes
Citation details: Zeng,C., Zhan,W., Deng,L. SDADB: a functional annotation database of protein structural domains. Database (2018) Vol. 2018: article ID bay064; doi:10.1093/database/ bay064
