


Abstract
Gene regulation is a highly complex and networked phenomenon where multiple tiers of control determine the cell state in a spatio-temporal manner. Among these, the transcription factors, DNA and histone modifications, and post-transcriptional control by small RNAs like miRNAs serve as major regulators. An understanding of the integrative and spatio-temporal impact of these regulatory factors can provide better insights into the state of a ‘cell system’. Yet, there are limited resources available to this effect. Therefore, we hereby report an integrative information portal (Plant Regulomics Portal; PRP) for plants for the first time. The portal has been developed by integrating a huge amount of curated data from published sources, RNA-, methylome- and sRNA/miRNA sequencing, histone modifications and repeats, gene ontology, digital gene expression and characterized pathways. The key features of the portal include a regulatory search engine for fetching numerous analytical outputs and tracks of the abovementioned regulators and also a genome browser for integrated visualization of the search results. It also has numerous analytical features for analyses of transcription factors (TFs) and sRNA/miRNA, spot-specific methylation, gene expression and interactions and details of pathways for any given genomic element. It can also provide information on potential RdDM regulation, while facilitating enrichment analysis, generation of visually rich plots and downloading of data in a selective manner. Visualization of intricate biological networks is an important feature which utilizes the Neo4j Graph database making analysis of relationships and long-range system viewing possible. Till date, PRP hosts 571-GB processed data for four plant species namely Arabidopsis thaliana, Oryza sativa subsp. japonica, Zea mays and Glycine max.
Database URL: https://scbb.ihbt.res.in/PRP
Introduction
Gene expression is influenced by environmental factors, which shapes the behavior and phenotype of tissues. A cell state is the final product of combinatorial impacts of various regulatory factors broadly categorized as transcriptional and post-transcriptional regulators. The most important among these are DNA methylation, epigenetic regulation and transcriptional and post-transcriptional regulation by transcription factors and sRNAs (1–2). A common feature of all these regulatory components is the repetitive elements of the genome which give birth to sRNAs and facilitate RdDM in plants (3–4), define DNA methylation hotspots (5) and provide an array of transcription factor-binding sites for gene regulation (6). sRNAs are small RNAs with length around 20–24 bases which function by complementary binding to target nucleic acids. In plants, sRNAs participate in transcriptional as well as post-transcriptional gene regulation. In post-transcriptional regulation, sRNAs bind to the target RNAs and block the process of translation while causing degradation of the target RNAs. In post-transcriptional control, the sRNAs bind to some target region in DNA and cause DNA methylation around their binding region. This mechanism is also called as RNA-directed DNA methylation (RdDM). While an integrated information portal for all these regulatory factors would facilitate meaningful understanding of the enormous data that are already available or are being constantly generated, an acute dearth of such integrated resource portal for plant systems renders our understanding of regulatory influences in plant system quite limited. At present, there are only few resources that are specific to plants. These include the PMD (Plant Methylome Database) (http://epigenome.genetics.uga.edu/PlantMethylome/index.html), TED (Tomato Epigenome Database) (http://ted.bti.cornell.edu/epigenome/), HRGRN (http://platngrn.noble.org/hrgrn/), a graph database for gene regulatory search, TEA, the epigenome platform and the Bisulfite-Seq information for studying the methylome as well as the whole genome of the model plant Arabidopsis thaliana (http://tea.iis.sinica.edu.tw). However, these resources fail to provide sufficient integrated regulatory information and analytical gateways (Table 2). For example, the TAIR database (one of the largest databases on Arabidopsis) has inbuilt tools for data processing and downloading, GBrowse, information on metabolic pathways, GO annotations and other additional modules. However, TAIR does not provide any options for either comparison of multiple gene expressions or analysis of repeats with respect to DNA methylation. Nor does it contain information regarding the sRNA:target interactions, expression anti-correlation, origin of sRNA reads, DNA methylation and histone modification, transcription factor-binding site and gene expression. While it is difficult to find any single-stop provision for fetching information and integrated analysis of various regulators in plants, such a system can facilitate better understanding of the molecular systems functioning within plants during their development and response to environmental conditions including stress. Therefore, the major objective of the present study was to develop a database for a broader understanding of plant regulomics including epigenetic modifications and also transcriptional and post-transcriptional regulation by small RNAs like miRNAs, repetitive elements and TFs. The aim was to integrate user-friendly features in the database like (i) ability to find genomic elements in any genomic location, (ii) view methylation profiles, targets of sRNAs and also transcription factor binding sites, (iii) a high-quality Neo4j graph visualization module for the entire associated network and (iv) a feature for integrating more and new information on plant species including those on A. thaliana, Oryza sativa, Zea mays and Glycine max, provided the required minimum data were available. Those conditions were considered where at least the data for RNA-seq, sRNA-seq and methylome/epigenetic for any common experimental condition were available with sequenced and annotated genome for any given species.
Data statistics of PRP: total data collected for methylation, RNA-seq, small RNA-seq and genomic binding from different studies with total sample count. Cross denotes the sample available in replicates
| Plant | GSE ID | SRA ID | Methylation | RNA-seq | sRNA-seq | Genomic binding | Degradome | AGO |
|---|---|---|---|---|---|---|---|---|
| Oryza sativa jp. | GSE81436 | SRP075099 | 5 | 3 × 2 | 2 | 2 | 0 | 0 |
| GSE38480 | SRP013556 | 4 | 4 | 4 | 0 | 0 | 0 | |
| GSE77710 | SRP068886 | 2 | 2 | 8 | 0 | 0 | 0 | |
| GSE19602 | SRP001787 | 4 | 4 | 4 | 12 | 0 | ||
| GSE42410 | SRP017256 | 18 | 9 | 10 | 0 | 0 | 0 | |
| GSE18248, GSE42467, GSE19050, GSE17398, GSE39307, GSE42467, GSE62200 | SRP001553, SRP017281, SRP001724, SRP002288, SRP014309, SRP017281, SRP048797 | 0 | 0 | 0 | 0 | 13 | 0 | |
| Glycine max | GSE25260 | SRP004444 | 0 | 0 | 1 | 0 | 0 | 0 |
| GSE37895 | SRP012991 | 3 (1 × 2) | 3 × 2 | 3 | 0 | 0 | 0 | |
| GSE34875 | SRP010104 (GSE34853 EX), SRP010105 (GSE34852 SM), SRP010103 (GSE34849 BS) | 4 | 4 | 4 | 0 | 0 | 0 | |
| GSE25260, GSE34433, GSE33379, GSE58779 | SRP004444 SRP009822, SRP009197, SRP043543 | 0 | 0 | 0 | 0 | 9 | 0 | |
| Arabidopsis thaliana | GSE50486 | SRP029364 | 1 | 2 | 2 | 0 | 0 | 0 |
| GSE49090 | SRP028132 | 4 | 8 | 4 | 18 | 0 | 0 | |
| GSE51304 | SRP030646 | 5 | 9 × 2 | 5 | 11 | 0 | 0 | |
| GSE52952 | SRP033352 (GSE52342 D), SRP033350 (GSE52346 B), SRP033469 (GSE52951 S), GSE52067 E | 3 (1 × 2) | 4 × 2 | 8 | 0 | 0 | 0 | |
| GSE52342 GSE84728 GSE11007 GSE11094 | SRP033352 SRP079375 NA SRP000713 | 0 | 0 | 0 | 0 | 13 | 0 | |
| GSE12037, GSE22252, GSE40259, GSE11070 | SRP002667, SRP014967, SRP000622, NA | 0 | 0 | 0 | 0 | 0 | 19 | |
| Zea mays | GSE39232 | SRP014211 | 23 | 6 | 6 | 0 | 0 | 0 |
| GSE43142 | SRP017685 | 8 | 8 | 6 | 24 | 0 | 0 | |
| GSE47837, GSE52297 | SRP025172, SRP032948 | 0 | 0 | 0 | 0 | 9 | 0 |
Materials and Methods
Data collection
Data/information regarding genes/transcripts, DNA methylation patterns, histone modification, transcription factors, miRNA/sRNAs and their interactome, whole genome expression profiles, sequencing data, degradome support and repeat associations were collected using GEO, Ensembl Plants, miRBase, PMRD, PLACE, CISDB, STRING and DPMIND. These along with details of several other datasets were fed into the PRP portal developed by us. Presently, it hosts a total of 571 GB data curated from 35 GEO datasets and includes 331 samples for methylation, RNA-seq, small RNA-seq, histone modification (ChIP-Seq), Degradome-Seq and AGO (CLIP-Seq) of different tissues/conditions (Table 1 and Figure 1). A complete description of data statistics is given in Figure 1. It represents the overall data distribution for PRP.
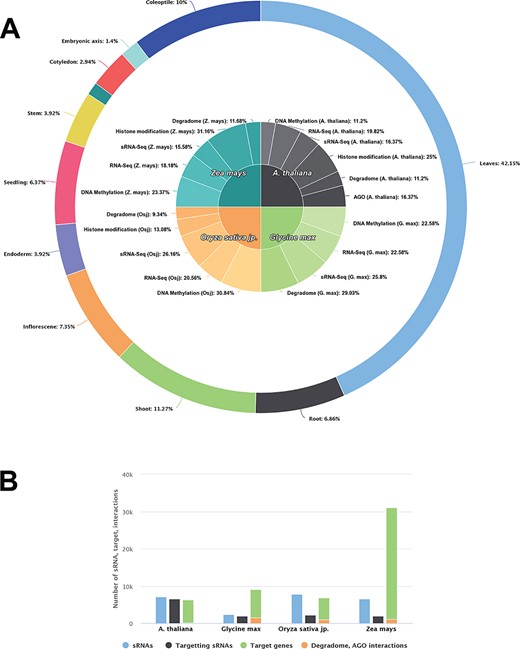
Data statistics of each species in PRP. A The contribution of DNA methylation, small RNA-seq, RNA-seq, degradome, AGO (CLIP-Seq) and genome binding occupancy/Histone modification (ChIP-Seq) sequencing data collected for analysis from Arabidopsis thaliana, Glycine max, Oryza sativa jp. and Zea mays. B ssRNA/miRNA related information and distribution of their targets and experimentally validated targets.
While collecting the data, only those experimental conditions were considered for integration into PRP where at least RNA-seq, sRNA-seq and DNA methylation data were available for a given experimental condition. This was done to ensure the measurability of the impact of DNA methylation and transcription factors on gene expressions, associations with sRNAs that regulate DNA methylation through RdDM and post-transcriptional gene silencing (PTGS). Species which did not match the abovementioned criteria for integration into PRP portal were not included in the study.
Quality control, filtering and processing of collected data from different platforms
Since careful processing and proper structuring of a wide range of types of data were required, the collected raw read data were processed according to the source and type of platform that release the data. Therefore, all the raw read data were filtered and assessed for suitable quality. Since sRNA sequencing reads are much shorter than data from RNA-seq and have different adapters, the bisulfite data have peaks for methylation in DNA and the CHIP-seq have peaks for cross-linking at the transcription factor-binding sites, variable quality scores i.e. 25 QS, 20 QS and 25 QS were used for RNA-seq, sRNA-seq and Bisulfite-Seq sequencing raw read, respectively. Trimmomatic toolkit (7) was used for removal of adapters. Different analysis pipelines were used for quality filtering and further processing of reads. While Tophat–Cufflink and Bowtie2–HTSeq-count pipelines were used with default parameters, the Bismark tool was used for genome-wide DNA methylation analysis for bisulfite sequencing data as well as for context-wise methylation assessment for CG/CHG/CHH. The methylated reads from every sample were mapped by Bismark/Bowtie2 with one mismatch. Bowtie ShortStack was used for sRNA identification.
Quantification of miRNAs was done using a quantifier program of the miRDeep2 pipeline (8–10). Bedtools intersectBed was used for the annotation of sRNAs from the genomic regions. Normalized methylation score was calculated based upon the ratio of methylated and unmethylated cytosine for each cytosine base through custom scripts (methylated C count/methylated C count + unmethylated C count). Gene expressions were measured using the Cufflink pipeline because it produces normalized expression in RPKM/FPKM values. The sRNA/miRNA expression was obtained by read mapping and normalization of expression by converting counts into RPM (reads per million) values. Data from each species was mapped to the corresponding genome for coverage calculation and BinWise graph generation in BAM/BED format for display in the genome browser and regulatory analysis. Repeat annotations in Arabidopsis were obtained from TAIR10, but annotation information for other species was obtained from the ENSEMBL plant database. Annotations against Repbase were also considered (11). Expression of repetitive elements was calculated using TEtranscripts toolkit because it considers the uniquely mapped reads to each repetitive element and every chromosome for any given species (12).
Target identification of sRNA and transcription factors
sRNA/miRNA targets were obtained by applying p-TAREF (13) and psRNA target (14) with two interaction mismatch levels and −10 kcal/mol interaction energy. These sRNA–target interaction pairs were filtered for expression anti-correlation values (PCC ≤ −0.5) and normalized expression values for sRNA and corresponding targets. The expression anti-correlation by p-TAREF facilitated further support for miRNA targeting. Further, all filtered interaction pairs were checked across degradome and AGO cross-linked sequencing data using Cleaveland and Bowtie (15––16). Transcription factor-binding site (TFBS) information was incorporated using MOODS package with a P value cutoff (0.05) for the selection of the binding sites (17).
The association analysis for the potential RdDM was performed using in-house scripts, whereas differential DNA methylation was performed using Fisher’s exact test between the two groups. DNA methylation context percentage was obtained using count methylated data. Hyper-geometric test was applied using the Bonferroni correction method for gene enrichment analysis at significance level of 0.05 and adjusted P value. R was used for all statistical analyses. All processed and structured data were implemented through the web portal interface for efficient browsing and search with analytical provisions. Figure 2 provides the details of the database implementation.
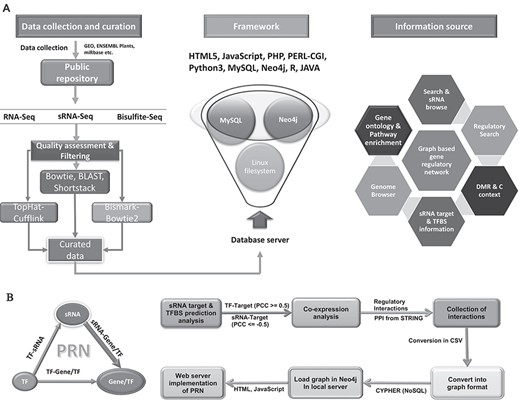
Data curation workflow and portal architecture. A All deposited data were curated by various pipelines and were implemented into the portal using defined architecture. B The implementation of biological interaction networks. Significant sRNA:target genes, TF: target genes. Protein–protein interactions were considered to build a combined graphical model of interactions of these elements using state-of-the-art graphical database Neo4j.
Web implementation
PRP was developed using MYSQL, APACHE web server and Neo4j native graph database on Ubuntu Linux OS. The database front end was designed using HTML5 and Java scripts. Communication between user requests and MYSQL database tables was implemented using PHP and PERL-CGI server-side scripting. For each type of data retrieval, integration and real-time analysis processes were implemented using different scripts written in Java, PERL, Python, Curl and PHP. Search facilities using keywords like Ensembl ID, gene symbol, functional description and UniProt ID with auto-suggestions were incorporated. Each search entry is retrievable from MySQL tables using PHP and Ajax scripts, while node and edge data are retrievable from Neo4j by the Curl post method. A few in-house-developed scripts running in the back-end were configured to perform on the spot analysis, statistical tests, anti-correlation between methylation levels and gene and sRNA/miRNA expression. Plots showing expression of genes, sRNAs and DNA methylation were generated using the Highcharts and Highstock library in HTML. For example, information about DNA methylation spots was connected to the expression profiles of any particular spot, the nearby regions and associated genomic elements. Presently, PRP contains information on precise DNA methylation locations, their relative scoring with respect to cytosine context types (CG, CHG and CHH), expression of all the genomic elements, genes and repetitive elements, RNA-seq and small RNA sequencing data, genomic and ontology annotations, information on transcription factor genes as well as their binding sites (TFBS), miRNAs and their target information (Figure 2A).
Neo4j Graph implementation
Various biological interactions when considered together form a network of interactions. These networks were implemented into highly interactive and dynamic graphs to provide a collective and system level view and “on the spot” analysis. The search options have been extended to regulatory search, network visualization and enrichment analysis. Nodes and edges (relationship) were fetched for sRNA-Gene/TF, TF-sRNA and protein–protein interaction, which were further loaded into the Neo4j native graph database using Cypher-based load query command and import utility to load large graph data. The CURL POST method was incorporated in the back end for retrieving the network from the Neo4j database and which was converted into JSON. The output is displayable in HTML using D3 JavaScript library (Figure 2B).
The PRP genome browser was implemented in JBrowser v1.14 (https://jbrowse.org/) because it includes a track-wise list of data for DNA methylation, histone modification, small RNAs, RNA-seq, microRNAs, repetitive elements, genome annotation, TFBS and reference sequence track. Methylation, expression, genome binding and sRNA expression tracks were loaded from bigwig file format while the annotation tracks for genes, repetitive elements, miRNA/sRNA and TFBS were loaded from the GFF3 format using the flatfile-to-json.pl script. Each species track was listed in faceted track information option with GEO dataset ID, tissue type, experimental technique, etc. A dedicated tab with option for selection of species and browsing the genome browser has been made available in the main menu bar.
Results and Discussion
Searching the database
The portal developed by us has an interactive module for analysis of epigenetic and high-throughput methylation data. It facilitates visualization of the associated regulatory network information for different species from different conditions/samples. Compared to other databases, PRP provides many useful features at a single spot. For example, HRGRN (a part of the plant-GRN database) has integrated information about signal transduction, metabolism, gene regulation, transcription factors and sRNAs for A. thaliana (18). It also provides molecular interactions in a graph-based network for A. thaliana. In contrast, a database like PMD contains just methylation profiling information for about 40 plant species. It is limited only to genome browser visualization in the form of an XY plot and lacks other desired system-level information integration (http://epigenome.genetics.uga.edu/PlantMethylome/).
The epigenomics platform for Arabidopsis (TEA) provides context-wise methylation status for promoter and genic regions, but it does not include the regulatory information (19). TED provides DNA methylation information related to genes and visualization of RNA-seq/sRNA-seq profiling information in genome browser for Tomato (20). Contrary to these databases, PRP offers more than the other databases as it can provide vital molecular information in an integrated fashion at a single platform. Table 2 provides a comparison snapshot of the discussed databases, suggesting the wide spectrum of PRP.
Comparison of PRP with other databases. PRP has covered most of the regulatory features than other databases
| Content | PRP | PMD | TED | HRGRN | TEA |
|---|---|---|---|---|---|
| Methylation profiling | √ | √ | √ | √ | √ |
| Expression profiling | √ | χ | √ | √ | χ |
| sRNA profiling | √ | χ | √ | χ | χ |
| sRNA association | √ | χ | χ | √ | χ |
| Regulatory analysis | √ | χ | χ | χ | χ |
| Gene Regulatory Network | √ | χ | χ | √ | χ |
| Genome Browser | √ | √ | √ | χ | √ |
| Neo4j graph implementation | √ | χ | χ | √ | χ |
| No. of species | 04 | 43 | 01 | 01 | 01 |
PMD—Plant Methylation Database, TED—Tomato Epigenetic database, TEA—the epigenome platform for Arabidopsis methylome study, HRGRN—a graph search-empowered database for Arabidopsis Signaling Transduction, Metabolism and Gene Regulation Networks. Most of these databases do not provide any mode to perform integrated regulatory analysis in composite manner which PRP does.
The PRP homepage search is designed with auto-suggestion. Users can search the database by providing gene name/symbol, ENSEMBL ID, functional description and Uniprot ID, besides applying coordinate-based search, which takes chromosome number and start-end coordinates as ‘input’. It also provides BLAST as well as quicker Bowtie mapping-based search and separate search options for miRNAs and transcription factors. Being connected to different regulatory and enrichment analyses, the search option provides basic information about genes/miRNAs/TFs in the database and also facilitates retrieval and visualization of information including associations with other genomic elements, target sites, possible genomic regions for their genesis and biological interaction status through graph-based network visualization. PRP offers browsing facility for detailed information about genes/TFs and miRNAs/sRNAs with an option for analysis of possible epigenetic regulation by DNA methylation and action of regulators (miRNA/sRNA/TFs) at transcriptional and post-transcriptional levels.
A very important component of PRP is the regulatory search module, which provides a comprehensive and detailed insight into the possibility of relationship between methylation and expression of the gene of interest. The pop-up button which opens after clicking displays a window with different input parameters. Each parameter is available with hidden suggestions in input tag or tooltip help cursor. Information from the previous search page is inherited into different input tags and has additional options like selection of upstream and downstream flanking regions for extended search. The user can choose to perform only differential methylation analysis or opt for expression correlation analysis between gene expression and methylations in gene body and flanking regions. Finally, upon submission using analysis button, all results are displayed either graphically or in the form of tables.
Identification of sRNAs and their genomic associations
The small RNA-seq raw reads data required for PRP were obtained for each species from different studies and sample types (details are given at https://scbb.ihbt.res.in/PRP/Downloads.php). Each sample read data was mapped to the genome of respective species using Bowtie with zero mismatch. These reads were distinguished from those mapping to miRNAs and other non-coding RNAs. The remaining reads were assessed for identification of potential sRNAs and functionally, important sRNAs using the ShortStack standalone tool known to perform de novo identification of small RNAs like size distribution, repetitiveness, strandedness, hairpin associations and miRNA annotations (9). A criterion for selection of potential sRNA candidates makes it mandatory that the sRNA should be expressed in at least 50% of sample size taken for analysis. The total number of potential sRNAs s for all species was also processed for association analysis and is listed in Table 3.
Identified sRNAs from plant species
| Species | No. of sRNAs | Targeting sRNAs | Target genes | Degradome/AGO support |
|---|---|---|---|---|
| A. thaliana | 7065 | 6529 | 6156 | 156 |
| Glycine max | 2413 | 1929 | 7564 | 1519 |
| Oryza sativa jp. | 7799 | 2266 | 5937 | 929 |
| Zea mays | 6622 | 1969 | 29 923 | 1068 |
Each species small-RNA-seq reads were passed for quality assessment. The filtered unique sRNAs reads (20–29 bases long) were mapped to the respective genome for potential sRNA identification.
Association analysis for sRNAs was performed with respect to sRNA annotation or region of biogenesis across the genome. sRNAs in plants are associated not only with post-transcriptional regulation but also with RdDM. In such a scenario, locating the genomic origin and association becomes very important. Most of the sRNAs are generated from post-transcriptional modification of larger precursors of nascent RNAs. Also, many small RNA genes produce mature sRNAs from a single precursor. They have several routes of biogenesis, are the major regulators in plants and include diverse endogenous siRNAs (5, 21–22). The transcription of regulatory siRNAs is associated with POL-IV & V transcripts and preferentially yields a 24-base-long sRNA which displays RdDM capability (23–24). It was observed that the length of the majority of the sRNA reads obtained in this study is around 24 nt, suggesting sRNA candidates as potential regulatory candidates. In Arabidopsis, 60% of the total reads displayed a length of 24 bases (Figure 3A), while 45, 40 and 60% reads of O. sativa, G. max and Z. mays, respectively, were 24 bases long. After identification, the unique sRNAs were screened against respective genome annotations for possible regions of biogenesis. Most of the sRNAs were found originating from repetitive and intergenic regions, while a very few originated from the intronic and exonic regions (Figure 3B). Intersects of the sRNA coordinates were determined with respect to those for genic and repeat locations and proximity to sRNAs. After annotating the sRNAs, they were also evaluated for their association with any repetitive element and possible association with RdDM. In the browse tab, associations of sRNAs have been displayed for each species which further expands the information of possible RdDM.
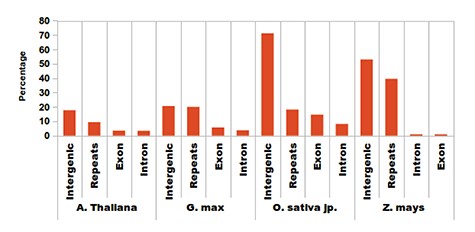
Distribution of identified sRNAs. Most of the sRNAs are being generated from repetitive elements, intergenic regions and some fractions of intronic and exonic regions.
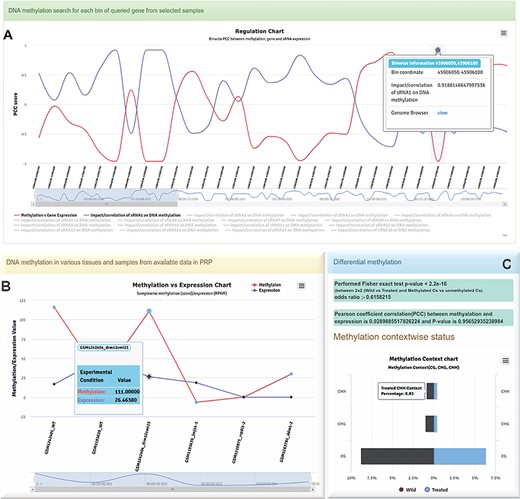
Different charts generated in PRP. A Regulatory chart-BinWise Pearson correlation analysis (PCC) between expression and methylation across the selected regions. B Methylation vs expression correlation chart visualized for a selected conditions, showing the pattern of methylation with expression. C Context-wise CG, CHG and CHH methylation between wild and treated samples.
Interactive analysis for methylation and expression
The methylation and expression pattern for every location in the selected region has been provided with a BinSize parameter where the user can predefine the bin size in the input tag for bins. Each bin starts from the upstream flank and stops at downstream flank spanning through the gene body region with the selected bin size. Each bin also carries a Pearson correlation coefficient (PCC) value between methylation vs sRNA expression, methylation vs gene expression and sRNA vs gene expression observed for each bin collectively. It also provides dynamic plots with differently colored lines. Furthermore, each bin point has a mouse-over tooltip for retrieving information about associated regions, PCC scores between expressions of sRNAs and target genes, methylation vs sRNA expression and gene expression vs methylation. It is a useful module for detecting the impacts of methylation or sRNAs on the selected bin/region, and relationship with associated target gene expression. Using this module, one can investigate any possible sRNA-led post-transcriptional or methylation-based transcriptional regulations. The plot is available with a zoom in/out option by range selector or mouse drag option and can be easily downloaded in different image formats (Figure 4A).
DNA methylation of different plant tissues is variable in the context of neighboring bases: CG, CHG and CHH (H = A, C or T) (25). While the CG and CHG methylation levels are the maintenance methylation patterns, CHH is a de novo methylation pattern that occurs in plants under adverse or stress conditions. It usually occurs with sRNA-driven RdDM for silencing of transposable elements and other genes (26).
It is possible to perform differential methylation analysis using PRP because it is integrated with data from different tissues (leaves, shoots, roots, cotyledon, coleoptile, seed and seedling, endosperm, etc.) of plants from various experimental conditions (Figure 1B). Differential methylation analysis can also be performed using samples of different tissues. The module is endowed with different color codes such as the blue text-colored sample name which shows the same sample type available in RNA-seq and small RNA-seq data for comparative analysis. It also allows users to compare across the replicates within the same tissue. The methylation spots can be calculated in real time in the background using background scripts developed in-house. Numbers of methylated Cs and non-methylated Cs can be classified into untreated and treated groups, and the selected samples can be separated accordingly. Fisher’s exact or logistic regression test can be applied for estimation of differential methylation between untreated and treated groups vs Cs (methylated) and Ts (non-methylated) categories (27) with a significant P value (≤0.05) suggesting a differential methylation pattern. PRP can also display a methylated cytosine count table in selected datasets/samples as compared to the total cytosines in genic regions, including the selected flanking regions.
The PCC can be calculated between the target gene-associated methylation and respective gene expression (RPKM/FPKM) for selected conditions. The correlation value between these can be calculated for assessing the influence of DNA methylation on gene expression. While this is displayed as a line plot (Figure 4B), the PCC test results are displayed in the blue panel (Figure 4C) and the context-wise methylation percentage for the selected region between two different conditions/groups as plots. This plot displays the group showing higher percentage of methylation in context specific manner (i.e. CG, CHG and CHH). The portal has options for downloading the context methylation plots in different formats (Figure 4C).
Information on sRNA targeting and TFBSs
In plants, sRNAs are known to guide de novo DNA methylation for silencing of transposons and other repetitive elements and also for stable repression of endogenous genes and specific transgenes (26). The ~24-nt-long small interfering RNAs (siRNAs) guide DNA methylation towards the loci which are homologous to the generated siRNAs for de novo DNA methylation via RdDM (28, 29). In this regard, sRNA targets were identified using p-TAREF (13) and psRNATarget (14) at a two-mismatch level. The sRNA–target interactions pair were selected after the anti-correlation values were evaluated between the expression levels of the sRNA and its target in normalized form for the related conditions and sample types. These interactions were also validated by scanning through the degradome and AGO cross-linking data for experimental evidence. Degradome data is available for all the considered species while AGO-sRNA cross-linking data is available only for A. thaliana. Homology search against Arabidopsis degradome data support can be gathered for other species. The details related to sRNA–target interactions like the number of targeting sRNAs, number of target genes, degradome and AGO supported interaction evidences are given in Table 3.
The sRNA target table in the regulatory analysis tab displays the sRNA and its targets with the PCC score. There is an option for viewing through a genome browser for a list of other target genes. If the PCC score is less than −0.5, it may be indicative of post-transcriptional (PTGS) regulation. Otherwise, if DNA methylation exhibits better correlation than sRNA–target interaction, it is indicative of RdDM. Figure 5D highlights one such case where the sRNA target is possibly being regulated through RdDM.
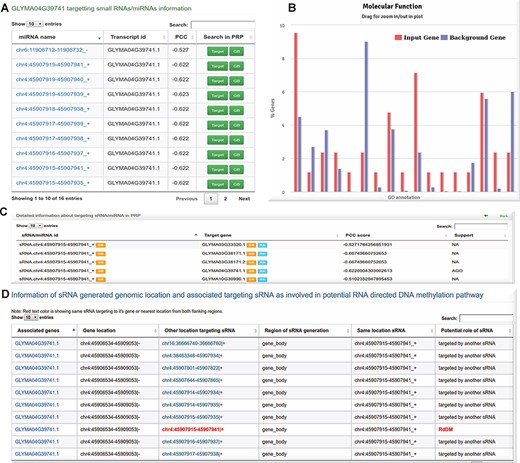
sRNA/miRNA target information: A potential sRNAs of Glycine max targets GLYMA04G39741.1 (defense protein in plant) transcript with significant anti-correlation. B Gene Ontology enrichment analysis performed using target gene and other interacting genes identified from PPI using hypergeometric test followed by Bonferroni P value adjustment. C sRNA/miRNA target gene interaction support status in degradome/AGO sequencing data. D Information on potential RNA-directed DNA methylation (RdDM) by an sRNA and its target gene.
The last table of regulatory analysis tab shows the TFBSs for selected genes with the flanking region. The sites were identified using MOOD package with a P value cutoff of 0.05 (17). It uses position weight matrix data in the background for each transcription factor, downloaded from CiS-BP (http://cisbp.ccbr.utoronto.ca/index.php). The identified TFBS can be further evaluated for expression correlation analysis between the associated transcription factor and the target gene having the TFBS in its upstream region. The RNA-seq read-based expression data is evaluated for the associated transcription factor and the target gene. A strong positive and significant correlation of expression may suggest the regulatory role of the TFBS with respect to the gene under study.
The table displays the TFBS target’s name, TF’s name, target gene ID, TFBS start coordinate, binding site orientation, motif match score, motif sequence and PCC score. This table also provides information related to significant association of DNA methylation with the expression of target gene.
Graphical representation of interactions and visualization
There is a provision for state-of-the-art visualization of the biological interactions with any target gene, interacting miRNAs, transcription factors and associated protein–protein interactions (PPI). In a biological system, processes like development, growth and environmental responses are always carried out through networks of various molecular interactions. Thus, high-throughput sequencing data were used to identify regulatory interactions like those of transcription factors and sRNAs. The experimentally validated and predicted protein–protein interactions are publicly available in databases like BioGRID (https://thebiogrid.org/) and String (https://string-db.org/), generally used to build PPI networks. However, very scarce resources exist to provide integrated interaction information for plants. Thus, a database integrating these heterogeneous biological interactions can serve as a valuable resource for studying gene behavior at the level of pathways and networks.
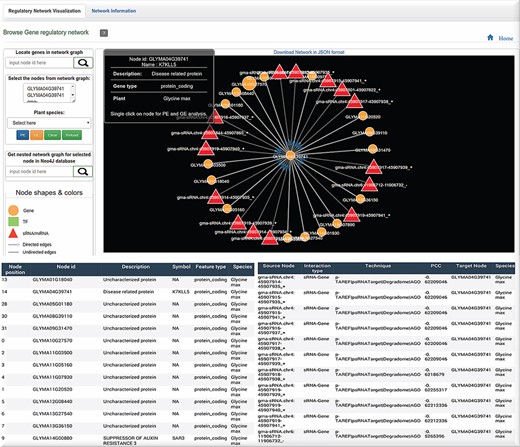
Graph visualization of the interactions with Neo4j graph database implementation of the biological interactions. Query from the user can be retrieved by CURL post method which can be visualized in HTML using D3 library. Also, a tabular information is generated for the network.
While biological networks capture intricate relationships with a large number of nodes and edges across them, it cannot be managed properly without a logical structure. Thus, a graphical approach is essentially required for handling such networks, revelation of their behavior and collective general viewing of their interactions (30). In cases where system-wide interests necessitate studies of biological networks, NoSQL graph databases like Neo4j are obviously chosen over SQL. The Neo4j native graph database was implemented which can capture the huge regulatory and PPI inter-relationships with thousands of nodes and relationships with each species. Therefore, all identified TF/sRNA-based interactions were selected for significant expression correlation values, whereas the PPI interactions were retrieved from STRING database for network graph implementation (Figure 2B). After the collection of all possible interactions, a 25-GB graph database was raised in Neo4j covering 268 283 nodes, 58 459 859 relationships and 1 832 012 properties. The graph is available in the regulatory analysis result page in a mini view form and can be explored and expanded in a new window tab. Query from the user is processed through the CURL POST method in the back-end which is sent in a JSON format into the D3 library for graph visualization. Nodes, as triangle, square and circle represent sRNAs/miRNAs, TF and gene, respectively. sRNA and TF-driven relationship edges are directed to their target node with an arrow shape, whereas other interactions show a simple edge line. There are various mouse-over click functions in PRP. Like the one implemented with graphs, a single click on a node selects the corresponding gene and places its ID into a form from which enrichment analysis over the selected list of genes can be done. The double-click function over a node shows only a single relationship or interaction between two nodes in the graph. The mouse-over scroll function zooms the graph in and out. Other tabs display additional network information for each node and relationships in a tabular form. Providing such type of information is helpful for studying any possible regulatory role or impact at a functional level. The user can also locate any gene from the graph, in case the need arises, and also locate it exactly in the network while assessing its connections (Figure 6).
The genome browser
The genome browser (GB) has been implemented using open source tool JBrowse by GMOD consortium. The PRP genome browser section includes a track-wise list of data for DNA methylation, histone modification, small RNAs, RNA-seq, microRNAs, repetitive elements, transcription factors, genome annotation and profiling. Genes, repetitive elements and sRNAs/miRNAs tracks are categories which appear in the canvas with sub-features like mRNAs, CDS, UTRs, exons and introns for the gene, mature miRNAs and pre-miRNAs. Other profiling tracks like methylation, histone, RNA and sRNA expression are shown in density or XY-plot type, capturing methylation and expression status at each position of the selected chromosome region. The user can zoom in/out, select or highlight the chromosomal region, upload tracks, select multiple tracks, pin the track or browse annotation track information. Annotation tracks also provide download options in gff3 and bed formats, while other expression tracks are available for download as bedgraph, wiggle or gff3 formats. The genome browser is accessible from different pages of PRP also. A snapshot of the genome browser is provided in Figure 7, illustrating annotation and coverage tracks for methylation/expression profiling.
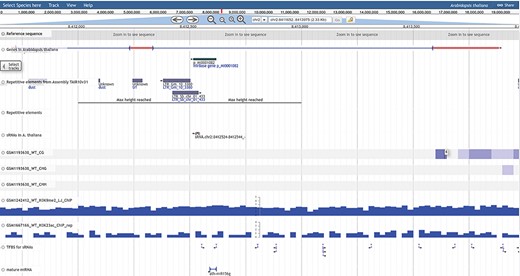
PRP genome browser. The total analyzed data of DNA methylation, RNA-seq, small RNA-seq and Histone modification profiling as well as annotation based information of genes, repeats, sRNAs/miRNAs, TFBS and reference genome available for visualization in the genome browser tracks.
Application demonstration
Genes are regulated at transcriptional and post-transcriptional levels through regulators like small RNAs, transcription factors, repeats and various epigenetic modifications. DNA methylation of cytosine is an epigenetic modification for the maintenance of genome complexity and spatio-temporal switching of genes in a highly contextual manner (CG, CHG, and CHH, H = A, T or C). In plants, DNA methylation is guided by ~24-base-long small RNAs to cause transcriptional gene silencing. They are also involved in causing PTGS through interaction with target transcripts (31). In PRP, it is possible to analyze the potential role of any given sRNA in regulating DNA methylation or post-transcriptional regulation through transcript targeting. Also, PRP’s bin-wise plot can be used to assess whether DNA methylation’s influence on gene expression is qualitative or quantitative.
As a case example in A. thaliana, VAD1–AT1G02120 is a GRAM domain family protein involved in defense response to diseases and negative regulation of programmed cell death during the growth phase of tissue (32). After a regulatory search for the gene encoding this protein, in two wild and four treated samples, methylation was found to be slightly higher in the wild-type as compared to treated samples. The details of these sample are available to the user upon the click of a mouse at the sample name. Usually, transcription factors are known to support the process of transcription by binding to the promoter regions. The identified TFBSs in the upstream region of this gene displayed strong positive correlations supporting their potential enhancing roles in VAD-1 gene expression (SOX (+0.86), WRKY (+0.81) and MADS-box (+0.84). The respective information of each gene is displayed through the database link at https://scbb.ihbt.res.in/PRP/gSearch2ex.php?gId=AT1G02120&Pspecies=Arabidopsis%20thaliana.
In the case of post-transcriptional gene silencing, the small RNAs target the transcripts and suppress the expression of the gene (33). For example, SPL11 (AT1G27360.3), Squamosa Promoter-Like 11, is a transcription factor containing an SBP-box domain. It is involved in the development of lateral organs in the reproductive phase. This transcript was found to be targeted by ath-miR156a-3p for which the support vector regression (SVR) score was 0.69 with high expression anti-correlation (PCC ≤ −0.76). This interaction was also evident in the degradome sequencing data. In accordance with slightly higher DNA methylation level in leaf tissues of wild samples as compared to inflorescence tissues, the PCC test showed a positive correlation between methylation and expression of the target gene. This all suggests the suppression of the gene at the post-transcriptional level in inflorescence tissue by miRNA targeting. The TFBS identification analysis displayed no significant influence being made by them to promote the gene expression (Regulation chart, sRNA/miRNA and TFBS target information tables in the Results section) (http://scbb.ihbt.res.in:8080/PRP/gSearch2ex1.php?gId=AT1G27360&Pspecies=Arabidopsis%20thaliana).
DNA methylations in the regulatory regions can influence the gene expression in spatio-temporal manner. A case example is the FLD gene (AT3G10390) which acts as a histone demethylase in the flowering stage of the plant. This gene promotes flowering in the photo-period and vernalization pathways by inhibiting Flowering Locus C (FLC) (34). The DNA methylation from wild tissue samples and flowering-stage samples were compared through Fisher’s exact test. The gene was differentially methylated, showing a highly significant P value (4.235e-09), and displayed a strongly negative correlation (PCC ≤ −0.94) between methylation and expression. This strongly suggests that the gene remains suppressed in flowering condition where DNA methylation could play an important role. The scanned results of sRNAs targeting the transcript displayed no significant anti-correlation (PCC > −0.2) between the gene and miRNA expression (regulation chart, differential methylation and sRNA/miRNA table in the Results section) (https://scbb.ihbt.res.in/PRP/gSearch2ex2.php?gId=AT3G10390&Pspecies=Arabidopsis%20thaliana).
All these examples from PRP illustrate that such types of regulatory mechanisms can be comprehensively analyzed in multiple samples and conditions using PRP. Such analyses are otherwise not possible with other databases and resources.
Conclusion
The Plant Regulomics Portal (PRP) database is a unique database where different kinds of high-throughput genomics data have been integrated from wide range of studies to facilitate single-stop integrated regulatory analysis of plant systems. It has integrated experimental data for DNA methylation, sRNAs, transcription factors, expression, genomic annotations and various interactions between the genomic elements including RNA targeting. All of this has also been implemented into a graphical database using advance libraries like Neo4j and D3J to make it easy to handle the enormous volume of data, visualize various biological interactions and perform specific analysis in a selective and interactive manner while leveraging from integrated data from different contexts. PRP also showcases the importance of interlinking of these high-throughput experimental data for derivation of meaningful observations.. The process of system regulation is a combinatorial impact of various factors like influence of methylation, transcription factors, sRNAs and repeats in a highly tissue- and condition-specific manner. Isolated data and analysis does not provide enough mechanistic information. Since there is a huge void in this regard in plants, PRP was developed to address these lacunae. The PRP also has the potential to provide deeper insights into plant systems and data-driven information processing template in the wake of oncoming critical sequencing projects like the Earth BioGenome Project where explosion of plant specific data is expected.
Article information
Acknowledgments
G.P. is thankful for DST SRF fellowship; I.G. and S.A. thank CSIR for their fellowship. We express our gratitude to the publicly available data and resources. We are thankful to Dr Amita Bhattacharya and Dr SK Vats for the English editing. The CSIR-IHBT article communication ID number for this MS is 3575.
Funding
Council of Scientific and Industrial Research and Department of Science and Technology/Science and Engineering Research Board (to R.S.)
Conflict of interest. None declared.
