


Abstract
Protein phosphorylation plays a fundamental role in many cellular processes. Proteins are phosphorylated by kinases, which have been studied as drug targets for the treatment of various diseases, particularly cancer. Because kinases have multiple roles in interconnected molecular pathways, their specific regulation is required to enhance beneficial and reduce adversarial effects of drugs. Using our previously developed platform, we measured phosphorylation profiles of MCF7 and K562 cells treated with 94 clinical drugs. These phosphorylation profiles can provide insights into pathway activities and biological functions. Here, we introduce Phosprof, a novel database of drug response based on phosphorylation activity. Phosprof is able to present up- or downregulated phosphorylated signature proteins on pathway maps, significant pathways on the hierarchal tree in signal transduction and commonly perturbed pathways affected by the selected drugs. It also serves as a useful web interface for new or known drug profile search based on their molecular similarity with the 94 drugs. Phosprof can be helpful for further investigation of drug responses in terms of phosphorylation by utilizing the various approved drugs whose target phenotypes are known.
Introduction
Protein kinases play key roles in multiple biological events (1). Kinases transduce signals through phosphorylation chain reactions via the pathway proteins, leading to appropriate cellular responses to cues from the external environment or from cell–cell communications (2). Kinases have been studied as drug targets in various diseases, since their dysfunctions are associated with pathologies, such as overactivation of kinases in cancer (3). Therefore, it is important to evaluate the role of kinase activities in the context of biological functions and diseases.
Large datasets of protein phosphorylation have been generated using mass spectrometry (4–6). Mass spectrometry measurements can provide information on modified amino acids. However, in some cases, quantitative studies face challenges in measuring labeled peptides or peptides of proteins present at varying levels in cells (7). In contrast, protein arrays accommodate controlled quantities of synthesized proteins and allow comprehensive measurements of protein phosphorylation levels by a simple reaction and detection method (8). The resultant datasets of phosphorylation levels of the arrayed proteins (‘phosphorylation profiles’) are suitable for quantitative studies and analyses (9). Phosphorylation profiles of various kinases have been generated to elucidate kinase–substrate relationships (10).
We previously developed a novel platform for protein array phosphorylation measurement and pathway analysis (11). We designed a protein array containing 1373 native proteins of 376 ‘pathway maps’, which are assigned as ‘signal transduction’ pathways in the public database Reactome (12). We measured phosphorylation activities using this native protein array. We examined the performance of our array by detecting kinase–substrate relationships (11). Using the measured data (namely ‘phosphorylation profiles’), significant pathways were identified in growth-factor-stimulated cells (11) or drug-treated clinical cancer cells (13, 14).
In this study, we generated a novel dataset using drug-treated cells to develop a new database, Phosprof. In this database, we illustrate the changes in the phosphorylation activities in cells treated with 94 drugs and the results of pathway analysis. We selected 94 bioactive compounds with a wide range of applications in preclinical research of human diseases. We analyzed the obtained data and compared the results to examine the relationships between pathways and the known functions of these drugs.
Data collection and analysis
Experiments
We generated the phosphorylation profile by applying cell lysate to a protein array. As illustrated in Figure 1, cultured cells (MCF7; human breast adenocarcinoma cells, ECACC, #86012803 and K562; human chronic myelogenous leukemia cells, ECACC, #89121407) were treated with 94 drugs from the L2400 Pfizer-licensed library (Selleck Inc.). These compounds were developed and validated by Pfizer. They have been marketed or clinically proven, and detailed preclinical research data and safety information are available from the manufacturer. Cells were cultured with each drug at a concentration of 10 μM or vehicle control (Dimethyl sulfoxide (DMSO) or water) for 2 h and lysed, and the obtained lysate was applied to the protein array with additional ATP.
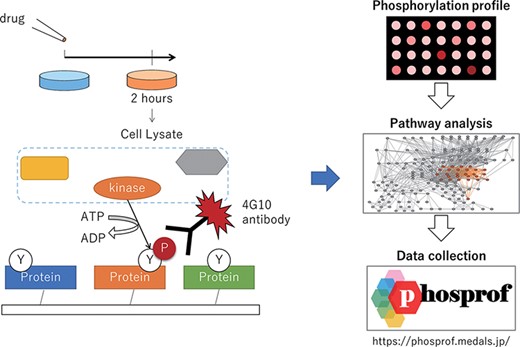
Scheme of the data collection and analysis for Phosprof. (Left) A drug from the Selleck L2400 Library was added to the cell culture media 2 h prior to the harvest of the cell lysate, which was then applied to a protein array with ATP. The tyrosine residues of the proteins on the array are phosphorylated by the cell lysate and detected using 4G10 antibody. (Right) The resultant ‘phosphorylation profiles’ were then analyzed to identify the significant pathways. The collected data can be browsed using various pathway analysis tools.
Phosphorylation activity was measured as described previously (11). Briefly, 1373 signal transduction proteins with glutathione S-transferase-tag were synthesized and loaded onto a glutathione-coated glass slide. Every protein was spotted (approximately 500 nl per spot) six times (n = 6) per slide while ensuring that they were neither denatured nor dried. During spotting, humidity was maintained at 40–60%, and the wetness of each drop was confirmed by microscopic observation of the liquid droplets. Cell lysates including 100 μg of total protein were applied to an array with additional ATP at 30°C for 3 h. After the termination of the kinase reaction, the array was washed with Tris Buffered Saline with 0.05% Tween20 (TBST) and stained with the 4G10 phosphorylated protein-specific antibody (Merck, #05-1050) and a secondary fluorescein-conjugated antibody (Thermo, #A21235) to detect the phosphorylated tyrosine residues.
Analysis
The difference expression of phosphorylation between the vehicle control and experimental samples was analyzed for raw and standardized data using the rank product test and Pearson’s correlation test using the R program (R Core Team, version 4.0.5). Signature proteins with increased and decreased phosphorylation levels were projected onto a full and simplified pathway map. A total of 376 pathways were integrated into four major functional groups—receptor tyrosine kinase (RTK) pathways (Group 1), Wnt–Hh pathways (Group 2), G-protein-coupled receptor (GPCR) pathways (Group 3) and cell death pathways (Group 4)—to precisely visualize pathways among the entire network of pathways that were perturbed by treatment with each drug. For legibility, we provide two types of pathway maps: full pathways containing all the 1373 proteins as pathway nodes and simple pathways with integrated nodes of complex proteins or protein groups.
Signature proteins based on the rank product were used to calculate the hypergeometric distribution of the 376 pathways as enrichment analysis to determine the significant pathways. We performed sequence analysis of the 1373 proteins on the array using IUPred for disorder prediction (15).
Web interface
All the metadata in Phosprof are managed by the SQLite database. The website is implemented in Django, which is a high-level Python framework. The upregulated and downregulated phosphorylated proteins were projected onto the pathway using our own developed program in ‘signature protein’ on the web. The pathway hierarchy of Reactome (12) in ‘pathway’ is visualized using graphviz. The Venn diagrams of ‘compare pathway’ for multiple-drug analysis are drawn using D3.js (Data-Driven Documents; https://d3js.org/). Open Babel is used to obtain Tanimoto coefficients between a simplified molecular input line entry system (SMILES) string and 94 representative clinical drugs in ‘Drug Search’. Significant molecules or pathways can be browsed, compared, and linked to further detailed information in the Protein Data Bank archive (PDB) (16) or Reactome (12). The detailed instructions for Phosprof are provided in the UserGuide (Supplementary Material).
Database features and applications
Signature protein
Cultured cells (MCF7 and K562) were treated with each of the 94 drugs and lysed, and the lysates were subjected to phosphorylation activity measurements using protein arrays. Phosphorylation of the array proteins was detected using staining with the 4G10 antibody, and the measured data were stored in the Phosprof database. We monitored tyrosine phosphorylation using the 4G10 antibody, which exhibits high sensitivity. Using this strategy, we successfully assessed the activity of signal transduction pathways associated with the functional cellular states (11). The differences between the vehicle control (treated with DMSO or water) and experimental samples (treated with a drug) were analyzed for stored raw or standardized data using the rank product test and Pearson’s correlation. These results are summarized in the ‘Signature Protein’ section. The signature proteins whose phosphorylation levels were changed significantly by the drug treatment can be browsed in Phosprof by selecting the drug of interest on the top page (Figure 2A). To overview the changes in the phosphorylation activity in the pathway network, the signature proteins are highlighted in the pathway maps. The signature proteins with increased (up) or decreased (down) phosphorylation levels are colored in orange or blue, respectively. Pathway maps for four functional pathway groups (g1–4) are provided, which include 376 ‘signal transduction’ pathway maps (Figure 2B).
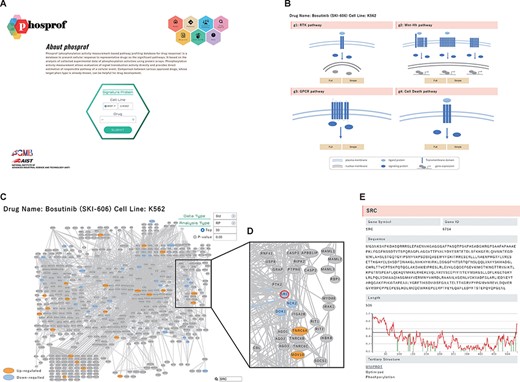
‘Signature Protein’ section. (A) Phosprof top page. Proteins with significant change in phosphorylation level can be browsed by choosing the tested cell type (MCF7 or K562) and treated drug. (B) Signature proteins are highlighted on a pathway map. The 376 analyzed pathways were divided into four functional groups (g1: RTK pathway; g2: Wnt–Hh pathway; g3: GPCR pathway and g4: Cell Death pathway), according to the Reactome classification. (C) Signature proteins of K562 cells under treatment with the SRC inhibitor bosutinib. Data type (Std: standardized data or Raw: raw data), analysis type (RP: rank products or Pearson) and thresholds (Top 50/100/150/200 or P-value) can be selected. (D) Enlarged view after searching for SRC on the pathway map. (E) The nodes of the pathway map are linked to the ‘details of the protein’ page. Detailed information includes the gene symbols, amino acid sequences and the disorder scores. This page is also connected to the PDB web site and the protein tertiary structures.
For example, the signature proteins for the Proto-oncogene tyrosine-protein kinase (SRC)/Abl kinase inhibitor bosutinib (17, 18) can be browsed in the RTK pathway group. This pathway group includes SRC, the target of bosutinib, and the related signaling molecules (Figure 2C and D). In K562 cells, eight known tyrosine substrates of SRC (annotated in PhosphositePlus) were included in the top 50 signature proteins downregulated by bosutinib. Each node in a pathway map represents a signaling molecule. A list of significant pathways that include the protein of interest can be visualized by hovering the cursor over the node. The nodes are directed to the ‘Details of Protein’ page (Figure 2E). Detailed information includes their gene symbols, amino acid sequences and the disorder scores obtained using IUPred (15). This page is also connected to the PDB web site via UNIPROT ID and links to the protein tertiary structures with PDB IDs to guide the sequence–structure relationship in the proteins. The tertiary structure of the PDB ENTITY with the longest sequence was selected and visualized using Mol* viewer web application (19). Tyrosine residues in the structure are displayed as a ball-and-stick model (Section 2.4 Supplementary Material).
Pathway
Based on the distribution of the signature proteins, we estimated the significance of the 376 pathways by enrichment analysis. Significant pathways are colored on the hierarchical tree in the ‘Pathway’ section (Figure 3A) and provide means to review the analysis results in the interconnected pathways. The pathway hierarchy was constructed according to Reactome, and each pathway node is linked to the original Reactome site to provide more detailed information. In the pathway hierarchy, significant pathways with upregulated (Up), downregulated (Down) or both (UpDown) signatures are colored in orange, blue or both, respectively. The pathways of the higher stratum of the significant pathways are displayed in a paler shade of their respective color.
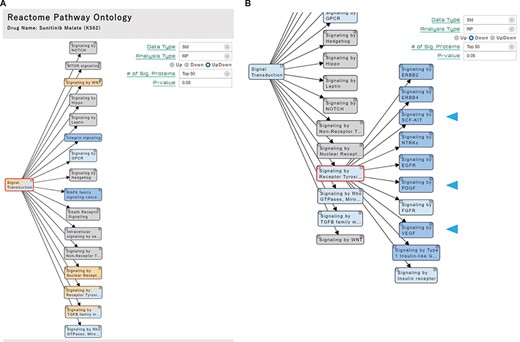
‘Pathway’ section. (A) Significant pathways with Up, Down or both (UpDown) signatures are displayed in the tree form, according to the pathway ontology classification of Reactome. The number of signature proteins for pathway analysis can be selected (top 50/100/150/200 or P-value < 0.05). (B) The multi-targeted RTK inhibitor sunitinib malate downregulates the ‘Signaling by Receptor Tyrosine Kinases’ pathways, including the drug target-related pathways (arrowhead).
For example, significant pathways of the cells treated with sunitinib malate, a multi-targeted RTK inhibitor of Vascular endothelial growth factor receptor 2 (VEGFR2), Platelet-derived growth factor receptor beta (PDGFRβ) and Tyrosine-protein kinase Kit (KIT) (20), are shown in pathway hierarchy tree in the ‘Pathway’ section (Figure 3A). We confirmed that their known target-related pathways (signaling by Stem cell factor (SCF)-KIT, Platelet-derived growth factor (PDGF), and Vascular endothelial growth factor (VEGF)) are shown to be downregulated under the pathway node of ‘Signaling by Receptor Tyrosine Kinase (RTK)’ on the hierarchal tree, when the significant pathways with downregulated signatures are selected (Figure 3B, blue arrowhead).
Pathway comparison
To examine the functional similarities and differences of the 94 drugs, significant pathways of selected drugs were compared and displayed in a Venn diagram in the ‘Compare Pathway’ section. Here, significant pathways among five or fewer drugs of interest can be compared with variable thresholds. For example, the significant pathways of five RTK inhibitors (axitinib, sunitinib malate, orantinib, CP673451 and dacomitinib) (20–24) were compared (Figure 4). A Venn diagram of the significant pathways with upregulated and/or downregulated signatures is provided. Of the 16 pathways of the higher pathway stratum (pathway stratum = 2), the ‘Signaling by Receptor Tyrosine Kinases’ pathway was commonly downregulated in K562 cells by all of those five drugs (Figure 4A). In the lower pathway stratum (pathway stratum = 3), ‘Signaling by VEGF’ was commonly downregulated by axitinib, sunitinib malate and orantinib, and ‘Signaling by PDGF’ was downregulated by sunitinib malate, orantinib and CP673451, which is consistent with the known drug functions (Figure 4B). PDGFR is a target molecule of axitinib, but ‘Signaling by PDGF’ was not observed to be significant in these analysis conditions. This may be because axitinib is more specific for VEGFRs (The half maximal inhibitory concentration (IC50) = 0.1–0.3 nM) than for PDGFRB (1.6 nM) (21). Similarly, cellular responses to different drugs can be compared in the context of pathways at various levels of pathway hierarchy.
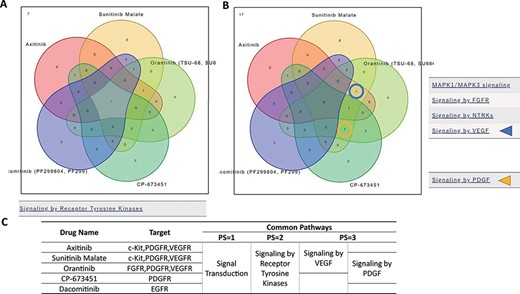
‘Compare Pathway’ section. Five inhibitory drugs of the protein tyrosine kinase pathway were selected. (A) In the higher pathway hierarchy (pathway stratum = 2), five drugs commonly downregulated the ‘Signaling by Receptor Tyrosine Kinases’. (B) At lower pathway hierarchy, five drugs showed various specificities for pathway activities. (C) The drug information and common pathway results are summarized.
Drug search
All the 94 drugs examined in Phosprof are listed in the ‘Drug List’ section with detailed information, including the formulas, Chemical Abstracts Service Registry Numbers (CAS) and SMILES, and are linked to the PubChem site (25). Other compounds can be searched for the phosphorylation profile of drugs with molecular similarity in the ‘Drug Search’ section. By entering the SMILES or Structure Data File (SDF) of a compound of interest, similarity indexes with the 94 drugs are provided as Tanimoto coefficient scores. For example, compounds similar to gamma-aminobutyric acid (GABA) were searched using its SMILES form. GABA is an inhibitory neurotransmitter whose proper regulation is necessary for normal neural functions (26). Using GABA as a query, gabapentin and gabapentin HCl were identified to have relatively high Tanimoto coefficient scores (Figure 5A). Gabapentin is a GABA analog used to treat seizures and neuropathic pain (27, 28). The ‘Product name’ is linked to the ‘Signature Protein’ section for the corresponding drug (Figure 5B).
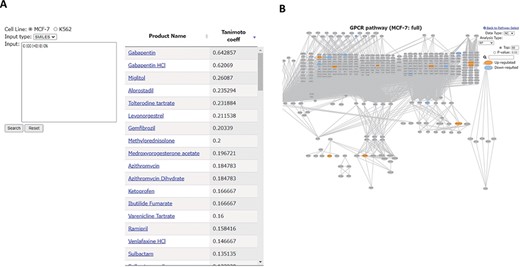
‘Drug Search’ tool. (A) Similarity search for GABA (SMILES: C(CC(=O)O)CN). Product names of similar drugs in Phosprof are listed with the Tanimoto coefficient score. (B) Product Name in the list (A) is linked to the Signature Protein section.
Discussion
We measured phosphorylation profiles of drug-treated cells using protein arrays and visualized the results of their pathway analysis. Pathway analysis of signal transduction has been extensively performed using microarrays or sequencing data (29, 30). Because signal transduction usually occurs through interconnected pathways that have multiple paths for various signals (31), it becomes challenging to precisely define pathways responsible by analyzing gene expression data, which are the final output of signal transduction processes. Pathway analysis using phosphorylation profiles is beneficial to examine the molecular bases of signal transduction from a different viewpoint.
In this study, we presented a new database involving a new dataset of cells treated with 94 drugs whose major target molecules or pathways are known. In the ‘Signature Protein’ section, we provided our analyzed results on pathway maps, and we showed that the phosphorylation level of the target protein SRC was significantly downregulated upon treatment with the SRC/Abl kinase inhibitor bosutinib. Based on the distribution of these signature proteins, we performed pathway analysis and showed the results in the ‘Pathway’ section. In this section, we confirmed that the pathways related to the known target of the multi-targeted RTK inhibitor sunitinib malate are downregulated under the RTK pathway node on the hierarchal tree.
Comparison of significant pathways between different drugs allowed the investigation of common and unique pathways affected under the corresponding drug response. Given that the pathways are interconnected and functionally related, we compared the list of significant pathways for different drugs in various levels of pathway hierarchy. We visualized the results using a Venn diagram in the ‘Compare Pathway’ section. We validated that the resultant common or unique pathways of the selected RTK inhibitors are associated with the known functional similarities or differences of these drugs. This would be helpful to examine the relationships of the input (drug) and output (functional or adverse effects) of signal transduction processes in future studies. In the ‘Drug Search’ section, one can search for predicted phosphorylation profiles based on drug similarity and use the information for functional analysis of analog-based designed drugs.
Collectively, Phosprof provides drug response profiles by analyzing the signal transduction activity at the pathway level. It is expected to help better understand different drug responses by providing additional insights into multi-omics data studies. We present a unique measurement and analysis strategy that differs from proteomics with mass spectrometry and aims for ‘fine omics’ in phosphorylation, keeping comprehensiveness in mind to fill the knowledge gap among the conventional omics analysis layers.
Supplementary data
Supplementary data are available at Database Online.
Acknowledgements
We thank K. Suzuki for technical assistance with web site preparation.
Funding
Japan Agency for Medical Research and Development (21ae0101074s0203); Life Science Database Integration Project of the Japan Science and Technology Agency (to K.F., in part).
Conflict of interest
The authors declare that they have no conflicts of interest.
Data availability
Phosprof is available at https://phosprof.medals.jp.
