


Abstract
The UK Biobank (UKB), a large-scale biomedical database that includes demographic and electronic health record data for more than half a million ethnically diverse participants, is a potentially valuable resource for the study of health disparities. However, publicly accessible databases that catalog health disparities in the UKB do not exist. We developed the UKB Health Disparities Browser with the aims of (i) facilitating the exploration of the landscape of health disparities in the UK and (ii) directing the attention to areas of disparities research that might have the greatest public health impact. Health disparities were characterized for UKB participant groups defined by age, country of residence, ethnic group, sex and socioeconomic deprivation. We defined disease cohorts for UKB participants by mapping participant International Classification of Diseases, Tenth Revision (ICD-10) diagnosis codes to phenotype codes (phecodes). For each of the population attributes used to define population groups, disease percent prevalence values were computed for all groups from phecode case–control cohorts, and the magnitude of the disparities was calculated by both the difference and ratio of the range of disease prevalence values among groups to identify high- and low-prevalence disparities. We identified numerous diseases and health conditions with disparate prevalence values across population attributes, and we deployed an interactive web browser to visualize the results of our analysis: https://ukbatlas.health-disparities.org. The interactive browser includes overall and group-specific prevalence data for 1513 diseases based on a cohort of >500 000 participants from the UKB. Researchers can browse and sort by disease prevalence and prevalence differences to visualize health disparities for each of the five population attributes, and users can search for diseases of interest by disease names or codes.
Database URLhttps://ukbatlas.health-disparities.org/
Introduction
Health disparities can be defined in the most straightforward way as differences in health outcomes between groups of people, where the groups can be delineated in a variety of ways. The etiology of these differences in outcomes is multifactorial, with contributions from a combination of biological (genetic), social and environmental risk factors (1). The ready availability of information on health disparities can aid investigators and policymakers in identifying areas of research and/or interventions where possible.
Biobanks, being repositories of large amounts of demographic and clinical data, are ideally suited for characterizing health disparities (2, 3). The UK Biobank (UKB) is one of the largest and most mature biobanks that are available to researchers worldwide (4, 5). Accordingly, the UKB offers an unprecedented opportunity to characterize the landscape of health disparities in the UK. Given the diverse, cosmopolitan nature of the population of the UK, with numerous immigrants from different Commonwealth countries, characterizing disparities using the UKB can support efforts to improve health equity for underserved minority populations.
We developed the UKB Health Disparities Browser as a means for researchers to explore the landscape of health disparities in the UK for groups defined by age, country of residence, ethnicity, sex and socioeconomic deprivation (SED). The browser includes prevalence data for 1147 diseases based on a cohort of >500 000 participants from the UKB. Users can browse and sort by disease prevalence and prevalence differences to visualize health disparities for each of these four groups, and users can search for diseases of interest by disease names or codes.
Materials and Methods
Study cohort
We used participant data from the UKB, a prospective cohort study set up to investigate the lifestyle, environmental and genetic determinants of a wide variety of diseases of adulthood (4). The study recruited >500 000 participants aged between 40 and 70 years between 2006 and 2010 (Supplementary Table S1). Participant data include completed questionnaires, nurse-led interviews, biological samples and deep clinical data gleaned from electronic health records.
Population attributes and comparison groups
We used the following participant data fields from UKB data: (i) age (Field 21003: age when attended assessment center) (6), (ii) assessment center (Field 54: UKB assessment center) (7), (iii) ethnic group and background (Field 21000: ethnic background) (8), (iv) International Classification of Diseases, Tenth Revision (ICD-10) codes (Field 41270: diagnoses—ICD10) (9), (v) sex (Field 31: sex) (10) and (VI) Townsend deprivation index (Field 189: Townsend deprivation index at recruitment) (11). Investigators from the UKB invited participants who lived within 25 miles of one of the 22 recruitment centers located across England, Scotland and Wales. Accordingly, we used the location of a participant’s assessment center to determine their country of residence. We used the Townsend index of deprivation as a measure of SED. The Townsend index is a widely used, composite metric that incorporates (I) unemployment, (II) non-car ownership, (III) non-home ownership and (iv) household overcrowding in a given area (12). A higher value of the Townsend index indicates higher material deprivation and a lower value indicates relative affluence. A detailed description of these UKB data fields can be found on the UKB data showcase at https://biobank.ndph.ox.ac.uk/showcase/.
Comparison groups were defined for each of the five population attributes studied here: age, country of residence, ethnic group, sex and SED. For age, participants were partitioned into four groups based on their age at recruitment (35–44, 45–54, 55–64 and 65–74 years old). For the country of residence, three groups were created (England, Scotland and Wales; the UKB did not have recruitment centers in Northern Ireland). For ethnicity, the initial UKB assessment questionnaire asked participants to identify as belonging to one of the six ethnic groups (Asian, Black, Chinese, Mixed, White or Other), and participants’ self-identified ethnic groups were used for disease prevalence comparisons. Chinese is included as a distinct ethnic group compared to Asian, which includes individuals of Bangladeshi, Indian and Pakistani origin, following the convention of the UK National Health Service (NHS) and the classification provided by the UKB. The NHS makes this distinction owing to cultural, socioeconomic and ancestry differences between the larger South Asian and smaller East Asian immigrant groups in the UK. For sex, males and females were compared. For SED, the participants were divided into five equal groups using the Townsend index of deprivation quintiles.
Phenotype case–control cohorts
We used the UKB participants’ ICD-10 diagnosis codes taken from UKB Field 41270 to define case–control cohorts using the phecode scheme defined by the PheWAS consortium (13, 14). The ICD-10 codes include all distinct diagnosis codes that a participant has recorded across all of their hospital inpatient records, either in the primary or secondary position. ICD-10 codes for closely related diagnoses are aggregated into individual phecodes, each of which represents a single disease or health condition. Each phecode has an inclusion criterion that covers all ICD-10 codes corresponding to a single disease or health condition and an exclusion criterion that eliminated ICD-10 codes corresponding to closely related conditions. This approach enables the delineation of clearly distinct case–control cohorts for each individual disease or health condition in the phecode scheme. Individual phecodes have been manually curated and validated by physicians and experts. Disease cohorts that had <100 cases were excluded from the analysis for privacy reasons. Phecode case–control cohorts were curated for a total of 1147 diseases or health-related conditions after removing phecodes with ICD10 codes that are suppressed for diseases with <100 cases, are considered contentious or refer to protected characteristics, following UKB governance guidelines (Supplementary Table S2).
Disease prevalence and quantifying disparities
The crude prevalence for each of the 1147 diseases was calculated for the overall cohort, and each individual group was defined by the population attributes under consideration. We used crude prevalence, without controlling for age and sex, since our disparity browser includes comparisons between groups defined by age and sex. Crude prevalence was calculated as follows:
where |${N_{cases}}$| refers to the number of cases and |${N_{controls}}$| refers to the number of controls.
For each population attribute under consideration, we calculated the range of prevalence values for each of the constituent groups as follows:
where |${\rm{Pre}}{{\rm{v}}_{{\rm{Disease}}}} = \left[ {Prev}_{Disease}^{Group1},{Prev}_{Disease}^{Group2},{Prev}_{Disease}^{Group3},\right.$||$\left. \ldots \right]$| along with calculating the ratio of the range of prevalence values as follows:
Taken together, these two metrics enable the identification of health disparities for high-prevalence diseases (using the |${\rm{Range}}\,\,{\rm{difference}}$|) and for those diseases with low overall prevalence values (using |${\rm{Range}}\,\,{\rm{ratio}}$|). On plotting these two metrics orthogonally, we computed a unified disparity score defined as the Euclidean distance from the origin as follows:
Within a population attribute, a relative disease burden was calculated for each group as follows:
where |${RDB}_{Group}$| refers to group-specific relative disease burden, |$NMax_{Group}$| refers to the number of phenotypes where |${Group}$| has the highest prevalence and |${\rm{NullAvg}}$| refers to the null expectation calculated as |$\frac{1147}{N_{Groups}}$| (|${N_{Groups}}$| is the number of groups for that population attribute). An |${RDB}_{Group}$| value of 0 would mean that the Group in question has the highest prevalence for exactly |${\rm{NullAvg}}$| diseases. A high positive value would represent a disproportionately high burden of disease for the subpopulation |${\rm{Group}}$|, while a negative value would indicate a disproportionately low burden of disease.
Interactive web server
Data processing and analysis were done using the Pandas library in Python (15). Plots were made using the ggplot2 library (16) in the R statistical language v3.6.1 (17). The interactive webserver was developed using the Plotly Dash framework (18).
Results
Health disparities across population attributes
Overall, we had information on the following population attributes for 501 117 participants from the UKB: age, country of residence, ethnic group, sex and SED (Table 1). Most of our analysis cohort falls primarily between the ages of 55 and 64 years (42.3%), resides in England (88.7%), identifies as belonging to the White ethnic group (94.2%) and is female (54.4%) (Supplementary Table S1). Leveraging the phecode schema (14), which specifies ICD-10 diagnosis codes and inclusion and exclusion criteria for phenotypes, we generated 1147 case–control cohorts. For each of the case–control cohorts, we calculated the prevalence of disease in groups defined by the five population attributes under consideration. Next, health disparities were quantified as the difference and ratio of the range of disease prevalence among groups defined by population attributes under consideration (Figure 1; Supplementary Figures S1–S4). The two metrics employed—range difference and range ratio—were combined into a single, comparable metric by computing the Euclidean distance from the origin in a space parametrized by these two parameters. On comparing different population attributes, we find that ethnic groups show the greatest overall disease disparities (median disparity score: 2.62), followed by age (median disparity score: 1.63), country of residence (median disparity score: 0.86), SED (median disparity score: 0.70) and sex (median disparity score: 0.66) (Figure 2).
UKB cohort table
| Characteristics | Number (%) |
|---|---|
| Complete cohort | 501 117 |
| Age | |
| 35–44 | 51 559 (10.3) |
| 45–54 | 141 971 (28.3) |
| 55–64 | 211 796 (42.3) |
| 65–74 | 95 791 (19.1) |
| Country of residence | |
| England | 444 618 (88.7) |
| Scotland | 35 739 (7.1) |
| Wales | 20 760 (4.1) |
| Ethnic group | |
| Asian | 9866 (2.0) |
| Black | 8046 (1.6) |
| Chinese | 1569 (0.3) |
| Mixed | 2957 (0.6) |
| Other | 6422 (1.3) |
| White | 472 257 (94.2) |
| Sex | |
| Female | 272 683 (54.4) |
| Male | 228 434 (45.6) |
The numbers and percentages of UKB participants for each population (sub)group analyzed here are shown.
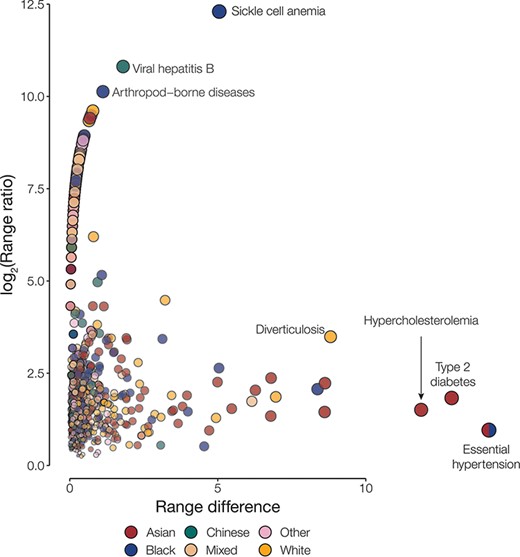
Disease disparities for ethnic groups. Disparities are quantified by the range ratio (y-axis) and the range difference (x-axis) as described in the Methods section. Each point is a disease phenotype and is colored to indicate the ethnic groups with the highest prevalence for that phenotype. The size and opacity of each point are scaled by the Euclidean distance from the origin.
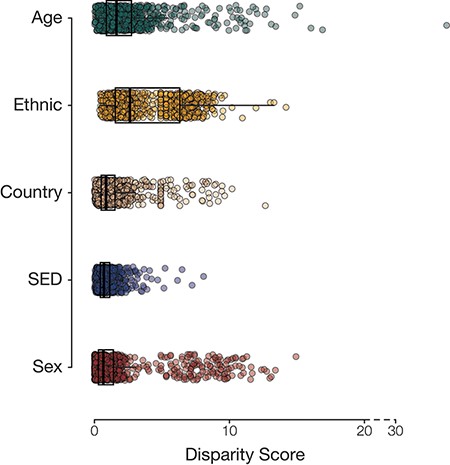
Population group disease disparity scores. The distributions of disease disparity scores for each population group attribute are shown. Each point is a disease phenotype plotted with its group-specific disparity score.
Health disparities among groups defined by population attributes
To identify groups with disproportionately high disease prevalence across phenotypes, we quantified the relative disease burden for groups defined by each population attribute (Figure 3). This was done by calculating the deviation from the number of times a group had the highest prevalence of disease phenotypes compared to the null hypothesis of equally distributed disease prevalence. Among the groups defined by age, we find that participants aged between 65 and 74 years had the highest relative burden of disease (1.27), while those aged between 45 and 54 years seemed to have the lowest burden of disease (−0.71) in our analysis cohort. For groups defined by country of residence, those residing in England had the highest relative burden of disease (0.91) and those residing in Scotland had the lowest (−0.51). Those identifying as belonging to the Asian ethnic group had the highest relative burden of disease (0.52), while those identifying as Chinese had the lowest (−0.47). We see that the most socioeconomically deprived quintile of participants (Q5) has the highest relative burden of disease (2.00), while those in the third quintile seem to have the lowest (−0.69). We also find that females have a higher relative burden of disease (0.05) compared to males (−0.05); however, the difference for sex was comparatively small.
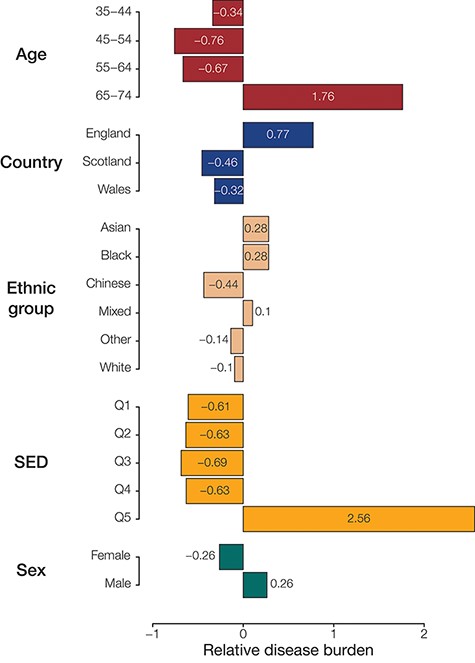
Population (sub)group disease burdens. Relative disease burden values are shown for population groups’ constituent subgroups.
We identified the most disparate disease for groups defined by each population attribute under consideration (Table 2). We find that essential hypertension is a large health disparity across four out of the five population attributes studied here. Type 2 diabetes and hypercholesterolemia also stand out as showing disparate prevalence values across multiple population attribute groups. Prevalence values for each group defined by the different population attributes under consideration, along with the disparity metric, can be accessed using the interactive browser.
Disease disparities by population groups
| Rank | Phenotype | Range difference | Log2 (range ratio) | Overall prevalence | Group with maximum prevalence |
|---|---|---|---|---|---|
| Age | |||||
| 1 | Essential hypertension | 33.67 | 2.72 | 22.51 | 65–74 |
| 2 | Hypercholesterolemia | 16.60 | 3.14 | 9.98 | 65–74 |
| 3 | Diverticulosis | 14.89 | 3.11 | 9.40 | 65–74 |
| 4 | Cataract | 12.70 | 4.36 | 5.45 | 65–74 |
| 5 | Other mental disorders | 11.35 | 1.92 | 9.40 | 65–74 |
| Country | |||||
| 1 | Essential hypertension | 12.61 | 1.11 | 22.51 | England |
| 2 | Other mental disorder | 9.54 | 3.82 | 9.40 | England |
| 3 | Hypercholesterolemia | 7.91 | 1.94 | 9.98 | Wales |
| 4 | Arthropathy NOS | 6.44 | 2.19 | 7.70 | England |
| 5 | Allergy/adverse effects of penicillin | 5.39 | 2.37 | 4.90 | Wales |
| Ethnic group | |||||
| 1 | Essential hypertension | 14.16 | 0.96 | 22.51 | Asian |
| 2 | Type 2 diabetes | 12.90 | 1.83 | 5.95 | Asian |
| 3 | Hypercholesterolemia | 11.87 | 1.51 | 9.98 | Asian |
| 4 | Sickle cell anemia | 5.05 | 8.98 | 0.10 | Black |
| 5 | Diverticulosis | 8.81 | 3.49 | 9.40 | White |
| SED | |||||
| 1 | Tobacco use disorder | 7.88 | 1.80 | 5.78 | Q5 |
| 2 | Essential hypertension | 6.12 | 0.38 | 22.51 | Q5 |
| 3 | Type 2 diabetes | 5.08 | 1.15 | 9.24 | Q5 |
| 4 | Other mental disorders | 5.08 | 0.76 | 12.41 | Q5 |
| 5 | Hypercholesterolemia | 4.63 | 0.64 | 12.87 | Q5 |
| Sex | |||||
| 1 | Hyperplasia of prostate | 7.55 | 9.56 | 3.36 | Male |
| 2 | Uterine leiomyoma | 5.21 | 9.02 | 2.81 | Female |
| 3 | Postmenopausal bleeding | 4.74 | 8.89 | 2.47 | Female |
| 4 | Excessive or frequent menstruation | 4.57 | 8.84 | 2.37 | Female |
| 5 | Cancer of prostate | 4.22 | 8.72 | 1.84 | Male |
The five topmost disparate diseases for each group are shown. Disparity metrics—range difference and range ratio—are defined in the Methods section.
Interactive health disparities browser
The interactive browser was developed using the Model-View-Controller software design paradigm (19), which divides the program logic into three interconnected elements: the ‘Model’, the ‘View’ and the ‘Controller’. This separation allows for easier management of the front- and backend components of the browser. In the Model-View-Controller framework, the ‘Model’ represents the data structures and databases that are queried, the ‘View’ represents the user interface and the ‘Controller’ represents the mediator between these two components (Figure 4).
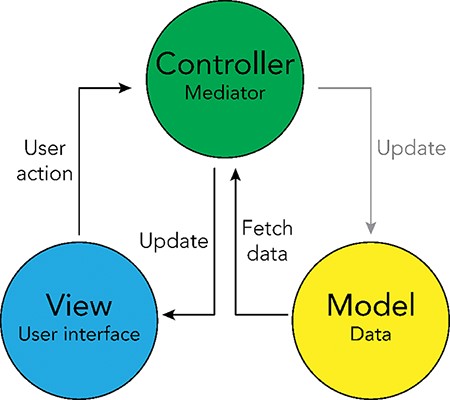
Model-View-Controller (MVC) software design pattern used for the UKB Health Disparities Browser. The schematic showing the MVC software design pattern used to develop the interactive web server. Parts of the pattern that are not applicable to the current browser are grayed out.
The browser allows researchers to identify health disparities among groups based on the population attribute of their choice. The browser displays disease prevalence values for each group defined using the chosen population attribute, sorted by the disparity score (Figure 5A). There is another table that will help users select disease phenotypes by prevalence in groups (Figure 5B). The tables with information on disease prevalence can be sorted using any of its columns and also allow for keyword searches. The summary statistics data underlying the browser can be accessed from the GitHub repository: https://github.com/healthdisparities/UKB-Disparity-Atlas.
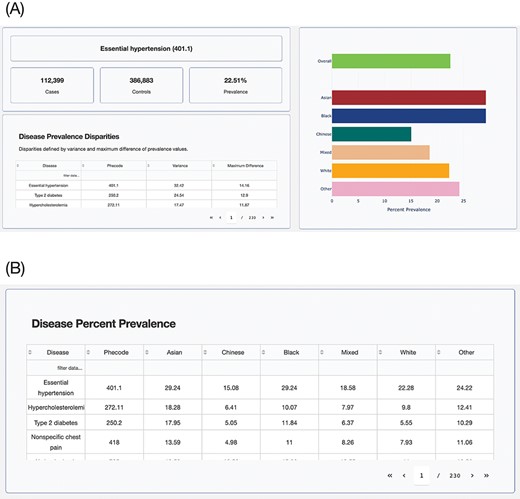
UKB Health Disparity Browser. Screenshots of the UKB Health Disparity Browser showing (A) disease phenotype prevalence for different ethnic groups sorted by disparity score and (B) table of disease prevalence for each ethnic group.
Discussion
Here, we describe the landscape of health disparities in the UKB participant cohort. We find marked disparities in disease prevalence for UKB participants defined by age, country of residence, ethnic group, sex and SED. Overall, ethnicity has the greatest effect on disease disparities, with the Asian group (Bangladeshi, Indian and Pakistani) showing the highest levels of disease prevalence and the Chinese group showing the lowest levels of disease prevalence. Coronary atherosclerosis and non-specific chest pain were detected as disparities specific to the Asian group. Sickle cell anemia and uterine leiomyoma were detected as disparities specific to the Black ethnic group; melanomas of the skin and diverticulosis showed relatively high prevalence in the White ethnic group. Older age and high SED were both associated with a relatively high burden of disease as expected. England showed a relatively high burden of disease compared to Wales and Scotland, which had the lowest country-specific disease burden. This seems to be attributed to higher SED for participants recruited from England compared to those from Wales and Scotland. Sex shows the lowest overall levels of disease disparities, and the largest disease disparities for this group are seen for sex-specific conditions, such as prostate cancer and uterine leiomyoma, as can be expected. Essential hypertension, hypercholesterolemia and type 2 diabetes show high prevalence differences across most population group attributes, whereas mental disorders show disparities for country of origin and SED.
Sampling bias represents one potential limitation of this study. UKB participants are generally healthier and wealthier than the general population, and this ‘healthy volunteer’ bias could affect the disease prevalence and disparity estimates reported here (20). Thus, the external validity of the results reported here, with respect to their correspondence to the general UK population, may vary by disease and population group. Notwithstanding this caveat, the health disparities landscape browser developed here should serve as a useful resource to guide follow-up studies of both the UKB cohort and the general UK population.
Supplementary material
Supplementary material is available at Database online.
Funding
Georgia Tech Bioinformatics Graduate Program to S.D.N.; IHRC-Georgia Tech Applied Bioinformatics Laboratory (Award Number: RF383) to I.K.J.; Division of Intramural Research of the National Institute on Minority Health and Health Disparities at the National Institutes of Health (Award Numbers: 1ZIAMD000016 and 1ZIAMD000018) to L.M.-R.; National Institutes of Health Distinguished Scholars Program to L.M.-R.; and UKB Resource (Application Number 65206).
Data availability
UK Biobank data are made publicly available pending researcher application to the Acceess Management System (AMS). Summary statistics for this article are available at https://github.com/healthdisparities/UKB-Disparity-Atlas.
Conflict of interest
The authors declare no conflict of interest.
