


Abstract
Drosophila melanogaster is a well-established model organism that is widely used in genetic studies. This species enjoys the availability of a wide range of research tools, well-annotated reference databases and highly similar gene circuitry to other insects. To facilitate molecular mechanism studies in Drosophila, we present the Predicted Drosophila Interactome Resource (PDIR), a database of high-quality predicted functional gene interactions. These interactions were inferred from evidence in 10 public databases providing information for functional gene interactions from diverse perspectives. The current version of PDIR includes 102 835 putative functional associations with balanced sensitivity and specificity, which are expected to cover 22.56% of all Drosophila protein interactions. This set of functional interactions is a good reference for hypothesis formulation in molecular mechanism studies. At the same time, these interactions also serve as a high-quality reference interactome for gene set linkage analysis (GSLA), which is a web tool for the interpretation of the potential functional impacts of a set of changed genes observed in transcriptomics analyses. In a case study, we show that the PDIR/GSLA system was able to produce a more comprehensive and concise interpretation of the collective functional impact of multiple simultaneously changed genes compared with the widely used gene set annotation tools, including PANTHER and David. PDIR and its associated GSLA service can be accessed at http://drosophila.biomedtzc.cn.
Introduction
Drosophila melanogaster, also known as the fruit fly, is one of the most commonly used model organisms and has been widely studied for more than a century (1, 2). The short life cycle of 12 days, ease of maintenance, low cost and abundance of genetic tools in Drosophila have made it a leading model in genetics research. In addition to insects, Drosophila shares many features, genes and pathways with mammalian systems (1). It has also been widely used for research in development (3), brain disease (4) and cancer treatment (5).
Today, the omics technology has been extensively used for molecular mechanism studies (6–8). The availability of abundant and complicated omics data brings both an unprecedented opportunity to comprehensively describe the physiological status of study subjects at the molecular level and, at the same time, an unparalleled challenge to elucidate the underlying design logic of the physiological processes from these comprehensive molecular-level descriptions.
To address this challenge, many approaches have been developed to derive high-level biological senses from the omics data. These approaches typically rely on the identification of a set of simultaneous changed genes (changed gene set, CGS) between two physiological statuses and then use an enrichment-based method to evaluate whether a CGS has an enriched representation of a gene set that defined a biological process. The widely used enrichment-based gene set annotation tools include PANTHER (9), KEGG (10) and DAVID (11).
In essence, this strategy summarizes the observed CGS into established biological concepts. This strategy is successful in many cases; however, in some cases where no established biological concepts can be found to accurately describe the change, enrichment-based approaches frequently report no annotation term or conceptually very general terms (such as GO:0008152, metabolic process) are found. Such results provide little value to elucidate the design logic of physiological processes and formulating further hypotheses to achieve effective control over desired traits.
On the other hand, when no established biological concepts may accurately describe the observed CGS, we still may use established concepts to describe the functional impacts of the CGS. For example, observed CGS may collectively lead to GO:0048867 (stem cell fate determination), even when the CGS genes are not enriched with these terms (for details, see ‘Discussion’). One way to implement this analysis strategy is to evaluate whether the observed CGS has strong functional associations with established biological process gene sets. If genes in the CGS have frequent functional associations with genes representing a biological function, the CGS is expected to interfere with this biological function. We call this strategy gene set linkage analysis (GSLA), which has been successfully used in human and Arabidopsis transcriptome interpretation (12, 13). GSLA works for these two species because high-quality functional association gene networks exist (13, 14).
In this study, we present a high-quality functional association gene network for Drosophila, the Predicted Drosophila Interactome Resource (PDIR), and its associated GSLA web tool. PDIR integrates six types of evidence for functional gene association from public databases with timestamps before 2018. The accuracy of inferred functional associations in PDIR was assessed using protein interactions recently reported after 2018. The current version of PDIR includes 102 835 gene associations, which are expected to cover ~22.6% protein–protein interactions of Drosophila. ~50.5% of these functional associations are expected to represent protein–protein interactions. PDIR provides a web interface for users to query these functional associations between individual genes, as well as a GSLA web tool for users to interpret the collective functional impact of multiple simultaneously changed genes. We also present a case study to illustrate the use of PDIR/GSLA.
Materials and Methods
Source data
To train the prediction model, six types of evidence suggesting functional associations between genes were collected from seven public databases before 2018, which include 11 937 expression profiles (Coxpresdb), 97 220 gene annotations (Gene Ontology Consortium, GOC), 60 368 domain interactions (IDDI and Pfam), 31 278 subcellular gene localizations (Compartments), 17 737 phylogenetic profiles (DIOPT) and 5628 Drosophila proteins and proteins from Arabidopsis thaliana, Caenorhabditis elegans, Homo sapiens, Mus musculus, Rattus norvegicus, Saccharomyces cerevisiae and Schizosaccharomyces pombe to compute interologs.
Protein–protein interactions were considered to be a strong evidence of functional associations. In this study, we attempt to predict functional associations that are as strong as protein interactions (14). A total of 155 871 experimentally reported Drosophila protein–protein interactions were collected from three public databases, including BioGRID (15), IntAct (16) and FlyBase (17) (Supplementary Table S1). To ensure the reliability of example interactions, we removed those reported in less than two independent studies and those reported only in high-throughput experiments. This filtering resulted in 4434 high-confidence protein–protein interactions (Supplementary Table S1). For the prediction of functional gene associations with uniform gene ID, we used Uniprot (15) and BioMart (16) software to convert different gene IDs to FlyBase ID (Figure 1).
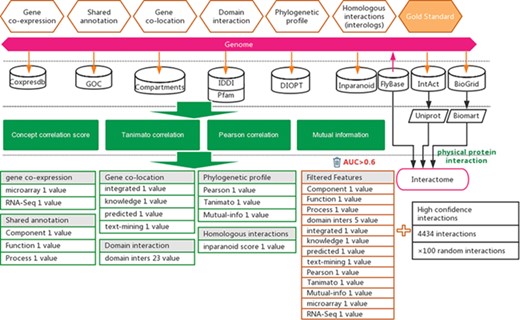
Workflow for the inference of functional interactions between Drosophila genes. High-quality experimental reported protein interactions were integrated from three databases and were used as positive examples. Six types of functional association evidence from 10 databases were collected to infer putative functional interactions. A total of 17 high-quality feature values were selected from 36 feature values that characterize this evidence with different mathematical representations. Random gene pairs after removing positive examples were used as negative examples. The number of negative examples was 100 times that of the positive examples.
Feature value computation
Thirty-six mathematical characterizations were used to compute the feature values from the data collected above. The detailed equations can be found in the PDIR website. In total, 3 shared annotation features, 2 co-expression features, 4 subcellular co-localization features, 23 domain interaction features, 3 phylogenetic profile features and 1 homologous interaction feature resulted in Supplementary Table S3.
Evaluation of feature values
The area under the curve (AUC) of the receiver operating characteristic (ROC) test was used to evaluate the quality of feature values to suggest functional associations. By applying different cut-offs, each feature value produced a series of sensitivities and specificities when it was used to predict protein interactions, evaluated using our training dataset (data before 2018). The sensitivities and specificities corresponding to different cut-offs were plotted as the ROC curve (X-axis, 1-specificity; Y-axis, sensitivity). Feature values with AUC less than 0.6 were considered not informative to indicate strong functional associations and were removed (Supplementary Figure S1).
Website construction
The PDIR database runs on LNMP, which is an integrated running environment, including Linux, Nginx, MySQL and PHP. The MySQL database is used for data storage, maintenance and operation. The interaction interface is developed with the Laravel framework based on PHP. The front-end of PDIR is a Vue.js-based single page application (SPA). Vue.js is an open-source JavaScript framework for interface creation and a web application framework compatible with SPA. The functional association network is visualized with Cytoscape (17).
Microarray data analysis
We retrieved the microarray dataset GSE99071 from the GEO database (18). The original research indicated that approximately 1000 genes showed differential expression (up- or down-regulated) in the Apc1 mutant (Apc1Q8, also referred to as Apc1−/−) relative to the wild type (w1118). Three biological repeats were performed for both the Apc1 mutant and the wild type. These expression profiles were re-analyzed using the online GEO2R tool with default parameters. The top 250 transcriptionally changed genes were selected based on adj.P. Val (P-value after the adjustment for multiple testing).
Results
Integration of data for the prediction of functional associations between Drosophila genes
Experimentally reported protein–protein interactions in Drosophila (D. melanogaster) were collected from three databases, i.e. BioGRID (19), IntAct (20) and FlyBase (21) (Figure 1 and Supplementary Table S1). These interactions were further filtered by supporting evidence provided in each database, keeping only experimentally confirmed interactions (Figure 1). The resulting dataset of high-confidence protein interactions was used as positive examples in training the prediction model (Supplementary Table S1).
In addition to protein–protein interactions, six types of other evidence suggesting functional associations between genes from different biological perspectives were collected from seven databases, which include Coxpresdb (22), GOC (23), Compartments (24), IDDI (25), Pfam (26), DIOPT (27) and Inparanoid (28) (Figure 1). Using different mathematical characterizations, 36 feature values were derived from these six types of evidence to characterize the strength of functional association suggested by each type of evidence (Supplementary Table S2).
Not all feature values are expected to provide equal amount of information to suggest functional associations between genes. To increase the signal-to-noise ratio in the later functional association prediction step, we removed features that did not show a strong correlation to functional associations. The ROC curve was used to assess the capability of a feature to indicate protein interactions. In this study, protein interactions were considered a strong type of functional association (13). Seventeen features with AUC greater than 0.6 were selected for use (Supplementary Table S3 and Supplementary Figure S1).
Prediction of functional associations between genes
The libSVM package was used to train and predict functional associations (29, 30) (Figure 1). Positive examples include 4434 protein interactions published before 2018, which represent examples of strong functional associations between genes. Negative examples were prepared by generating random pairs of genes that do not overlap with the positive examples. Considering the low probability of two random genes having functional associations, the generated negative examples are expected to include few false negatives. The positive-to-negative ratio in the training dataset was set to 1:100 to reflect the expectation that only a small fraction of gene pairs has functional associations. This approach of predicting functional gene associations may be considered an implementation of transfer learning. Both protein interactions and functional gene associations may be predicted from the evidence of functional associations; furthermore, protein interactions may be considered a special form of strong functional gene interactions. Therefore, ‘knowledge’ (i.e. the classification model) gained from predicting protein interactions may be used for predicting functional gene associations. In practice, there are experimentally reported gold-standard protein interactions, but there is no well-established gold-standard dataset for strong functional gene associations. With the strategy of transfer learning, we may avoid the difficulty of lacking gold-stand dataset when predicting functional gene associations and use the knowledge gained in predicting protein interactions (i.e. a special form of strong functional interactions) to predict functional gene associations.
To train the prediction model, the soft-margin Gaussian kernel SVM algorithm was used. The kernel width parameter σ and soft-margin parameter C were optimized with a 5-fold cross-validation targeting an optimal harmonic mean of sensitivity and specificity. With optimized σ and C, a prediction model was trained with all training data. This model was validated with an external validation dataset consisting of 559 protein interactions published after 31 December 2017 and randomly generated negative examples. In validation, this model showed a sensitivity of 22.15% and a specificity of 99.95%. For comparison, we also evaluated how well the predicted interaction in DroID, MIST and STRING covered these new interactions. Results are shown in Supplementary Table S4.
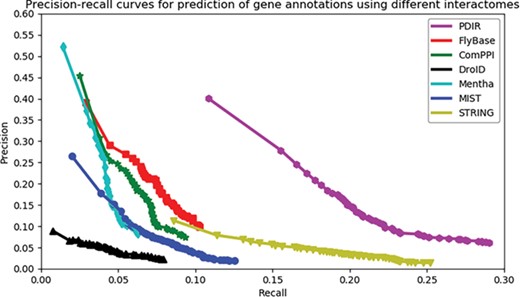
Assessment of the capabilities of seven interactomes to group functionally associated genes together. The precision-recall curves of gene function prediction using different interactomes are illustrated. Precision estimates the proportion of correct annotations identified by an interactome. Recall estimates the proportion of new annotations that is identified by an interactome.
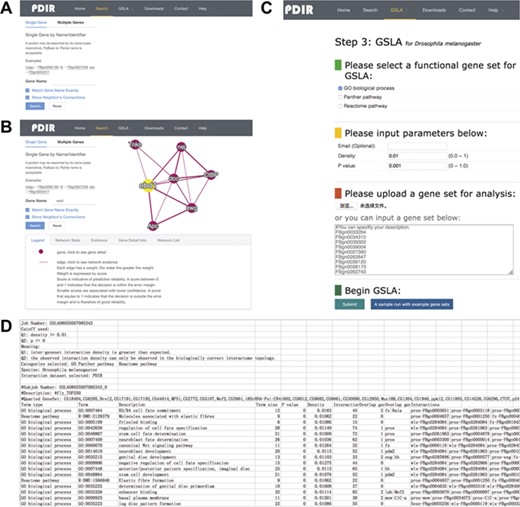
Interface of PDIR and GSLA. (A) Two search options in PDIR. (B) Search result page. A right click on the edge will show interaction details. (C) Interface of GSLA. (D) Results of a GSLA analysis job.
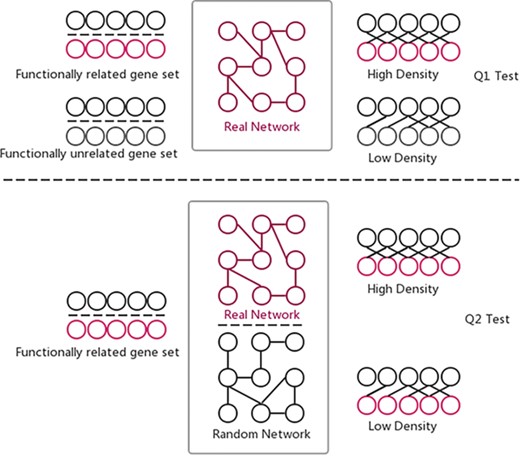
Two hypothesis tests that GSLA used to identify significant functional associations between two gene sets that are biologically meaningful. Q1 tests whether the density of functional associations between two biologically meaningful gene sets is higher than random gene pairs, while Q2 tests whether the strong functional associations observed between two gene sets can only be observed from the biologically correct network, rather than any random interactomes.
Evaluation of functional gene association network
One way to evaluate the quality of a functional association network is to evaluate how well it can group functionally associated genes together. This quality may be measured by the accuracy of using a gene’s network neighbors to predict the gene’s function with the ‘guilt-by-association’ strategy. In this study, the quality of the predicted functional associations was compared with six existing Drosophila interactomes, including FlyBase (21), ComPPI (32), DroID (33), mentha (34), MIST (35) and STRING (36). For each gene in each interactome, its GO biological process annotations were predicted as the terms enriched in the annotations of its first-degree network neighbors. In our evaluation, PANTHER term enrichment tool (9) was used to compute enriched terms.
We used the precision-recall curve to compare the overall accuracy of new annotation prediction across seven interactomes. The data used to infer PDIR gene associations were collected before 2018 (31 December 2017). We collected 2833 genes from GO (37, 38) with new annotations dated up to 10 March 2019. These genes had a total of 104 795 annotations, of which 11 464 annotations were newly added (after 2018). Recall is measured as how much proportion of these new annotations may be successfully predicted. Precision is measured as how much proportion of the PANTHER predicted annotations are consistent with the known annotations (including both new and old annotations).
Each PANTHER-predicted annotation has an enrichment significance. The number of reported annotations will change when a cut-off on the significance value is applied. A higher cut-off will result in more reported annotations, leading to higher recall but also a higher false positive rate. In contrast, a lower cut-off will result in less reported annotations, leading to lower recall but also higher precision. The advantage of the precision-recall curve is that it shows precision and recall rates on different cut-offs, which gives a more comprehensive view of the quality of the interactome, independent of the selection of cut-offs. The higher the AUC, the better an interactome may support ‘guilt-by-association’ prediction of gene function.
As shown in Figure 2, the PDIR curve resides on top of others with the highest AUC, suggesting its superior quality to group functionally associated genes together. When the curve of PDIR reaches the high-recall region, it maintains the highest precision. The curves of the other six interactomes are below that of PDIR in all areas. Although FlyBase, ComPPI, DroID, mentha and MIST have similar high-precision regions, these curves did not reach the high-recall regions. On the other hand, STRING reached the high-recall region, but its precision did not increase much in the low-recall region. This observation indicated that a high proportion of STRING interactions were weak functional gene associations, which may raise the false positive rates during function prediction. In general, PDIR showed a balance between coverage and accuracy. The overall quality of PDIR exceeds those of other compared interactomes.
PDIR/GSLA web interface
The interface of PDIR is user-friendly and easy to operate. PDIR provides two search options, a single gene search and a multiple gene search (Figure 3A). Both search options offer access to PDIR with FlyBase ID or gene name. Single Gene mode reports putative functional associations involving the query gene, whereas Multiple Genes mode reports functional associations between the query genes. The resulting functional associations are provided in a tabular form (Figure 3B). A graphical view of the reported functional associations is provided at the right side of the query interface. The feature values that were used by our model to predict these interactions will be provided if a user correctly clicks the edges in the graphical view of the reported functional associations. In addition, users can also navigate to a gene information page that provides more detailed annotation of a gene by clicking the nodes in the graphical view. Users can download all reported functional associations between genes. A full dump of the PDIR database is also available for download. More details about the PDIR/GSLA web tool can be found on the help section of the website.
The GSLA web tool was first developed with the predicted Arabidopsis interactome (13) for functional interpretation of CGS in Arabidopsis. GSLA relies on testing two hypotheses (Q1 and Q2) to ensure the significance of reported functional associations between two gene sets (Figure 4). The first test (Q1) examines whether the inter-gene-set gene association density between functionally associated gene sets is higher than the background gene association density between random gene sets. The second test (Q2) examines whether the observed high density between functionally associated gene sets can only be observed in the biologically correct functional gene association network. In other words, the density observed in PDIR is higher than the densities observed in random gene association networks consisting of the same genes with each gene having the same number of neighbors. In a biological sense, Q1 tests the strength of a functional association between two gene sets, while Q2 verifies that the observed strong functional association is the result of biologically correct network topology (i.e. our knowledge of the molecular mechanisms), rather than the result of the compositions of these two gene sets. Some genes, known as hubs, have considerably more neighbors than other genes. Gene sets that include many hubs are therefore more likely to connect to other gene sets. Q2 is used to remove the confounding factor of gene set composition and to ensure the biological significance of the functional associations detected between gene sets. Q1 and Q2 are related but different tests that complement each other to increase the sensitivity and specificity of GSLA. The default criteria for GSLA to report a functional association between gene sets are density > 0.01 for Q1 and P < 0.001 for Q2.
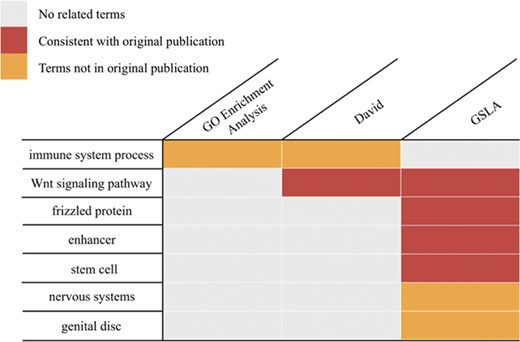
Functional interpretations produced by PDIR/GSLA. Compared with GO enrichment analysis and DAVID, the annotations produced by GSLA are more comprehensive and more accurate.
The PDIR web interface provides a link to the GSLA online service that uses PDIR functional associations to interpret the functional impacts of observed CGS in Drosophila. The main interface of GSLA is illustrated in Figure 3C. To submit an observed CGS, users can submit a whitespace delimitated list of gene IDs. GSLA accepts five types of Drosophila gene IDs, including FlyBase ID, gene name, UniprotKB ID, Ensembl gene and protein ID and NCBI Entrez ID. However, the internal server works only with FlyBase ID. The submitted IDs, if accepted, will be automatically mapped to FlyBase ID before further computation. To prevent information loss associated with ID mapping, it is suggested that submit CGS lists with FlyBase ID are used. The criteria to report significant functional associations (test Q1 and Q2 as described above) can be customized (Figure 3C). Before submitting an analysis job, users need to provide an email address to receive the results. We recommend using the top 50–200 changed genes as the query CGS to obtain optimal functional impact interpretations. In the result file, the top 10 lines show the analysis parameters (Figure 3D). Below is a table that shows the functionally associated biological processes and functional association between the genes in reported biological processes and the genes in the query CGS.
Using the PDIR/GSLA system to re-analyze the Apc1 knockdown dataset
Wnt signaling pathways play an important role in cell fate determination and proliferation (39). Aberrant Wnt signaling often leads to diseases including birth defects and cancers (40). The canonical Wnt signaling pathways are well understood (41). The Wnt/β-catenin pathway, a canonical Wnt pathway, is conserved between humans and Drosophila, which is known to regulate the proliferation of intestinal stem cells (ISCs) (18, 42). In the Wnt ‘off’ state, the transcription coactivator, β-catenin, is phosphorylated and degraded by proteasome (18). When Wnt is ‘on’, β-catenin becomes stable and translocates into the nucleus to interact with DNA-binding transcription factor (18). Hyperactivation of the Wnt pathway, which may be caused by truncating mutations of the tumor suppressor adenomatous polyposis coli (APC), can initiate the development of colorectal cancer (43, 44). Using the Drosophila model, Tian et al. (18) demonstrated that Apc1 loss leads to the overactivation of Wingless target genes, excessive number of ISCs, defects in adhesion and epithelial polarity and disorganization of the intestinal architecture. Two evolutionarily conserved transcription cofactors, Earthbound and Erect wing, are both essential for the hyperactivation of Wnt signaling. In addition, Hayden et al. (45) found that loss of Apc1 results in severe defects in optic lobe development during the medullar development stage.
To investigate the pattern of gene regulation in the Apc1 mutant, Tian et al. (18) measured the midgut transcriptomes of the wild-type and mutated lines using a microarray (GEO database, GSE99071). These researchers reported that over 1000 genes showed more than 2-fold expression changes (18). To assess whether the prediction tools can derive helpful biological insights from these changed genes, we performed PDIR/GSLA, DAVID (11) and GO enrichment (37, 38) analysis with the top 250 changed genes. As shown in Figure 5, GO enrichment analysis reported only one GO term, GO:0019731, antibacterial humoral response (Supplementary Table S5), which is not knowingly related to the main physiology of Wnt pathways. The DAVID tool, which relies on a term clustering technology, reported Wnt-related biological processes that are consistent with those reported by the original authors. However, DAVID reported a total of 176 terms in 20 clusters (Supplementary Table S6). Among them, there are 62 GO terms. The top 20 GO terms (ranked by P-value) included many lipid metabolism and immune system processes. These metabolism terms are also not knowingly related to the main physiology of Wnt pathways. In contrast, PDIR/GSLA reported 17 terms (Supplementary Table S7). In addition to the Wnt pathway-related terms, PDIR/GSLA also found stem cell proliferation-related items, which are known to be the ‘functional impact’ of the Wnt hyperactivation. An excessive number of ISCs is also an observed phenotype of the Apc1 mutant (18). Furthermore, GSLA also reported neuroblast development terms and elastic fiber formation terms, which are well-known functional impacts of the Wnt pathways. In this case study, the interpretation provided by PDIR/GSLA is broader and more accurate, which may better help experimental biologists explain the observation and formulate further hypotheses to elucidate the mechanisms of Wnt pathways.
Discussion
Before this study, there have been many efforts directed at building reference interactomes for Drosophila. To date, many related resources are available. For example, BioGRID (19), IntAct (20) and FlyBase (21) are dedicated to the curation of experimentally reported molecular interactions. DroID (33) and MIST (35) provide both experimentally reported interactions and interactions predicted by interologs. STRING (36) provides predicted molecular interactions. Experimentally reported interactions are more accurate than predicted interactions. However, the number of experimentally reported interactions is still small. According to the estimated size of the Drosophila protein interactome (2.24 × 10⁵), a typical experimental interaction dataset, FlyBase, included 41 272 interactions, which represents 18.36% of protein interactome. This estimation does not consider false positive experimental interactions. Therefore, the actual coverages of these experimental interaction databases are expected to be lower. Although this coverage is comparable to PDIR, these interactions are mostly protein interactions, which are only one type of functional gene interaction. In contrast, PDIR is inferred from multiple types of evidence suggesting functional gene associations from different biological perspectives. Therefore, PDIR consists of functional interactions that are as strong as protein interactions, which provides a more comprehensive view of the true functional gene interaction network. On the other hand, databases that provide predicted interactions enjoy high coverage of the true protein interactome. For example, STRING provides 4 072 942 interactions and is estimated to cover 53.12% of protein interactions. However, databases providing predicted interactions often have very high false positive rates. STRING, as a typical example, is expected to have a low reliability of 2.93% if considered as a protein interaction database. For these reasons, as demonstrated in our new gene annotation prediction assessment (Figure 2), both experimental reported interaction datasets and predicted interactomes did not perform, as well as PDIR, which enjoys a balanced sensitivity and reliability (22.6% coverage and 50.5% reliability if evaluated as protein interactome). Therefore, PDIR complements existing Drosophila interactomes as a high-quality reference for analyzing functional gene interactions.
The availability of PDIR enables the application of GSLA for Drosophila CGS interpretation. To report significant functional associations between two gene sets, GSLA assesses the density of functional gene associations between individual genes in two gene sets. Successful application of this strategy requires that the reference interactome has both high precision and high coverage of true functional interactome, which requires an interactome of balanced accuracy. Previous interactomes did not satisfy this requirement. In our assessments, using other interactomes, GSLA did not produce interpretations as useful as PDIR (data not shown). The same case was observed when we previously developed high-quality functional interactomes for humans and Arabidopsis.
As mentioned in the introduction, the availability of the PDIR/GSLA system enables the interpretation of Drosophila CGS for their potential functional impacts, which extends the capacity of current enrichment-based tools to summarize CGS into known biological processes. When there is no established biological concept that may accurately describe an observed CGS, PDIR/GSLA may still help researchers to understand the observed change in terms of how it connects to related physiologies. Meanwhile, the functional gene interactions provided in PDIR serve as a useful reference for investigators to focus on genes that likely mediate the mechanisms of interest.
Author contributions
Xiao-Bao Ding developed the computational workflow and analyzed the data with the help of Heng Yao. Jie Jin developed the web database and tools. Yu-Tian Tao and Li Ruan wrote the manuscript. Wen-Ping Guo performed interaction prediction. Qiao-Lei Yang re-analyzed the microarray dataset. Peng-Cheng Chen and Heng Yao provided initial conceptualizations of the PDIR/GSLA system. Hai-Bo Zhang built the interaction model. Xin Chen designed and coordinated the project, and together with Yu-Tian Tao wrote the first draft of this manuscript. All authors reviewed and edited the final manuscript.
Funding
National Natural Science Foundation of China (grant nos. 31571356 and 81830073); Breeding program of Taizhou University (grant no. 2018PY010).
Conflict of interest. None declared.
