


Abstract
MicroRNAs (miRNAs) are small non-coding RNAs shown to regulate gene expression by binding to complementary transcripts. Genetic variants, including single-nucleotide polymorphisms and short insertions/deletions, contribute to traits and diseases by influencing miRNA expression. However, the association between genetic variation and miRNA expression remains to be elucidated. Here, by using genotype data and miRNA expression data from 3448 Japanese serum samples, we developed a computational pipeline to systematically identify genome-wide miRNA expression quantitative trait loci (miR-eQTLs). Not only did we identify a total of 2487 cis-miR-eQTLs and 3 155 773 trans-miR-eQTLs at a false discovery rate of <0.05 in six dementia types (Alzheimer’s disease, dementia with Lewy bodies, vascular dementia, frontotemporal lobar degeneration, normal-pressure hydrocephalus and mild cognitive impairment) and all samples, including those from patients with other types of dementia, but also we examined the commonality and specificity of miR-eQTLs among dementia types. To enable data searching and downloading of these cis- and trans-eQTLs, we developed a user-friendly database named JAMIR-eQTL, publicly available at https://www.jamir-eqtl.org/. This is the first miR-eQTL database designed for dementia types. Our integrative and comprehensive resource will contribute to understanding the genetic basis of miRNA expression as well as to the discovery of deleterious mutations, particularly in dementia studies.
Database URL: https://www.jamir-eqtl.org/
Introduction
MicroRNAs (miRNAs) are small non-coding RNA (ncRNA) molecules of ∼22 nucleotides that play key roles in the post-transcriptional regulation of gene expression and control of biological processes in development, differentiation, growth, apoptosis and metabolism. miRNAs have been the focus of recent studies as potential biomarkers of a variety of diseases, including cancers (1, 2), cardiovascular disease (3) and Alzheimer’s disease (4, 5). Many experimental techniques and computational methods have been developed to detect miRNAs (6–8), and the number of newly identified miRNAs is still increasing (9).
The development of high-throughput genotyping and massive parallel next-generation sequencing enables the genotyping of a large number of genetic variants, including single-nucleotide polymorphisms (SNPs) and short insertions/deletions (indels). Genome-wide association studies have successfully identified numerous genetic variants associated with human complex traits (10, 11) and diseases (12, 13). However, as the majority of trait- or disease-associated loci are located in non-coding regions of the genome, it remains challenging to determine their underlying basic mechanism or effect on pathogenesis (14); the targets they affect are often assigned to neighboring protein-coding genes or ncRNAs.
Expression quantitative trait locus (eQTL) analysis is a powerful approach to elucidating the biological correlations between gene expression and genetic variants and helps to explain the regulatory mechanisms underlying trait- or disease-associated loci (15, 16). Although some eQTL databases have been established, most of them have been developed for the associations between genotypes and protein-coding genes (17, 18). Only one ncRNA-related eQTL database, called ncRNA-eQTL, has been recently developed, for different cancer types (19), although a few studies of miRNA expression quantitative trait loci (miR-eQTLs) have reported the findings of analyses of a small number of samples and a small number of miRNAs (20, 21).
Here, we investigated the statistically significant associations between genetic variants and comprehensive miRNA expression by using a large number of samples representing different types of dementia. Not only did we develop a computational pipeline to systematically identify miRNA-eQTLs in different dementia types, including mild cognitive impairment, but also we constructed a user-friendly database, JAMIR-eQTL, to enable data searching and downloading of these cis-eQTLs and trans-eQTLs. Our integrative and comprehensive resource will contribute to understanding the genetic basis of miRNA expression, as well as to the discovery of deleterious mutations associated with human complex diseases, including dementia. Furthermore, since miRNAs have been reported to be associated with many diseases including cancer (19) and dementia (5, 22), the integration of other databases will contribute to the elucidation of the cross-disease interpretation of miRNAs.
Data collection and processing
Subjects
Serum samples from 3448 Japanese patients registered with the National Center for Geriatrics and Gerontology (NCGG) Biobank were used and represented six types of dementia [Alzheimer’s disease (AD), dementia with Lewy bodies (DLB), vascular dementia (VaD), frontotemporal lobar degeneration (FTLD), normal-pressure hydrocephalus (NPH) and mild cognitive impairment (MCI)] as well as ‘Other’, which included all samples not representing one of the six dementia types. The numbers of subjects were 1314 for AD, 134 for DLB, 69 for VaD, 31 for FTLD, 39 for NPH, 504 for MCI and 1357 for Other. All subjects provided written informed consent. The study was approved by the NCGG ethical committee.
Genotyping data
Genotyping data were downloaded from the NCGG Biobank database. Those data were obtained according to established protocols. Genomic DNA was extracted from peripheral blood leukocytes by using standard protocols and a Maxwell RSC [Rapid Sample Concentrator] Instrument (Promega). All 3448 subjects were genotyped by using the Affymetrix Japonica genotyping array (Toshiba Corporation, Tokyo, Japan) (23). Genotype imputation was performed by using IMPUTE2 (ver. 2.3.2) (24) with the 3.5K Japanese reference panel (12). We used autosomal SNPs and short indels with an imputation confidence score ≥0.4. Quality control (QC) was performed by using PLINK software (25). We applied the following QC filters to the subjects: (i) sex inconsistencies (–check-sex); (ii) inbreeding coefficient (–het 0.1); (iii) genotype missingness (–mind 0.05); (iv) kinship coefficient (–genome 0.2) and (v) exclusion of outliers from the clusters of East Asian populations in a principal component analysis that was conducted with 1000 Genomes Phase 3 data. We further applied the following QC filters to the genetic markers (SNPs and indels): (i) genotyping efficiency or call rate (–geno 0.05); (ii) minor allele frequency (–maf 0.001); (iii) Hardy–Weinberg equilibrium (–hwe 0.001) and (iv) total minor allele count (–mac 3). A total of 9 367 559 genetic markers from all 3448 subjects passed the QC criteria after imputation: 8 948 088 genetic markers from 1314 AD subjects, 6 133 945 from 134 DLB subjects, 5 448 340 from 69 VaD subjects, 4 588 639 from 31 FTLD subjects, 4 754 596 from 39 NPH subjects and 7 766 083 from 504 MCI subjects (Figure 1).
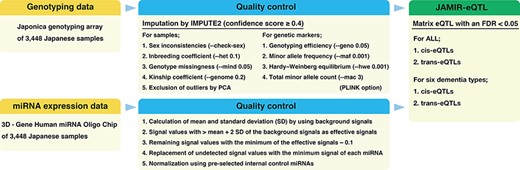
Flowchart of the JAMIR-eQTL database.
miRNA expression data
Blood miRNA profiling data were also downloaded from the NCGG Biobank database. Comprehensive miRNA expression data were generated by using a 3D‐Gene miRNA Labeling kit and a 3D‐Gene Human miRNA Oligo Chip (Toray Industries, Inc., Tokyo, Japan) designed to detect 2562 miRNA sequences registered in miRBase release 21 (http://www.mirbase.org/). miRNA expression data were normalized by using the following four steps: (i) calculation of mean and standard deviation (SD) by using a set of pre-selected negative control signals (background signals) from which the top and bottom 5% of values had been removed; (ii) replacement of signal values greater than the mean + 2 SD of the background signals with log2(signal−mean) and labeling as effective signals; (iii) replacement of the remaining signal values with the minimum of the effective signals−0.1 and (iv) replacement of undetected signal values with the minimum signal of each miRNA. Finally, we used a set of pre-selected internal control miRNAs (miR-149-3p, miR-2861 and miR-4463), which we had found were stably expressed in more than 500 serum samples, to normalize the signals across different microarrays. Each miRNA signal value was standardized by using its ratio to the average signal of three internal control miRNA signals (Figure 1) (26).
Identification of miRNA-related cis- and trans-eQTLs
cis-miR-eQTLs were defined as genetic variants located within 1 Mb upstream or downstream of the mature miRNA sequence, and trans-miR-eQTLs were defined as genetic variants located beyond 1 Mb upstream or downstream of the mature miRNA sequence or on another chromosome. The genomic locations of mature miRNA sequences were retrieved from the miRBase database (V22, http://www.mirbase.org/ftp.shtml) (27). We examined associations between the expression of each miRNA and genetic variants by using linear regression, adjusting for age, sex and the top three principal components (PC1, PC2 and PC3); this was implemented by using the eQTL analysis tool Matrix eQTL (28). Matrix eQTL calculates the false discovery rate (FDR) by using expression–variant pairs that have passed a pre-selected significance threshold (‘pvOutputThreshold’). We set the threshold to 0.01 and identified cis- and trans-miR-eQTLs at an FDR <0.05. These miR-eQTLs were independently identified by using each of the six dementia types, as well as in all subjects (Figure 1).
Database content and description
Database content and characteristics of miR-eQTLs
We independently analyzed cis- and trans-miR-eQTLs in the six dementia types and all subjects. We identified a total of 2487 cis-miR-eQTLs and 3 155 773 trans-miR-eQTLs at an FDR <0.05 in six dementia types and all samples, including those from patients with other types of dementia. We identified 542 cis- and 668 069 trans-miR-eQTLs in AD, 1 cis- and 17 788 trans-eQTLs in DLB, 96 cis- and 150 609 trans-eQTLs in VaD, 4659 trans-eQTLs in FTLD, 2022 trans-eQTLs in NPH, 1326 cis- and 1 694 332 trans-eQTLs in MCI, and 522 cis- and 618 294 trans-eQTLs in all subjects (Table 1). We further examined the commonality and specificity of miR-eQTLs among dementia types (Figure 2). Compared with the ncRNA-eQTL (19), JAMIR-eQTL detected more trans-eQTLs than cis-eQTLs. The difference could be due to their target ncRNAs. While ncRNA-eQTL targets long non-coding RNAs (lncRNAs), JAMIR-eQTL targets comprehensive miRNAs. lncRNAs are more than 200 nucleotides in length, but miRNAs are far smaller, ∼22 nucleotides in length.
Summary of samples and numbers of cis- and trans-miR-eQTLs
| cis- | trans- | ||||||
|---|---|---|---|---|---|---|---|
| Dementia type | No. of samples | genotypes | miRNAs | eQTLs | genotypes | miRNAs | eQTLs |
| AD | 1314 | 535 | 125 | 542 | 458 247 | 2576 | 668 069 |
| DLB | 134 | 1 | 1 | 1 | 15 226 | 602 | 17 788 |
| VaD | 69 | 96 | 19 | 96 | 33 684 | 1828 | 150 609 |
| FTLD | 31 | 0 | 0 | 0 | 3464 | 54 | 4659 |
| NPH | 39 | 0 | 0 | 0 | 1875 | 46 | 2022 |
| MCI | 504 | 1107 | 319 | 1326 | 332 791 | 2578 | 1 694 332 |
| ALL | 3448 | 498 | 120 | 522 | 411 288 | 2578 | 618 294 |
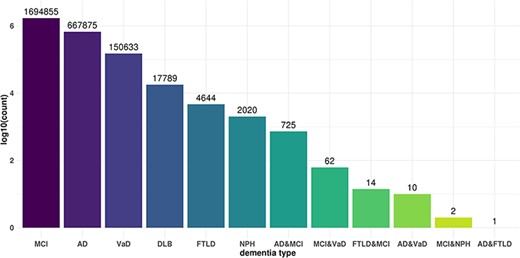
Commonality and specificity of miR-eQTLs among dementia types. X axis shows dementia types and Y axis shows the total numbers of cis-miR-eQTLs and trans-miR-eQTLs at an FDR <0.05 for each dementia type or combination of dementia types.
Quick browsing and searching
To enable data searching and downloading, we developed JAMIR-eQTL, a user-friendly database including comprehensive miRNA-related cis-eQTLs and trans-eQTLs. The JAMIR-eQTL database has a quick search window in which users can select example shortcuts (Figure 3, A: Example search) or input their genetic variants of interest, miRNAs or genomic locations (Figure 3, B: Individual query search). Variants are searched via refSNP (rs) numbers (e.g. rs145050069), and miRNAs are searched via mRNA names (e.g. hsa-miR-29b-3p) or accession numbers (e.g. MIMAT0000100). Genomic locations are searched via chromosomal start and end positions (e.g. chr1:172400000–172500000); all miR-eQTLs associated with variants included in that range are reported. Users can also select the dementia types that they want to search. Types are composed of AD, DLB, VaD, FTLD, NPH, MCI, ALL and Not specified (six dementia types + ALL). Users can investigate not only the biological correlations between genetic variants of interest and miRNA expressions but also commonality and specificity of the variants among dementia types. Also, the JAMIR-eQTL database can be used to check individual miR-eQTL associations and will be used for validation in large-scale analyses.
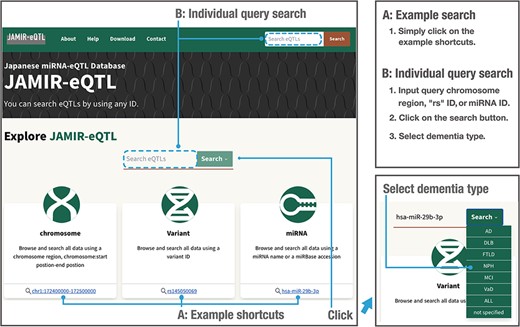
Example and individual query searches in the JAMIR-eQTL database.
Displaying the database contents
When users search by using a genetic variant, miRNA or genomic location of interest, the database returns a table of related miR-eQTL records, consisting of dementia types, cis-/trans-miR-eQTLs, miRNA names, ‘rs’ IDs, chromosomes, chromosome positions, variant alleles, beta values (effect sizes of variant on miRNA expression), P-values and FDRs (Figure 4a). All columns can be sorted, and records without variant alleles or beta values can be filtered. Detailed information for each eQTL plot can be displayed by clicking on the plot column (Figure 4b). A vector diagram of a boxplot is provided to display the association between variant genotypes and miRNA expression. As the information includes P-values and FDRs among the six dementia types and ALL, users can further find out the dementia types between which the miR-eQTLs of interest are shared. Users can also export all plots in PNG (Portable Network Graphics) format.
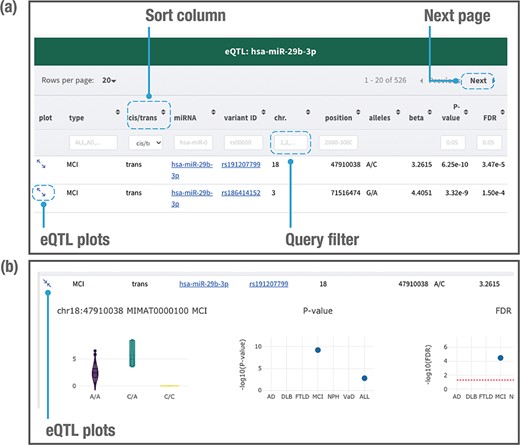
Example of a page displaying search results. The JAMIR-eQTL database returns a table of related miR-eQTL records (a). All columns can be sorted, and records without variant alleles and beta values can be filtered. Detailed information on each eQTL plot can be displayed by clicking on the plot column link (b). A vector diagram of a boxplot displaying the association between variant genotypes and miRNA expression is presented, along with P-values and FDRs among the six dementia types and ALL.
Clicking on the variant related to the miR-eQTL provides the minor allele, major allele and minor allele frequency in our database (Figure 5a). Clicking on the miRNA provides the mRNA ID and accession number (Figure 5b). The variant information is further linked to the public database dbSNP (29), whereas the miRNA information is linked to the public database miRBase (27) (Figure 5a and b). Users can download all miR-eQTL results at FDR < 0.05 for each dementia type from the ‘Download’ section. The ‘About’ page provides summary information for the data collection, processing and results. JAMIR-eQTL welcomes all feedback through email to the address provided on the ‘Contact’ page. We have tested the database on multiple web browsers, including Chrome, Firefox, Windows Edge and Safari.
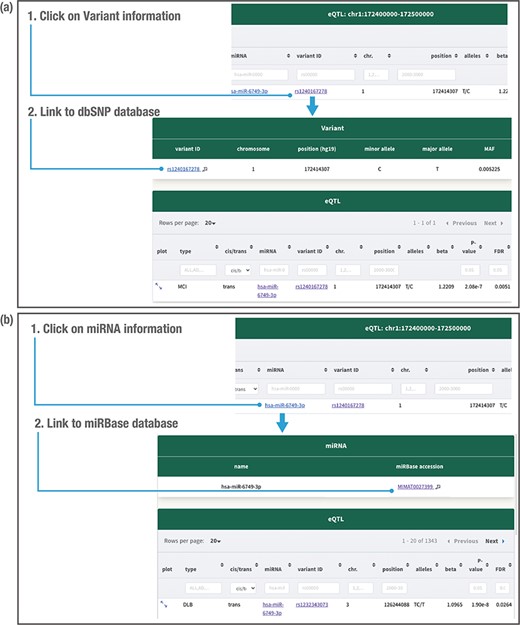
Detailed variant and miRNA information. Clicking on the variant related to the miR-eQTL provides the variant minor allele, major allele and minor allele frequency (MAF) in the JAMIR-eQTL database (a). Clicking on the miRNA provides the microRNA ID and accession number (b). The variant information further links to the public database dbSNP, whereas the miRNA information links to the public database miRbase.
Future development
Only one ncRNA-related eQTL database, namely ncRNA-eQTL (19), has recently been developed, for cancer types. The JAMIR-eQTL database is the first miR-eQTL database designed for dementia types. These comprehensive miR-eQTLs are attracting a lot of attention from many researchers focusing on dementia, and there is no doubt that this database is a powerful research tool for studying potential therapeutic mechanisms for dementia. The NCGG Biobank aims to provide a resource for the investigation of the large-scale genetic, environmental and lifestyle determinants of a wide range of aging-associated diseases. Every year, >1000 individuals are enrolled in the Biobank, which had reached 20 000 enrollments as of early 2021. We believe that the JAMIR-eQTL database will continue to increase in size and will be useful to dementia research in the future.
Implementation
The JAMIR-eQTL database was constructed by using Golang with a PostgreSQL backend-database. A Nuxt.js application was used to build the front-end interface.
Accessibility
JAMIR-eQTL is freely available to all users without restriction at https://www.jamir-eqtl.org/.
Acknowledgements
We thank NCGG Biobank for providing the study materials, clinical information and technical support. We also thank Keith A. Boroevich for the English correction.
Funding
Development of Diagnostic Technology for Detection of miRNA in Body Fluids (to T.O., and S.N.); Program for an Integrated Database of Clinical and Genomic Information (to S.N., and K.O.), from the Japan Agency for Medical Research and Development (AMED); The Japan Foundation for Aging and Health, DAIKO Foundation and Takeda Science Foundation (to D.S.); JSPS KAKENHI (Kiban B Grant Number 21H02470 to D.S.); Research Funding for Longevity Sciences from the National Center for Geriatrics and Gerontology (29-45 to K.O., 20-10/21-22 to S.N. and 30-29/21-24 to D.S.); a grant for Research on Dementia from the Japanese Ministry of Health, Labour, and Welfare (to K.O.).
Conflict of interest
None declared.
References
Author notes
Shumpei Niida and Daichi Shigemizu contributed equally to this work.
