


Abstract
Bipolar disorder (BIP) is one of the most common hereditary psychiatric disorders worldwide. Elucidating the genetic basis of BIP will play a pivotal role in mechanistic delineation. Genome-wide association studies (GWAS) have successfully reported multiple susceptibility loci conferring BIP risk, thus providing insight into the effects of its underlying pathobiology. However, difficulties remain in the extrication of important and biologically relevant data from genetic discoveries related to psychiatric disorders such as BIP. There is an urgent need for an integrated and comprehensive online database with unified access to genetic and multi-omics data for in-depth data mining. Here, we developed the dbBIP, a database for BIP genetic research based on published data. The dbBIP consists of several modules, i.e.: (i) single nucleotide polymorphism (SNP) module, containing large-scale GWAS genetic summary statistics and functional annotation information relevant to risk variants; (ii) gene module, containing BIP-related candidate risk genes from various sources and (iii) analysis module, providing a simple and user-friendly interface to analyze one’s own data. We also conducted extensive analyses, including functional SNP annotation, integration (including summary-data-based Mendelian randomization and transcriptome-wide association studies), co-expression, gene expression, tissue expression, protein–protein interaction and brain expression quantitative trait loci analyses, thus shedding light on the genetic causes of BIP. Finally, we developed a graphical browser with powerful search tools to facilitate data navigation and access. The dbBIP provides a comprehensive resource for BIP genetic research as well as an integrated analysis platform for researchers and can be accessed online at http://dbbip.xialab.info.
Database URL: http://dbbip.xialab.info
Introduction
Bipolar disorder (BIP) is a common and serious psychiatric condition that typically manifests with strong shifts in mood, vacillating between episodic bouts of mania and depression (1, 2). With a lifetime prevalence rate of 1–4% (3), BIP usually occurs in adolescence or early adulthood, but diagnosis is often established after the onset of symptoms with a common delay. In addition to mood fluctuations between mania/hypomania and depression, individuals with BIP frequently exhibit cognitive deficits and other psychiatric comorbidities (4). BIP patients also show higher rates of suicide and risks of related medical complications (such as osteoporosis, diabetes mellitus, metabolic syndromes and cardiovascular and endocrine disorders) compared to the general population (5, 6). Accordingly, BIP is associated with a huge economic burden. For example, in the USA alone, the national economic burden of BIP exceeded 195 billion dollars in 2020, with 25% directly attributed to healthcare costs (7). Thus, due to its high morbidity, mortality and social and economic costs, BIP has become a major health problem globally.
At present, the etiology of BIP remains largely unknown. Evidence from multiple studies implicates both environmental and genetic factors in the initiation of BIP (8, 9). Twin studies suggest that the narrow-sense heritability of BIP is as high as 70% (10), indicating a critical role of genetic factors in this disorder. As such, genetic studies could help unravel the mechanisms underlying BIP and assist in the discovery of novel therapeutic targets. To reveal the genetic architecture underlying BIP, linkage (11, 12), association (13, 14) and meta-analysis studies (15) have identified many novel BIP-associated susceptibility variants, genes and chromosomal regions (16), although the detection of credible susceptibility variants and genes has been limited due to the small sample size and low coverage of genetic markers. However, the wealth of data uncovered from genome-wide association studies (GWAS) provides a powerful approach to explore the genetic etiology of BIP (2). In 2007, the Wellcome Trust Case Control Consortium (17) reported the first BIP GWAS. Subsequently, multiple studies on different human populations have identified various genetic loci and genes associated with BIP (18–32). The most recent GWAS carried out by the Psychiatric Genomics Consortium (PGC) (41 917 cases and 371 549 controls) reported 64 genome-wide significant loci, including 33 newly discovered loci (33). In addition to the most common form of genetic variation in the human genome (i.e. SNPs), other structural genomic variants are reported to play prominent roles in BIP, e.g. copy number variations (CNV) and rare variants (34–36).
Despite considerable progress in identifying susceptibility variants for BIP, the extraction of useful and functional information from the massive amount of genetic data still poses a significant challenge (36). First, as with other common psychiatric diseases, most genetic risk variants identified from BIP GWAS are located in non-coding regions of the human genome (26, 31), and how they confer risk remains largely unknown. Second, while GWAS have succeeded in identifying BIP-associated genetic loci, only a handful have been resolved to individual genes (37) based on genetic characteristics. Thus, there are obvious difficulties in recognizing specific susceptibility genes underlying GWAS loci. Third, further integration of different multi-omics data sets [e.g. integrated analysis of genetic and gene expression data (33, 38)] is necessary to clarify specific susceptibility genes and provide experimental validation. Thus, to best utilize current genetic data, there is a pressing need for in-depth data collection and mining to help provide novel insights into the pathogenesis of BIP and develop more effective methods for early diagnosis and treatment.
In this study, we developed a comprehensive genetic database for BIP (dbBIP) to meet the increasing needs of data acquisition and analysis. The dbBIP database aims to provide researchers with comprehensive BIP genetic data based on data collection, data integration and functional analysis. The dbBIP sources come from the extensive and systematic integration and storage of diverse BIP studies and include data on genetic findings, SNP functional annotation, gene expression, brain expression quantitative trait loci (eQTL) and network-based proteins. The dbBIP not only offers a user-friendly interface to browse, search, analyze and visualize data but also provides meaningful information for further functional characterization of high-confidence candidate variants and genes.
Methods and materials
Genetic data
Many genetic studies have been carried out in the last decade to identify the genetic risk variants for BIP. The two largest BIP GWAS, i.e. PGC2 (31) and PGC3 (33), were included in the dbBIP database. The PGC2 data set from the PGC BIP Working Group, which includes 20 352 BIP cases and 31 358 healthy controls of European descent (14 countries in total), identified 30 genome-wide significant loci (including 20 newly identified loci) associated with BIP (31). The more recent PGC3 GWAS data set from the PGC, which includes 41 917 BIP cases and 371 549 healthy controls, identified 64 genomic loci associated with BIP (33). We downloaded the SNP association results of PGC2 and PGC3 (https://www.med.unc.edu), with details regarding participant recruitment, sample preparation and statistical analysis reported in previous publications (31, 33). In total, summary data on 19 963 820 SNPs were downloaded.
Although CNVs show robust associations with neurodevelopmental disorders (39–41), recent research indicates that they likely pose less risk to BIP than to autism and schizophrenia (41–45), and only a limited number of significant CNVs associated with BIP have been detected by genetic studies (46–48). Green et al. (34) analyzed the CNV status of 41 321 subjects (including 2591 BIP cases and 8842 healthy controls) and identified several independent CNV loci associated with BIP, including deletions at 3aq29, duplications at 1aq21.1 and duplications at 16p11.2. As such, we identified genes affected by the above-reported CNVs and deposited detailed CNV information into the dbBIP, including detection platform, number of cases and controls, CNV location and CNV-affected genes.
Both de novo and disruptive mutations are implicated in the pathogenesis of BIP (49, 50). The development of next-generation sequencing, especially whole exome/genome sequencing (WES/WGS), has enabled the detection of rare and de novo mutations at the exome and genome level (51, 52). To collect data on genetic mutations related to BIP, we searched the PubMed database for relevant articles published since 2015 using keywords ‘whole exome sequencing and bipolar disorder’ or ‘whole genome sequencing and bipolar disorder’. All returned results were manually checked and examined, resulting in the collation of eight original WES/WGS studies with BIP results (http://dbbip.xialab.info/Exome_sequencing_publications).
Functional genomic data
Most BIP risk variants reside in non-coding genomic regions and lack functional interpretation. By systematically integrating BIP-related GWAS and functional genomics data, we can identify potential causal variation(s) at a given susceptibility locus. Here, we used three well-optimized functional annotation tools, i.e. Combined Annotation-Dependent Depletion (CADD) (53), Linear insight (LINSIGHT) (54) and RegulomeDB (55), to prioritize potential risk SNPs. CADD utilizes evolutionary conservation information and functional data from the ENCODE database (56) to rank variants that are likely to be pathogenic or deleterious. LINSIGHT predicts negative selection on non-coding regions as well as functional variants using genomic data via the generalized linear and probabilistic molecular evolution models. RegulomeDB uses high-throughput experimental data sets from ENCODE and other sources to identify potential regulatory variants. For CADD (scores of 0–99) and LINSIGHT (scores of 0–1), higher scores are indicative of functional SNPs, while for RegulomeDB (scores of 1–6), lower scores are indicative of functional SNPs. We downloaded all three annotated functional genomic data sets to annotate all variants identified by PGC3 GWAS (33), with all annotated results then integrated into the dbBIP. Detailed information on these annotation approaches can be found in previous publications (53–55).
As regulatory sequences typically reside in open chromatin, we hypothesized that BIP risk variants involved in neurodevelopmental processes may affect chromatin accessibility. Based on human-induced pluripotent stem cell (iPSC)-derived neurons, Zhang et al. (57) identified many allele-specific open chromatin (ASoC) variants. Thus, in view of the abundance of BIP GWAS variants in ASoC SNPs in glutamatergic (iN-Glut) samples (57), we collected functional genomic results from the iN-Glut samples and annotated the potentially functional SNPs that may affect chromatin accessibility during neurodevelopment in BIP. Data analysis methodologies are reported in Zhang et al. (57).
Regional association plots
We used LocusZoom (58) to visualize genomic regions of interest based on BIP summary statistics in PGC3 (33) (e.g. P values of genetic variants) downloaded from the PGC portal (https://www.med.unc.edu/pgc/download-results/), in full compliance with the PGC terms. Additional details are reported in previous study (58) and on the LocusZoom website (https://my.locuszoom.org/).
Integrative analysis data
As stated above, most GWAS-identified BIP genetic risk variants are located in non-coding regions, especially within putative regulatory elements, suggesting possible BIP risk via gene expression regulation (26). Both summary-data-based Mendelian randomization (SMR) (38) and FUSION/transcriptome-wide association studies (TWAS) (59) are powerful tools for the integration and identification of risk genes that may increase disease susceptibility under altered expression and thus were applied in the current study. For PGC2 (31), we carried out SMR and FUSION/TWAS analysis by integrating GWAS summary statistics and brain eQTL data from the CommonMind Consortium [CMC (60)], BrainSeq Consortium (second phase) [LIBD2-DLPFC (61)] and PsychENCODE Consortium (62) data sets. Details on the SMR and FUSION/TWAS integrative analysis procedures can be found in previous studies (63, 64). All integrative analysis results (including SMR and FUSION/TWAS) can be freely downloaded from the dbBIP database.
For PGC3 (33), the results reported in Mullins et al. (33) were included in our developed database. To prioritize candidate risk genes of BIP, Mullins et al. (33) integrated genetic associations from the PGC3 (33) GWAS with eQTL data from the PsychENCODE Consortium (62) (1321 brain samples) and eQTLGen Consortium (65) (31 684 whole blood samples) using SMR. They also integrated PGC3 GWAS summary statistics with brain eQTL summary data from the PsychENCODE Consortium (62) using the TWAS/FUSION method.
Differentially expressed genes
Increasing evidence supports the importance of gene expression dysregulation in BIP pathogenesis (66). To identify differentially expressed genes (DEGs) in BIP subjects and healthy controls, the PsychENCODE Consortium (62) established a large-scale gene expression data set using post-mortem dorsolateral prefrontal cortex (DLPFC) tissues of 144 BIP cases and 899 healthy controls (European ancestries) using RNA-sequencing (RNA-seq). This data set is regarded as one of the most representative of gene expression in BIP. Thus, we downloaded the gene mRNA expression values (http://resource.psychencode.org/) and included the data in the dbBIP. Detailed information on the study subjects is provided in the original publication (62). To visualize the data, we used the jQuery plug-in plotly (https://plot.ly/javascript/) to generate boxplots for the target genes in BIP cases and controls.
Protein–protein interaction data
Proteins are essential for biological processes, and those implicated in the same disease often show strong associations or interactions (67, 68). Protein–protein interaction (PPI) network analysis is an effective method to assess whether proteins encoded by BIP susceptibility genes show high interactions with other proteins. Li et al. (69) constructed a scored human InWeb_IM PPI network based on various indicators (e.g. reproducibility of interactive data) and quality control and integration of data, resulting in a more biologically relevant network than comparable resources. Currently, the InWeb_IM contains >500 000 interactions, aggregated from eight databases (i.e. DIP, BioGRID, BIND, IntAct, NetPath, MatrixDB, Reactome and WikiPathways) and covering 87% of human UniProt IDs (69). Thus, we downloaded the latest release of InWeb_IM PPI data, which can be visualized and queried in the dbBIP. For visualization, dbBIP can construct PPI plots based on interactions among input proteins, including force and circular display types.
Spatiotemporal expression pattern data
Exploring spatiotemporal variations in risk gene expression in the brain can help clarify the role of such genes in the pathogenesis of diseases such as BIP (70). To elucidate the potential role of candidate BIP susceptibility genes in the central nervous system, we used two independent expression data sets (71) to analyze spatiotemporal expression patterns. First, normalized RNA-seq data from BrainSpan (71) expression samples (http://www.brainspan.org/) of different aged subjects (8 post-conception weeks to 40 years, N = 42) were downloaded and transformed (63, 72). Expression data obtained from four prefrontal cortical regions of the brain (i.e. orbital, medial, dorsolateral and ventrolateral prefrontal cortices) were integrated into the dbBIP. The second expression data set was obtained from BrainCloud (73) (http://braincloud.jhmi.edu/) and contained gene expression values from the human prefrontal cortex of post-mortem brains across different ages as well as human mRNA expression data of 267 normal subjects analyzed using microarrays (73). Details on the BrainCloud data set are provided in the original publication (73). For query functions, the dbBIP supports user queries by gene symbols and generates a spatiotemporal expression plot for each queried gene.
Tissue expression analysis data
Here, gene expression data obtained from the Genotype-Tissue Expression (GTEx) project (v8p release) (74) were used to investigate expression levels of various target genes across separate human tissues (especially the brain). Gene expression levels were quantified using RNA-seq, and relevant gene expression data from 53 human tissues were downloaded from the GTEx (http://gtexportal.org/) (74), which also provides information on collection, extraction, expression and processing procedures (74). The dbBIP can generate histogram plots to visualize tissue expression analysis of the above data.
QTL data
Various non-coding genetic variants play essential roles in BIP (2, 75). These genetic associations potentially signal variants that impact gene expression by affecting RNA transcription, splicing and stability (74). Given the importance of eQTL data in investigating candidate risk variants and their effects, we explored different eQTL data sets to identify genes in the brain that may show transcriptional level changes under the influence of the BIP susceptibility variants. This resulted in the inclusion of three large-scale brain eQTL studies in our database [i.e. CMC (60), O’Brien et al. (76) and PsychENCODE Consortium (62) eQTL data sets]).
The CMC eQTL data set (60) contains 1 817 945 significant cis-eQTL (at a P <1 × 10⁻³) from the DLPFC tissue of 467 human subjects of European descent. This data set was downloaded from the website (https://www.synapse.org/CMC) for inclusion in the dbBIP. The eQTL data set reported in O’Brien et al. (76) (N = 120) contains eQTL results derived from prenatal post-mortem brains collected at the second trimester. Significant eQTL results (P < 0.05) were downloaded and included in the dbBIP. The large brain PsychENCODE Consortium eQTL data set (62) (N = 1695), which explores the relationship between genetic variation and gene expression in the human brain (especially DLPFC tissues), was directly downloaded from PsychENCODE (http://resource.psychencode.org). In diseased brains, high-effect isoform changes are considered to be highly reflective of genetic risk (62). Therefore, we also downloaded and deposited transcript QTL (tQTL) data from CMC (60) and PsychENCODE (62)) in the database.
Co-expression data
Recent studies suggest that BIP susceptibility genes are significantly co-expressed in time- and tissue-specific patterns. Thus, co-expression analysis could help to identify high-priority candidate genes for BIP from genetic studies. To identify whether BIP susceptibility genes are co-expressed in the human brain, we performed gene co-expression analyses using the RNA-seq expression data of BIP cases (N = 144) from the PsychENCODE Consortium (62). Pearson correlation coefficients were then calculated, as described previously (77), and those genes with correlation coefficients ≥0.8 were retained in the dbBIP.
Prioritization of BIP risk genes
To integrate evidence derived from different BIP studies and identify and prioritize potential candidate risk genes for BIP, we used the arbitrary cumulative scoring method developed by Ayalew et al. (78). This approach supposes that BIP-associated genes may be discovered in independent studies and are thus scored as promising BIP candidate genes based on (I) GWAS-identified genes (31, 33), (ii) CNV-disrupted genes (34), (iii) WES/WGS-identified genes (49, 50, 79–89), (iv) SMR integrative analysis [genetic associations from large-scale PGC3 (33) and PsychENCODE brain eQTL data (62)], (v) TWAS integrative analysis (genetic summary statistics from PGC3 (33) and PsychENCODE brain eQTL data (62)), (VI) DEGs (62) and (VII) brain expression results from The Human Protein Atlas (90) (genes are ‘expressed’ when FPKM expression >5). Consequently, each analysis contributes one point to the identified gene via polyevidence scoring (78), and the final gene score is calculated based on a cumulative scoring strategy, with high scores suggesting multiple analysis evidence supporting the gene as a BIP susceptibility gene.
Results
Database summary
Based on comprehensive genetic and multi-omics data collection and re-analysis, we systematically integrated related data and results in the dbBIP (http://dbbip.xialab.info) (Table 1). Thus, the dbBIP not only contains genetic susceptibility variants (i.e. SNPs) and potential risk genes for BIP but also provides in-depth analysis results, including SNP functional annotation, integrative analysis and DEG analysis. Specifically, the dbBIP integrates powerful online analysis tools and allows advanced users to easily customize and extend analysis, e.g. static LocusZoom, QTL (including eQTL and tQTL), PPI, co-expression, spatiotemporal expression and tissue expression analyses (Figure 1). All data generated or analyzed in this study are freely available to view and download at the dbBIP website (http://dbbip.xialab.info/Download).
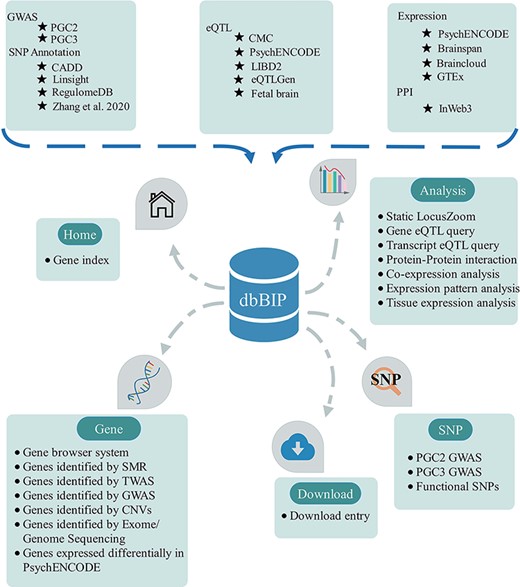
Overview of database content and construction. The dbBIP contains genetic data and analytical tools with browse, search, download and visualize functions.
Data description of SNP, gene and analysis modules
| Module | Entry | Data set | Tissue | Reference |
|---|---|---|---|---|
| SNP | PGC2 GWAS | PGC2 | Blood | (31) |
| PGC3 GWAS | PGC3 | Blood | (33) | |
| Functional SNPs | Zhang et al. (2020) | iPSC-derived neurons | (57) | |
| Gene | Genes identified by SMR | CMC, LIBD2-DLPFC, PsychENCODE and eQTLGen | Brain and Blood | (60–62, 65) |
| Genes identified by TWAS | CMC, LIBD2-DLPFC and PsychENCODE | Brain | (60–62) | |
| Genes identified by GWAS | PGC2 and PGC3 | Blood | (31, 33) | |
| Genes identified by CNVs | Green et al. (2016) | Blood | (34) | |
| Genes identified by exome sequencing | Literature | Blood | (49–50, 79–84) | |
| Genes expressed differentially in PsychENCODE | Gandal et al. (2018) | Brain | (62) | |
| Analysis | Static LocusZoom | PGC3 | Blood | (33) |
| Gene eQTL query | CMC, fetal brain and PsychENCODE | Brain | (60, 76, 62) | |
| Transcript eQTL query | CMC and PsychENCODE | Brain | (60, 62) | |
| PPI | Li et al. (2016) | Human tissue | (69) | |
| Co-expression analysis | Gandal et al. (2018) | Brain | (62) | |
| Expression pattern analysis | Brainspan and BrainCloud | Brain | (71, 73) | |
| Tissue expression analysis | GTEx | Human tissue | (74) |
We established a common MySQL relational database to store all dbBIP information, which runs on an Ubuntu 14.10 LTS operating system. A user-friendly web platform for browsing and searching was implemented using PhpMyAdmin and JavaScript, powered by Bootstrap (responsive and mobile-first front end is a web interface based on a free and open-source CSS framework).
The dbBIP database provides users with a powerful search engine and a user-friendly web interface to access, browse and download different data types and connections. Users simply need to enter query items, with the input format and content easily located on each dbBIP query page. In addition to ‘Quick Search’ via keyword, dbBIP presents an ‘Advanced Search’ function for genes to allow users to combine queries for a detailed overview of gene results. Most returned results in the dbBIP are output as tables. Therefore, the DataTables plug-in (https://datatables.net/) was added to the database to allow advanced users to search and manipulate (show/hide/reorder) table columns. The database provides a detailed explanation of the returned results by each query, including the original data source and definition of each table column.
Key dbBIP modules
Currently, the dbBIP contains three main modules, i.e. SNP, Gene and Analysis modules (Figure 1 and Table 1). The SNP module contains three separate tabs: ‘PGC2 GWAS’, ‘PGC3 GWAS’ and ‘Functional SNPs’. The PGC2 and PGC3 tabs allow powerful functional searches and GWAS SNP queries and provide various statistics, including SNP position, odds ratio, P value and annotation information (i.e. CADD, LINSIGHT and RegulomeDB). The ‘Functional SNPs’ tab currently contains 1985 GWAS risk SNPs that affect chromatin accessibility during neurodevelopment in BIP (based on integration of Zhang et al. 57) data (i.e. ASoC is associated with functional disease variants) and PGC3 GWAS variants.
The Gene module consists of seven tabs and six different levels of data: (I) Genes prioritized from multiple sources of data; (II) Genes detected from integrative analysis of two GWAS [i.e. PGC2 (31) and PGC3 (33)] and four eQTL data sets [i.e. CMC (60), LIBD2-DLPFC (61), PsychENCODE (62) and eQTLGen (65)] using the SMR approach; (III) Genes detected from integrative analysis of two GWAS [i.e. PGC2 (31) and PGC3 (33)] and four eQTL data sets [i.e. CMC (60), LIBD2-DLPFC (61), PsychENCODE (62) and eQTLGen (65)] using the TWAS/FUSION approach; (IV) Genes detected in two large-scale BIP GWAS data sets; (V) Genes influenced by CNVs (based on large-scale CNV research). Fifteen CNVs were included and annotated, with information on CNV location, genes affected by CNV and CNV detection platform provided; (VI) Genes identified by WES/WGS based on 13 studies (http://dbbip.xialab.info/Exome_sequencing_publications) and (VII) DEGs based on RNA-seq data between DLPFC BIP patients (N = 144) and control subjects (N = 899).
In the Analysis module, we compiled LocusZoom, eQTL, tQTL, PPI, co-expression, spatiotemporal expression and tissue expression data. This module provides a user-friendly and powerful interface to query and analyze one’s own data in the dbBIP. LocusZoom allows users to search and draw regional associations of interest. Users can also query the eQTL and tQTL results included in the dbBIP. The spatiotemporal expression pattern tab allows users to investigate if target genes are preferentially expressed in specific brain regions and/or at specific developmental stages. We embedded the BrainSpan and BrainCloud data sets in the dbBIP. The PPI tab provides a one-click test to discern potential PPIs among queried proteins. Based on the above calculated gene score, we utilized ECharts.js (https://echarts.baidu.com) to color code each queried gene in the PPI network. The co-expression tab prioritizes BIP candidate genes from large-scale transcriptome study and allows users to explore if BIP susceptibility genes are co-expressed in specific brain subregions. The tissue expression analysis tab allows users to explore BIP risk gene expression in distinct human tissues.
Prioritized BIP genes and enriched pathways
As well as offering users an easy-to-use online search and analysis tool, the database also prioritizes susceptibility genes of BIP risk via cumulative scores to help researchers select the most promising candidates for functional investigations. Overall, 29 prioritized candidate risk genes (score of 3 or greater) for BIP were identified by polyevidence scoring (Figure 2). Three potential risk genes, i.e. OSBPL2, STK4 and PACS1, showed the highest scores in the prioritized task, suggesting that they may represent prospective BIP susceptibility genes. OSBPL2 is located on chromosome 20aq13 and has been implicated by genome-wide significant association with nearby SNPs in BIP genetic study (33). Furthermore, diseases associated with OSBPL2 include deafness, and previous studies report a prevalence of BIP in deaf and hard-of-hearing outpatients (91, 92), with deaf youth potentially more vulnerable to BIP. STK4 is located in chromosome 20aq13.12, and genetic variants located in or near STK4 showed genome-wide significant association with BIP (31, 32). STK4-related pathways include the MAPK signaling pathway (93), and we noticed that pathways involved in the genetic predisposition to BIP include the MAPK signaling pathway as well (94). PACS1 is located in chromosome 2p13.1, and genetic variants in PACS1 showed genome-wide significant association with BIP in PGC2 (31) and PGC3 (33). Interestingly, Chen et al. found that overexpression of PACS1 reduced the density of dendritic spines, revealing the potential biological mechanisms of this gene in BIP (95). In addition, we used the Database for Annotation, Visualization and Integration Discovery (DAVID) (96, 97) for pathway analysis of genes of interest (i.e. polyevidence score ≥3), which were found to be significantly enriched in membrane, dendrite and neuronal cell body-related pathways (Table 2).
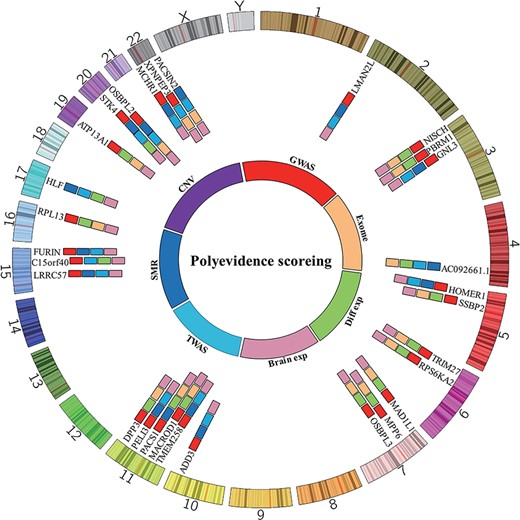
Top candidate causal genes identified in this study. By integrating prediction results from different methods, 29 high-confidence causal genes were identified. OSBPL2, STK4 and PACS1 had the highest scores and thus represent the most promising causal genes for BIP.
Significant pathways of genes with a polyevidence score of 3 and above
| Category | Pathwaya | P value | P adj |
|---|---|---|---|
| GOTERM_CC_DIRECT | Membrane | 1.28E−06 | 3.63E−04 |
| GOTERM_MF_DIRECT | Protein binding | 1.08E−06 | 4.42E−04 |
| GOTERM_CC_DIRECT | Dendrite | 1.02E−04 | 1.45E−02 |
| GOTERM_CC_DIRECT | Cytosol | 1.81E−04 | 1.59E−02 |
| GOTERM_CC_DIRECT | Neuronal cell body | 2.24E−04 | 1.59E−02 |
The table shows significant pathways identified by DAVID that are enriched among genes that have a polyevidence score of 3 and above. P adj values represent P values corrected by the Benjamini–Hochberg procedure in DAVID.
Discussion
BIP is a common and severe psychiatric disorder marked by episodic disturbances in mood, cognition and behavior. Both genetic and environmental risk factors participate in the pathogenesis of BIP, although its high heritability (up to 70%) points to genetic factors playing a primary role in its occurrence. Research on BIP genetic architecture has shown significant progress in recent years, and over 60 significant susceptibility loci have been successfully identified. Despite this, BIP etiology remains poorly understood. Thus, there is a pressing need to systematically integrate multiple layers of data from diverse sources, such as genetic, gene expression, PPI, co-expression and eQTL data, to extract meaningful biological information for BIP genetic studies. Hence, to fill this gap, we developed a web-based platform that integrates multi-omics resources from different BIP studies. This is the first BIP genetic database that focuses on interpreting genetic data from GWAS based on multi-omics data and integrated analysis.
To date, only the BIP genetic database (BDgene) (98) is available for BIP research. Compared with the BDgene database, the dbBIP has several advantages. First, the BIP susceptibility genes included in the BDgene database were mainly based on small sample linkage and genetic association studies, and the database has not been updated since 2016. Second, the dbBIP offers a powerful analysis module for advanced users to perform customized analysis, including LocusZoom, eQTL, tQTL, PPI, co-expression, temporal and spatial expression pattern and tissue expression analyses. Third, the priority of candidate risk genes in the dbBIP was determined via in-depth data integration based on multi-omics data. Accordingly, the top prioritized genes (as good candidates) provide positive preliminary results, which deserve further functional characterization. Fourth, the dbBIP provides a one-stop searching resource for genes and offers comprehensive information collection from the above three modules. Lastly, as new technologies and analysis methods are rapidly evolving and novel BIP susceptibility variants and genes are constantly being identified, the dbBIP database will be updated to incorporate recent findings, thus providing a valuable and up-to-date resource for the BIP research community.
This study also has several limitations. First, a straightforward and arbitrary scoring algorithm using various data (e.g. genetic studies, integrative analysis and gene expression researches) was selected to prioritize promising BIP candidate risk genes. However, simple and operational scoring systems can miss potential overlap between the source data used for scoring (e.g. genes identified by integrative analysis also contain information from genetics and gene expression studies), which may affect score credibility. Second, we treated all evidence from different origins equally. However, GWAS tend to provide more reliable candidate risk genes than CNV studies and should be given greater weight. Multiple algorithms can be developed and used in the future to address these limitations.
Our newly developed dbBIP database offers a wealth of resources for translating genetic results and elucidating the molecular and pathogenic mechanisms underlying the occurrence and development of BIP. The database includes all recently available BIP-related data (including genetic and multi-omics data), thus allowing researchers the opportunity to access and analyze BIP susceptibility genes under a unified online tool. Therefore, the dbBIP provides a practical and convenient platform for BIP research from a genetics perspective.
Acknowledgements
We would like to thank Dr Li (Department of Surgery, Massachusetts General Hospital, Boston, MA, USA) for making the protein–protein interaction network data publicly available. We thank the participants and investigators of the Working Group of the Psychiatric Genomics Consortium, the GTEx Project and the PsychENCODE Consortium for generating and providing summary statistics and thereby making this work possible.
Funding
National Natural Science Foundation of China (82101611, 11835014); National Key Research and Development Program of China (2020YFA0908700).
Conflict of interest
The authors declare that they have no conflicts of interest.
Author contributions
J.F.X., X.Y.L. and X.J.L. conceived and devised the study. X.Y.L. performed most of the bioinformatics analyses, including SNP functional annotation, SMR and TWAS analysis, differential expression analysis, QTL analysis, spatiotemporal expression pattern analysis and tissue expression analysis. S.S.M. undertook website construction and conducted co-expression pattern analysis. Y.W. collected PPI data. X.Y.L., S.S.M., W.H.Y. and H.K. carried out literature searching, screening and data collection. J.F.X., X.J.L., X.Y.L., S.S.M., W.H.Y., Y.W., H.K. and M.S.Z. performed data generation, analysis and interpretation of the results. X.Y.L. drafted the first version of the manuscript. J.F.X. and X.J.L. supervised the project and direction. All authors provided critical feedback and approved the final version of the manuscript.
Data availability
All data relevant to this study are included in the article or available online in the dbBIP. The data generated in this study are also available from the corresponding author upon reasonable request.
