


Abstract
Structural features of proteins provide powerful insights into biological function and similarity. Specifically, previous work has demonstrated that structural features of tissue and drug-treated cell line samples can be used to predict tissue type and characterize drug relationships, respectively. We have developed structural signatures, a web server for annotating and analyzing protein features from gene sets that are often found in transcriptomic and proteomic data. This platform provides access to a structural feature database derived from normal and disease human tissue samples. We show how analysis using this database can shed light on the relationship between states of single-cell RNA-sequencing lung cancer samples. These various structural feature signatures can be visualized on the server itself or downloaded for additional analysis. The structural signatures server tool is freely available at https://structural-server.kinametrix.com/.
Introduction
In the past decade, there has been an explosion of proteomic and genomic sequencing (1). This wealth of data, while revolutionary, does not on its own capture underlying functional similarities and differences between samples beyond shared gene or protein names. Traditionally, additional analysis has been necessary to relate these proteins or genes via an interaction network (2, 3). In order to reveal relationships and make advancements based on underlying function, the incorporation of protein feature information is invaluable (4). Recent studies have shown the benefit of using gene expression signatures in conjunction with orthogonal information, such as protein structure, to describe biological systems more robustly (5). Structural features of proteins capture underlying patterns and functions in biological samples. As a result, they can be a powerful tool for defining cellular identity, function and the effects of perturbations. Structural features combine information from multiple levels of protein structure encoded in genomic and proteomic sample sets. Structural features enable phenotypic characterization across experimental platforms, facilitate interoperability of expression datasets and describe drug action on cells. In particular, the protein features determined with the algorithm hosted on the structural signatures server have been shown to reproducibly describe human tissue samples and the relationship between kinase inhibitor-treated cardiomyocyte-like cell lines (6).
Here, we describe the structural signatures server that allows users to generate protein features from proteins or gene sets. These features correspond to the hierarchical description of each protein structure in the set, including domain, family, superfamily and fold, which can be predicted from the amino acid sequence of the encoded protein (Supplementary Figure S1). Structural signatures can reveal unique functional aspects of their samples, from their own proteomics, transcriptomics and single-cell RNA data. The server hosts an updated version of the algorithm that generates structural features, which includes additional capabilities such as feature name annotation and more readable file outputs. The user interface is easy to use and requires no prior coding experience to operate. Once protein features have been calculated via the server, the user can download their results or explore them directly on the server in graphical or table form. The server also allows users to explore protein feature data from normal tissue datasets (7, 8) and lung single-cell RNA sequencing from the Gene Expression Omnibus GSE1311907 (9). The interactivity provided by the server uniquely increases the accessibility of these data.
Materials and Methods
Structural signatures data and definition
A structural signature consists of protein features found in a set of genes or proteins. The algorithm that computes structural features assigns and counts families, superfamilies and folds in the input set from the Structural Classification of Proteins extended (SCOPe) (10) database using the structure of input gene products predicted with HHpred (11), a profile–profile alignment program for predicting protein structure. The algorithm also determines domains from InterProScan (12). The following minimum threshold values for assigning identifiers to proteins are used: length of alignment to a structure’s 30 residues, probability score 50, overlap coverage 80%, P-value 1e-05, E-value 1e-05, percent identity 30% and coverage against template 30%. When the algorithm is unable to assign a structural label to a gene structure, the label becomes ‘no-fold’ or ‘no-domain’. The features and their calculated frequency are then compared to those found in the human proteome, which represents the background distribution of each feature, using a one-sided Fisher’s exact test. In addition to the structural features and their frequency, the algorithm also returns their P-value of enrichment (association) and their Bonferroni-adjusted P-value (q-value). Building on previous work (6), the version of the algorithm that determines structural features and is hosted on the server was reconfigured to require fewer dependencies and includes information about the domain, family, superfamily and fold descriptions for ease of user interpretation. Furthermore, the output was also reorganized into a more streamlined and user-readable format. The server returns a downloadable text file with each row representing a structural feature. The columns are as follows: the description of the structural feature; the name of the structural feature using the domain, family, fold or superfamily ID; the level of classification of the feature such as whether it is a domain, family, fold or superfamily; the number of times that feature appears in the sample; the number of times that feature appears in the human proteome; the P-value of the sample calculated using a Fisher’s exact test comparing the number of times the feature appears in the sample and the number of proteins found in the sample minus the number of times the feature appears in the sample with the number of times the feature appears in the human proteome and the number of proteins found in the human proteome minus the number of times the feature appears in the human proteome; the Bonforroni-adjusted significance value that is adjusted by dividing an α of 0.05 by the number of features found in the sample for that level of classification; the log base 10 of the number of times the feature appears in the sample divided by the number of times the feature appears in the human proteome and the false discovery rate that is determined using all the P-values from the samples in that level of classification.
In addition to protein features determined based on user genomic or proteomic input, the server also provides access to protein features from a Broad Institute database that contains RNA-sequencing data from 54 non-diseased human tissue types (GTEx) (7), which contains RNA-sequencing data from 54 non-diseased human tissue types, a database hosted by the Ma’ayan Lab that brings together signatures from human and mouse tissue from a variety of platforms (ARCHS4) (8), which contains signatures from normal human and mouse tissue from a variety of platforms and GSE1311907 (9), which contains single-cell RNA-sequencing samples from normal lung as well as early and advanced stage lung adenocarcinomas. A 3D t-distributed stochastic neighbor embedding (t-SNE) (13) was conducted on structural features of samples for each of these datasets based on the top 250 over-expressed genes using the python package sklearn.manifold, t-SNE with the following parameters: n_components = 3, verbose = 1, perplexity = 30 and n_iters = 250.
The web server, which hosts the most recent version of the algorithm that determines structural features, can be found at structural-server.kinametrix.com. The source code for this algorithm is available at https://github.com/schlessinger-lab/structural-signatures.
Results and Discussion
Interface and implementation
The sGES server is a website, which allows users to generate structural signatures for their own gene sets of interest using the structural signatures algorithm and interact with the resulting data. There is easy navigation between pages using the navigation bar at the top of the screen (Figure 1A). The server was built using Python Dash. All figures were generated using Plotly. The web server was dockerized prior to deployment on Amazon Web Services.
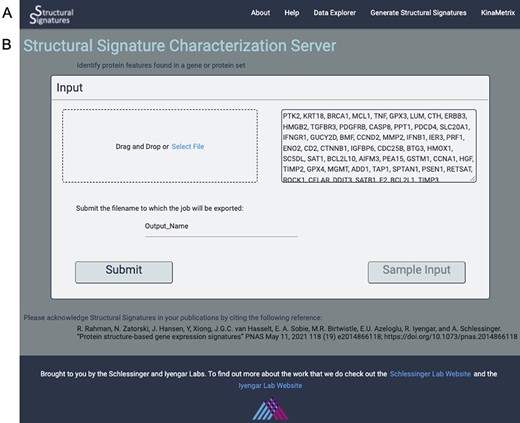
Input page. (A) the web server navigation bar. (B) The user can submit gene lists or protein IDs that they wish to transform into structural features as a comma, line or space-separated list of gene names or UniProt IDs or upload a file of the same format. They can also give their job an export name, under which it will be saved, and there is an option to view the output for a sample list of genes.
Data generation page
The input to the algorithm that generates structural features is a list of gene names or UniProt (14) IDs. These can be uploaded directly into the user interface or as a text file with each ID separated by commas, lines or spaces. A sample dataset of apoptosis genes is available so that the user can familiarize themselves with the data generation process and output visualizations (Figure 1B).
Once the structural features for the input are determined, the user can download the text file output. The user can also take advantage of the interactive graphs to explore the structural features of their input (Figure 2). The volcano plot representation of the data shows InterPro Domains and SCOPe Families, Folds and Superfamilies associated with the structural features found (Figure 2A). The log fold change for each feature is plotted against the negative log P-value. Structures above the line with negative log P-value equal to three have P-values <0.05. For ease of visualization, data can be excluded from the plot by clicking on its name in the legend. Double-clicking on the name of the data in the legend will exclude all other data with the exception of the selected data. Additionally, a data table of hovered-over and clicked structures appears under the plot. In the sample input that contains genes that are associated with apoptosis, examples of features that fall above the significance line include Peptidase C14 domains and the caspase activation and recruitment domains (CARD) domain, both of which are implicated in protein breakdown (Figure 2B).
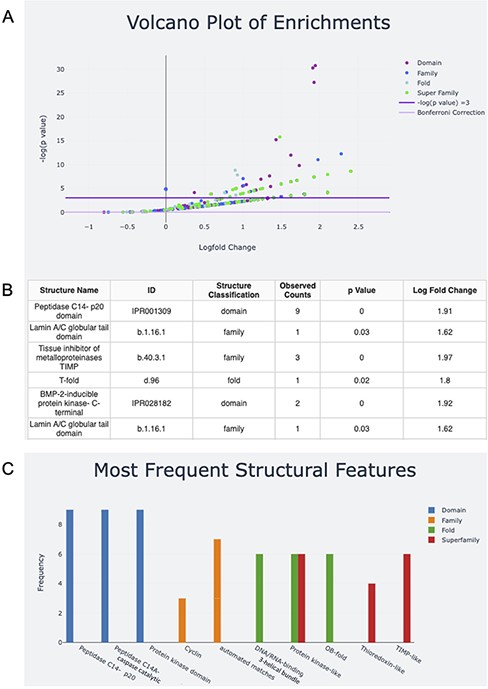
Screen capture of the output page. The user can download a zip file by pressing the Download button. (A) The results are visualized with a volcano plot and a table with more details about the plot points being hovered over or clicked. The legend for this graph can be found on the right and includes domain, family, fold and superfamily, as well as the cutoffs for −log(P) equal to five and the Bonferroni correction. (B) The table corresponding to the hovered-over or clicked data from the volcano plot (C) structural feature information can also be visualized in a frequency bar plot.
The bar plot captures information about the features with the highest frequencies in each level of classification, InterPro Domains and SCOPe Families, Folds and Superfamilies (Figure 2C). The x-axis is labeled with the name of the top three features in each level of classification, and the y-axis is their frequency. Looking at both plots together shows that the peptidase C14 domains are not only highly represented in the sample, but are also overrepresented in the sample compared to the human proteome if using an α of 0.05. If analysis with a more stringent α is desired, users can calculate the equivalent negative log P-value and explore the negative log P-values for the features of interest on the volcano plot by hovering or clicking. Alternatively, users can download the raw output data for analysis. Information about the server functionality and underlying method is included on the About and Help pages.
Database Explorer page
The server also allows users to explore the structural features of normal human tissue samples in the GTEx (7) and ARCHS4 (8) databases (Figure 3). These data serve as a normal tissue control for the user and provide insight into the signature background. Newly generated structural feature data from lung adenocarcinoma single-cell RNA-sequencing data from human patient samples (9) is also available on the Data Explorer page. The utility of this dataset is expanded upon in the ‘Use case’ section. The data are represented as an interactive 3D t-SNE (13), which allows users to conceptualize structural feature-based similarity for different subsets of the data. For example, the normal human tissue t-SNE on the GTEx dataset showcases the differences of sub-tissues within organs for which sub-tissues were collected (Figure 3A). This is particularly apparent in heart and brain tissues, which had distinct sub-tissues labeled. In a t-SNE, the clustering by overall tissue type remains; however, there is also the nuanced separation by sub-tissue type. This distinction is displayed by the 3D t-SNE on the server (Figure 3B).
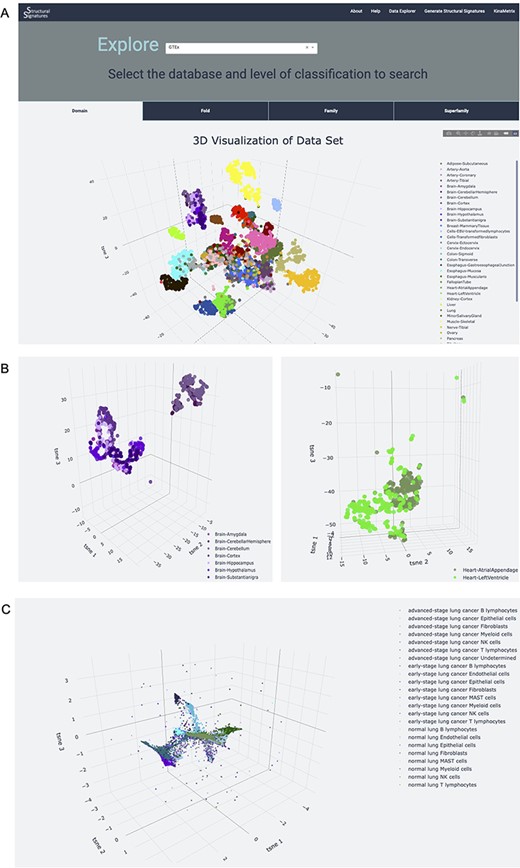
Database explorer page. (A) 3D t-SNE with GTEx tissues based on the features of the expressed proteins. (B) 3D t-SNE with brain and heart sub-tissues as seen on the server (C) 3D t-SNE on lung adenocarcinoma structural features.
Furthermore, a searchable table of raw structural feature values with their frequencies is available, which is helpful for understanding features based on tissue type of origin and contextualizing structural feature samples the user has provided. For example, if a user has generated structural features for a diseased or drug-treated sample, they can download their results and compare the perturbation signature to the signature of normal tissue. In this way, the server can assist in the isolation of perturbation signals from general tissue signals.
Due to the large number of samples, the download output is broken up into separate files for each level of classification, domain, family, fold and superfamily. Each column represents a feature with the following columns: structural feature ID, number of times the structural feature occurs in the sample, number of times the structural feature occurs in the human proteome, the number of genes or proteins in the sample, number of proteins in the human proteome, the P-value of the sample calculated using a Fisher’s exact test comparing the number of times the feature appears in the sample and the number of proteins found in the sample minus the number of times the feature appears in the sample with the number of times the feature appears in the human proteome and the number of proteins found in the human proteome minus the number of times the feature appears in the human proteome, the false discovery rate that is determined using all the P-values from the samples in that level of classification, the Bonferroni-adjusted significance value that is adjusted by dividing an α of 0.05 by the number of features found in the sample for that level of classification and the log base 10 of the number of times the feature appears in the sample divided by the number of times the feature appears in the human proteome. Each of the datasets also has distinct columns with sample-specific information. The last three columns of the GTEx data contain information about the sample ID, the tissue subtype and the tissue, respectively. The last two columns in the ARCHS database contain the sample ID and the tissue type, as no sub-tissue information was collected in that database. Finally, the last three columns in the lung adenocarcinoma database contain information about the sample ID, the cell type and the cancer stage.
Use case: application of structural features to the understanding of lung adenocarcinoma progression
Structural features can provide powerful, new insights into single-cell RNAseq data to characterize cell states. This is showcased on the Data Explorer page for the samples extracted from normal human lung tissue, early and advanced stage lung adenocarcinomas (9). The application of structural feature analysis of human single-cell RNA-sequencing samples from normal, early-stage and advanced lung adenocarcinoma followed by the application of t-SNE demonstrates retention of tissue-specific clustering (Figure 3C). Notably, the 3D t-SNE analysis shows the retention of cell-type information, as well as positions clusters of cell types derived from the same progenitors near each other, providing additional information about developmental lineage. For example, natural killer (NK) cells, T-lymphocytes and B-lymphocytes, all of which develop from the common lymphoid progenitor (CLP) (15), all localize near each other in the t-SNE plots. Interestingly, the T-lymphocytes and NK cells are located closer to each other, with almost overlapping clusters, than to B cells. This could highlight the similarity and interconnectedness of their function in immune-mediated cell death (16) in addition to their common lineage. The T cell clusters, however, are situated between the NK cell and B cell clusters, recapitulating their status as the bridge between innate and adaptive immunity (17). Myeloid cell clusters, which come from myeloid progenitor cells and share the same precursor cell—the hematopoietic stem cell—as CLPs (18), are also located near the NK, T and B cell clusters. Epithelial and fibroblast cell clusters, which are hypothesized to derive from mesenchymal stem cells (19), are located on the periphery, further away from these clusters of immune cells.
In addition to the recapitulation of cell functions and lineages, the t-SNE plot also highlights the differences in cell types and subtypes found in normal lung, early and advanced stage adenocarcinoma lung, particularly in epithelial cells (Figure 3C). This analysis captures differences within cell types that experience functional mutations between these disease categories ranked by progression and, in doing so, provides evidence to support the importance of the Epithelial to Mesenchymal Transition (EMT) in lung adenocarcinoma severity. Due to the importance of EMT in cancer genesis and disease resistance (20), this differentiation of clusters is both expected and contributes to the validity of structural features for capturing biological phenomena. Incorporating these data into a network provides further support for the relationships between cell type and disease state (Supplementary Figures S2 and S3). This demonstrates the utility of the server as an initial investigational tool for characterizing datasets.
Conclusions
As the wealth of omics data increases, it is imperative that this genomic and proteomic information is used to its full potential. Previous work has shown that structural features, which contain information about underlying protein structural features of differentially expressed genes, are a powerful tool for describing drug perturbations and tissue states. This information is complementary to the analysis provided by other gene annotation methods (21, 22). The web server presented here provides an easy-to-use interface for generating new structural features from user datasets and also enables the user to further explore other publicly available datasets. To demonstrate the broad applicability and generalizability of structural features, we show its applicability in the analyses of single-cell transcriptomics data of lung adenocarcinoma patient samples and provide these results in the server. The relationships uncovered, provide valuable insight into the characterization and progression of disease.
Supplementary data
Supplementary data are available at Database Online.
Funding
National Institutes of Health (F30 HL160179-02 to N.Z., T32 HD075735 to N.Z., T32 GM062754 to R.R. and D.S., U54 HG008098 to R.I. and A.S.).
Conflict of interest
None declared.
Author contributions
N.Z., A.S. and R.I. wrote the manuscript. N.Z. and D.S. implemented the web server. N.Z. created the current structural features method. R.R. created the previous structural features method.
References
(
