


Abstract
Erianthus fulvus (TaxID: 154759) is a valuable germplasm resource in sugarcane breeding and research and has excellent agronomic traits, such as drought resistance, cold resistance, barren tolerance and high brix. With a stable chromosome number (2n = 20) and a small genome (0.9 Gb), it is an ideal candidate for research on sugarcane. Next-generation sequencing technology has enabled a growing number of studies to focus on genomics. Due to the large amount of omics data available, a centralized platform is necessary for ensuring the consistency, independence and maintainability of these large-scale datasets through storage, analysis and integration. Here, we present a comprehensive database for the E. fulvus genome, EfGD. By using the new high-quality reference genome and its annotations, the EfGD provides the largest whole-genome sequencing reference dataset for E. fulvus, which archives 27 165 protein-coding genes and 55 564 488 SNPs from 202 newly resequenced genomes. Furthermore, we created a user-friendly graphical interface for visualizing genomic diversity, population structure and evolution and provided other tools on an open platform.
Database URL: https://efgenome.ynau.edu.cn
Introduction
Sugarcane produces 80% of the world’s sugar and 40% of biofuels and is an important cash crop. Sugarcane requires a significant amount of water, fertilizer and heat for its growth and development, which is why it is primarily found in tropical and subtropical climates. Continuous population on a global scale, a limited amount of sugarcane planting areas and the frequent occurrence of extreme weather conditions are driving the demand to improve sugarcane yield, quality and adaptability (1–3). This can be addressed with the use of appropriate germplasm materials. To acquire new cytoplasmic and nuclear genomes in sugarcane hybrids, the wild species of Erianthus fulvus Ness (axID: 154759), Saccharum spontaneum L. (TaxID: 4547) and Erianthus arundinaceus Retz. (TaxID: 50346) have been used as hybrid parents to produce an array of advanced generation hybrids (4, 5).
Erianthus fulvus Ness is a wild species of Erianthus that is close to Saccharum. It is mainly distributed in E 97.83 to 106.40 latitude and N 24.38 to 28.27 longitude and at altitudes between 480 and 3003 m (6, 7). Erianthus fulvus has many characteristics that are very useful for improving sugarcane varieties, including early maturity, high brix, drought resistance, cold resistance and barren resistance (8). Furthermore, E. fulvus has a stable chromosome number, 2n = 20 (9), and there is genetic diversity among all clones (8, 10). Our team investigated and collected E. fulvus resources in China as early as 1985 (6) and used the resources for germplasm resource research and genetic improvement of sugarcane varieties (11).
Although E. fulvus has great value in sugarcane variety improvement, little research has been conducted on its heredity, variation and functional genes, especially when compared to sugarcane. To better utilize E. fulvus resources and investigate the regulatory mechanisms of traits, we previously performed next-generation transcriptome sequencing on E. fulvus (12) and uncovered several drought- and cold-tolerance-related genes, including DREB (dehydration responsive element binding protein) (13), CML (Calmodulin-like) (14), NAC (NAC domain transcription factor) (15) and GRAS (gibberellic acid insensitive, repressor of GAI, and scarecrow) (16). In this study, we produced the whole-genome sequence of E. fulvus. The E. fulvus genome (0.9 Gb) is much smaller than the S. spontaneum L. genome (3.13 Gbp) (17). In addition, 202 samples from Saccharum complex, including 97 Erianthus, 56 Saccharum, 19 Miscanthus, 5 Narenga and 1 Eulalia were used for whole-genome resequencing and analysis, and a total of 55 564 488 single nucleotide polymorphisms (SNPs) were identified, creating a fine genetic map of E. fulvus and providing a large number of genetic markers for the molecular breeding of sugarcane. Erianthus fulvus genome and transcriptome information can be obtained at National Center for Biotechnology Information (NCBI) (BioProject ID: PRJNA854329).
In this work, we further developed a comprehensive database (E. fulvus genome database, EfGD) for data storage, classification, online analysis and visualization of E. fulvus and sugarcane omics data. The EfGD provides scientific researchers with data on the transcriptome and genome sequence for E. fulvus, as well as phenotype, resequencing and SNP information for 202 samples from Saccharum complex. In addition, the EfGD also provides search functions, such as BLAST, JBrowse and Publication services, and all data download functions. All data in the EfGD can be downloaded for free.
Materials and methods
Data content
A hybrid sequencing approach of short Illumina reads, long PacBio reads and HiC reads were used to construct the E. fulvus ‘ZM13’ genome. The PacBio sequencing resulted in ∼132.3 Gb long-reads, Illumina sequencing resulted in ∼147.4 Gb short-reads and Hi-C sequencing resulted in 189 Gb (189-fold) high-quality clean reads. In addition, 202 samples, including 121 Erianthus, 56 Saccharum, 19 Miscanthus, 5 Narenga and 1 Eulalia (Supplementary Table S1), were whole-genome resequenced to generate 2.7 Tb (27.3 billion) paired-end raw reads. Moreover, 14 RNA-seq sequences of leaf tissues (i.e. ZM13, leaf cold 24 h, Er_LT1_1.fq.gz) were also carried out to acquire 23.05 Gb raw RNA-seq data (15). All of these data were integrated into the EfGD. The assembled E. fulvus genome was 0.9019 Gb. Using this assembly as the reference, genome annotation, variant calling and population genetic analysis were conducted. See the following sections for methods.
Genome annotation
The E. fulvus genome assembly was annotated for gene content using the NCBI Eukaryotic Genome Annotation Pipeline (18). Tandem Repeats Finder v4.09 (19) was used to search for tandem repeats in repeat annotation. Gene prediction was performed through de novo, homology-based and transcriptome-based approaches. For de novo prediction of protein-coding genes, we used GeneID v1.4.4 (20), GlimmerHMM (21), SNAP (22) and GenScan (23) with default settings. For homology-based gene prediction, protein sequences from Oryza sativa (TaxID: 4530), Arabidopsis thaliana (TaxID: 3702), Brachypodium distachyon (TaxID: 15368), Sesamum indicum (TaxID: 1405819), Zea mays (TaxID: 4577) and Sorghum bicolor (TaxID: 4558) were used for blast analysis. Trinity v2.9.0 (24) assembled transcripts of E. fulvus were aligned against the E. fulvus genome to generate transcriptome-based gene models using Program to Assemble Spliced Alignments v2.4.1 (25). Protein-coding gene functions were assigned according to the best match using Blastp against Swiss-Prot, Translation of EMBL (TrEMBL) (26) and Kyoto Encyclopedia of Genes and Genomes (KEGG) (27). The InterProScan functional analysis and Gene Ontology (GO) IDs were obtained with InterProScan (28). The GO enrichment was performed with Ontologizer 2.0 (29) with a P value cutoff of 0.05.
Digital gene expression profiles
RNA-seq datasets of E. fulvus ‘ZM13’ covering low temperature and drought stress treatment of leaves were selected. These raw RNA-seq reads were mapped to the latest reference genome by HISAT2 (30). The matched reads are then presented to StringTie (31) for de novo assembly, during which the expression level of each gene and isoform is estimated.
Variants calling
Whole-genome resequencing data of 202 samples of the Saccharum complex species was generated and mapped to E. fulvus reference genome. We performed variant calling for 202 genomes using the ‘HaplotypeCaller’ module of GATK v3.3-0-g37228af (32) with the ‘-ERC GVCF’ setting, and all the gVCF output files were combined into a Variant Call Format (VCF) file using ‘CombineGVCFs’. Joint genotyping was conducted for each of the chromosomes using ‘GenotypeGVCFs’ with the ‘-L’ setting (33). To reduce the error rate of calling variants, SNPs were filtered by hard-filtering of ‘VariantFiltration’. SNPs were filtered with the—filterExpression ‘QUAL < 30.0 || QD < 2.0 || MQ < 40.0 || FS > 60.0 || MQRankSum < −12.5 || ReadPosRankSum < −8.0 || SOR > 5.0’ (34). Only insertions and deletions shorter than or equal to 40 bp were considered. Indels and SNPs with none biallelic, >50% missing calls and minor allele frequency (MAF) < 0.005 were removed, which yielded the basic set. Finally, a total of 55 564 488 SNPs from 202 samples including 121 Erianthus, 56 Saccharum, 19 Miscanthus, 5 Narenga and 1 Eulalia were identified. For each population, variants with an MAF less than 0.05 were filtered. Based on the annotation file, all the qualified variants were annotated using ANNOVAR v2015-12-14 (35). An in-house script was used to count the number of each annotation item.
Population structure and phylogeny
We pruned the autosomal SNPs to remove linkage disequilibrium (LD) by PLINK (Version 1.90b3.38) (36) with ‘--indep-pairwise 50 10 0.2’. Principal component analysis (PCA) was performed using Genome-wide Complex Trait Analysis (version: 1.25.3) (37). We conducted ADMIXTURE (version 1.3.0) (38) analyses with K (individual ancestry component) from 2 to 10 to infer population structure. For each K, 10 replicates were run with random seeds between 1 and 100. The seed with the lowest cross-validation error was used in the database. We used the whole-genome SNPs to construct the maximum likelihood (ML) phylogenetic tree with 100 bootstraps using MrBayes (version: 3.1.2) (39). The tool iTOL (http://itol.embl.de) was used to color the phylogenetic tree.
Implementation
The EfGD is based on the Apache webserver (http://www.apache.org), adopts ThinkPHP5.1 (http://www.thinkphp.cn) based Fastadmin template and applies programming language including PHP-HTML5 and JavaScript (JS). MySQL (https://www.mysql.com) is used for data sorting, storage and management, and the AJAX asynchronous loading scheme is used for quick data loading and function implementation. To provide an interactive use experience, Echarts (https://echarts.apache.org/zh/index.html), JBrowse (40) and viroBlast (41) have been applied.
Results
To organize different types of data and analyze the results, the EfGD was divided into eight main modules (Figure 1): the ‘Gene’ and ‘Variation’ modules are the two most important modules providing detailed information on genes and variation data; the ‘Genome’ and ‘Re-sequence’ modules provide an overall view of the genetic background of E. fulvus and phylogenetic relationship of Saccharum complex populations; the ‘Home’ and ‘About’ modules introduce the database, project and our team and the ‘Download’ module enables the download of several data types. The ‘Tools’ module provides BLAST, JBrowse and Publication services. For each module, a data description and basic functions can be seen below.
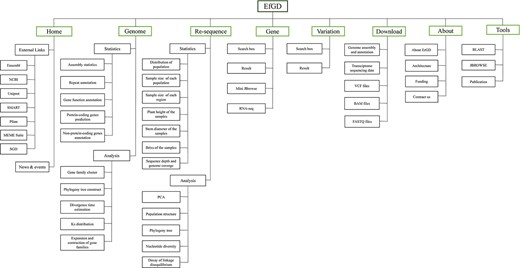
Architecture of EfGD. The EfGD was divided into eight main modules including ‘Home’, ‘Genome’, ‘Re-sequence‘, ‘Gene‘, ‘Variation’, ‘Download’, ‘About’ and ‘Tools’. The corresponding contents of each module are listed below.
Home and about
The ‘Home’ module is a landing page of the EfGD that provides an overview of the database. In addition, ‘Home’ provides external quick links to databases and news related to the Saccharum complex (Figure 2A). The ‘About’ module provides a general introduction to the EfGD and detailed contact information (Figure 2B).
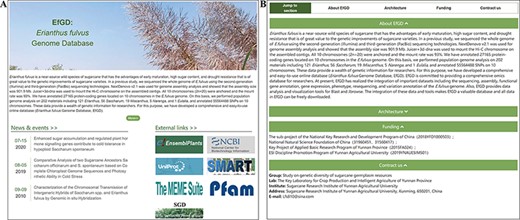
‘Home’ and ‘About’ modules. (A) ‘Home’ module, basic introduction to EfGD and external quick links. (B) ‘About’ module, detailed introduction to EfGD.
Genome
The ‘Genome’ module has two sections: ‘Statistics’ and ‘Analysis’ (Figure 3). Five parts are included in the ‘Statistics’ section: assembly statistics, repeat annotation, protein-coding genes, nonprotein-coding genes and functional annotation. This information will help users understand the E. fulvus genome more clearly. Some basic results are also included in the ‘Analysis’ section, such as gene family cluster, phylogeny tree, divergence time, expansion and contraction of gene families and Ks distribution.
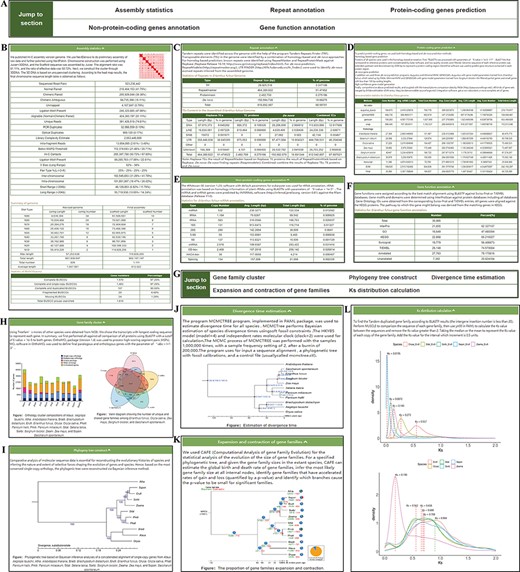
‘Genome’ module. The ‘Genome’ module has subpages: ‘Statistics’ (A–F) and ‘Analysis’ pages (G–L). (A) The navigation bar of the ‘Statistics’ page provides quick access to each section. (B) Assembly statistics. (C) Repeat annotation. (D) Protein-coding genes prediction. (E) Nonprotein-coding genes annotation. (F) Gene functional annotation. (G) The navigation bar of the ‘Analysis’ page. (H) Gene family cluster. (I) Phylogenetic tree. (J) Divergence time. (K) Expansion and contraction of gene families. (L) Ks distribution.
Re-sequence
The ‘Re-sequence’ module contains two sections: ‘Statistics’ and ‘Analysis’ (Figure 4). ‘Statistics’ presents summaries for samples embedded in the database. This page shows real-time statistics of all samples embedded in the database, and the sample information is counted from different angles and a variety of statistical graphs. The geographic distribution and summary information are shown in Figure 4A. In addition, pie charts of the sample size of each species and region are provided (Figure 4B). The phenotypic statistics of plant height, stem diameter and brix of the 202 samples are provided by the histogram (Figure 4C). Resequencing quality statistics for each sample are shown at the bottom (Figure 4D). All the figures on this page are dynamic and interactive, and users can view the current group information more clearly.
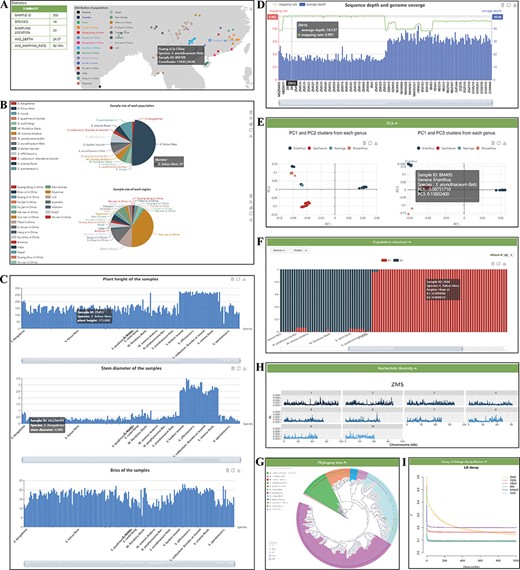
‘Re-sequence’ module. The ‘Re-sequence’ module has subpages: ‘Statistics’ (A–D) and ‘Analysis’ pages (E–I). (A) Geographic distribution of 202 individuals. (B) Sample size of each species and region. (C) Statistics of plant height, stem diameter and brix for each sample. (D) Resequencing quality statistics. (E) PCA clusters from 202 individuals. (F) Bar plot of admixture analysis for all samples with K from 2 to 10. (G) Phylogenetic tree. (H) Nucleotide diversity statistics. (I) Decay of LD.
In the ‘Analysis’ section, we provide five dynamic and interactive charts, so that users can view the information from 202 samples more clearly. The PCA part presents results for two datasets: all 202 individuals belonging to Erianthus and outgroup taxa in PC1 with PC2, and the other is PC1 with PC3 (Figure 4E). The population structure part presents the proportions of the proposed ancestry components in each sample with bar plots. The length of each colored bar indicates the proportion of representative ancestry in each individual. The number of proposed ancestries is defined by the ‘which K’ option includes ADMIXTURE clustering results for populations with K from 2 to 10 (Figure 4F). In the phylogeny tree section (Figure 4G), the ML tree of 202 samples was constructed with 100 bootstraps. In the nucleotide diversity section (Figure 4H), boxplots were used to show the genetic diversity indexes from six Saccharinae populations. The decay of the LD part presents the results for six populations (Figure 4I). In addition, the small components equipped for each graph allow filtering by the legend and the structural data can be presented by clicking the button in the upper right corner.
Gene
The ‘Gene’ page provides gene data from the latest assembly and annotation of the E. fulvus genome. Users can enter the InterPro domain, GO and KEGG orthology identifiers, key words for gene symbols or gene positions in the search box for genes or gene families and the detailed corresponding information, such as the structural and functional annotation of genes, can be acquired. Each gene entry contains 10 pieces of information, such as gene locus, chromosome location and length, and the users can select the columns that show the information they want to focus on through the upper right option of the display list (Figure 5A). In addition, we deployed a mini JBrowse window part under the table, which allows viewing the location and variation of the target gene, and the detailed sequence information by clicking (Figure 5B). In the RNA-seq expression section, users can select genes according to specific needs and observe the gene expression level from the heatmap of the ticked-related genes in the gene expression module (Figure 5C).
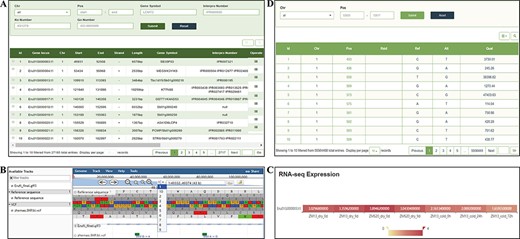
‘Gene’ and ‘Variation’ modules. (A) ‘Gene’ search module. (B) Click on Gene ID to display detailed information in the JBrowse. (C) Click on Gene ID to display the expression level. (D) ‘Variation’ module.
Variation
In the current version, the ‘Variation’ module contains 55 564 488 nonredundant SNPs from 202 resequencing materials. A search tool allows users to search information of SNP according to ‘Chr’ and ‘Pos’. The search results provide chromosome number, specific sites, Reference SNP ID (RsID) and quality information (Figure 5D).
Download
The ‘Download’ module contains information and links to almost all publicly available E. fulvus genome and transcriptome datasets, all of which are published for the first time in this database (Figure 6A). The data of the genome, transcriptome sequencing, variation files and all individuals’ whole-genome resequencing files can be downloaded from this module. If users have any questions about data uploading or downloading, they can contact us using the published contact information.
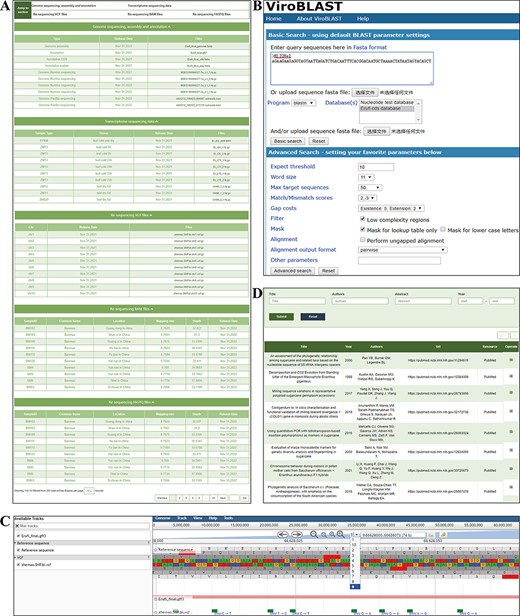
‘Download’ and ‘Tools’ modules. (A) ‘Download’ module, providing genome, transcriptome, variation and resequencing files to download. (B) BLAST Tool. (C) JBrowse tool. (D) Publication tool.
Tools
Three tools, BLAST, JBrowse and Publication, are integrated into the ‘Tools’ module, which will help users perform web-based BLAST with our assembly, focus on the target genomic region and find literature and/or books related to the Saccharum complex. The query sequence in ‘BLAST’ sections can be entered by either copying or uploading the sequence file. After setting parameters and clicking on the search bottom, the alignment result will appear on a new page, with the identities and percentage between query and subject and the alignment score. The final BLAST result can be downloaded in FASTA format (Figure 6B). Sets of genomic, gene and density information of SNP/300 kb allele frequencies can be explored using the JBrowse. Users can choose tracks of interest in the ‘Select Tracks’ menu and a region of interest. As a combination of database and interactive web pages, E. fulvus genomes, gene annotation and variants information have been imported into JBrowse. In addition, by clicking a specific data entry, the detailed feature page of data entries can be opened (Figure 6C). The ‘Publication’ section contains a total of 910 studies or books. By searching key words in title, abstract, author and/or year of publication, a list is provided and clicking on ‘Operate’ opens a new page with detailed information, such as the abstract, publication type, etc. (Figure 6D). In future updates, other interesting data will be added to the genome browser.
Conclusion and plan
The EfGD is committed to providing a comprehensive omics database for researchers. At present, the EfGD has integrated important data, including the sequencing, assembly, functional gene annotation, gene expression, phenotype, resequencing and variation annotation of the E. fulvus genome. In addition, the EfGD provides tools BLAST and JBrowse for data analysis and visualization. The integration of these data and tools makes the EfGD a valuable database.
In the future, we will update the EfGD regularly, develop more convenient online data analysis tools and integrate multi-omics, variety resources, phenotypic and trait regulation to build a comprehensive research and analysis database of E. fulvus. At the same time, we hope that many researchers will take advantage of these resources and provide comments and suggestions so that the EfGD can become a one-stop E. fulvus research platform with multifaceted omics data and analysis tools.
Supplementary data
Supplementary data are available at Database Online.
Acknowledgements
We thank many users for their valuable suggestions regarding the EfGD, thank Professor Tong Li, Director of The Key Laboratory for Crop Production and Intelligent Agriculture of Yunnan Province, for his support and thank the Network Management Center of Yunnan Agricultural University for network optimization.
Funding
Major Science and Technology Projects in Yunnan Province (202202AE090021); Biological Resources Digital Development and Application Project (202002AA100007); Special project of The Key Laboratory for Crop Production and Intelligent Agriculture of Yunnan Province (202105AG070007); Subproject of the National Key Research and Development Program of China (2018YFD1000503); National Natural Science Foundation of China (31960451 and 31560417); Key Project of Applied Basic Research Program of Yunnan Province (2015FA024); ESI Discipline Promotion Program of Yunnan Agricultural University (2019YNAUESIMS01).
Conflict of interest
There is no conflict of interest.
References
Author notes
contributed equally to this work.
