


Abstract
The set of interacting molecules collectively referred to as a pathway or network represents a fundamental structural unit, the building block of the larger, highly integrated networks of biological systems. The scientific community's interest in understanding the fine details of how pathways work, communicate with each other and synergize, and how alterations in one or several pathways may converge into a disease phenotype, places heightened demands on pathway data and information providers. To meet such demands, the Rat Genome Database [(RGD) http://rgd.mcw.edu] has adopted a multitiered approach to pathway data acquisition and presentation. Resources and tools are continuously added or expanded to offer more comprehensive pathway data sets as well as enhanced pathway data manipulation, exploration and visualization capabilities. At RGD, users can easily identify genes in pathways, see how pathways relate to each other and visualize pathways in a dynamic and integrated manner. They can access these and other components from several entry points and effortlessly navigate between them and they can download the data of interest. The Pathway Portal resources at RGD are presented, and future directions are discussed.
Database URL:http://rgd.mcw.edu
Introduction
The Rat Genome Database [(RGD) http://rgd.mcw.edu], the model organism database for the laboratory rat, provides a breadth of information ranging from genomic and genetic to molecular and pathway, and to phenotype, disease and strains [for a description of RGD resources, see Dwinell et al. (1)]. Important core objects in the database are represented by rat genes, quantitative trait loci (QTLs) and strains, among others. RGD also provides information on human and mouse genes and QTLs to enable the user to make comparisons between the three mammalian species. Information on these objects is acquired and stored based on the manual curation or via automated pipelines using several controlled vocabularies or ontologies. Tools, developed internally or developed externally and adjusted as needed, are used to store, access and mine the data and navigate between data types (2,3). In order to provide better, more comprehensive data integration, RGD has developed several portals which are continuously expanded both in number and in content. The Pathway Portal project has been initiated to cover several pathway aspects and provide a multifaceted resource. The portal offers a range of pathway data and visualization capabilities and is at the crossroads of several entry points and other portals such as the Disease Portals (1). The following sections describe the various aspects of the pathway portal's resources including the annotation of genes to pathway terms and the development of the pathway ontology, the building of interactive pathway diagrams and the provision of related navigational capabilities.
Pathway data curation and ontology development
The functional annotation of rat and, as applicable, of human and mouse genes, is an important aspect of RGD's curation efforts, with several ontologies being used in the process. Briefly described, the Gene Ontology (GO), one of the best known and widely used biological ontologies (4), is being used for the annotation of rat genes to molecular function, biological process and cellular component terms. A Disease Ontology (DO), based on the C branch of the Medical Subject Headings [(MeSH) http://www.nlm.nih.gov/mesh/] from the National Library of Medicine [(NLM) http://www.nlm.nih.gov/], is used for the annotation of rat, human and mouse genes to disease terms. The Mammalian Phenotype Ontology (MP), developed at the Mouse Genome Informatics (MGI, the Mouse Genome Database)—http://www.informatics.jax.org/ with RGD contributing terms, is used for the annotation of rat, human or mouse genes to phenotype terms as applicable. The Pathway Ontology (PW), developed at RGD and described in more detail in the following paragraph, is being used for the annotation of rat, human and mouse genes to pathway terms.
The goal of PW is to organize the various types of biological pathways, including disease and altered pathways, and the relationships between them within a hierarchical structure. The five major nodes of the ontology are: classic metabolic, regulatory, signaling, drug and disease pathways. External pathways databases and resources such as the Kyoto Encyclopedia of Genes and Genomes [(KEGG) http://www.genome.jp/kegg/], PharmGKB (http://www.pharmgkb.org/index.jsp), Reactome (http://www.reactome.org/) and others along with an extensive research of the published scientific review literature have been used to populate the nodes (5–10). Requests for new terms and/or changes for current ones by the Pathway Interaction Database [(PID) http://pid.nci.nih.gov/]—a collaborative project between the US National Cancer Institute (NCI) and Nature Publishing Group (NPG; 11) are also contributing to the expansion and development of the ontology (PID is using PW to map the human regulatory and signaling pathways it manually curates to PW terms to allow users to browse these pathways by category). Of note is the node dedicated to disease pathways and the provision of terms for the altered version(s) of a pathway. While a few pathway resources outside RGD offer disease pathways, the provision of altered pathways is a feature unique to the resources at RGD. An altered pathway is viewed as one which, due to changes in the functioning of one or several genes, deviates from the course it would normally have. As a corollary, a disease pathway is viewed as the sum of alterations in one or several pathways whose combined effects result in the inability of the system to adjust to adverse challenges and is then manifested in the diseased state. Cancer for instance, is increasingly being viewed as a disease of altered pathways (12,13).
The RGD's Pathway Ontology provides a means for the standardized annotation of genes to any type of biological pathway; it also serves as a vehicle for linking to and connecting between ontology reports, pathway diagrams and suites, disease portals and gene report pages. Pathways are selected for annotation based on the various roles they play in the context of the broader systems biology or physiological networks or in the context of diseases associated with a Disease Portal. For instance, insulin secretion and insulin signaling pathways are essential components of cellular glucose homeostasis and the impairment of both has been linked to type 2 diabetes mellitus. Insulin signaling, along with the action of other hormones such as leptin, is also important for proper energy homeostasis and disturbances in the control of energy balance have been associated with obesity and related conditions. Both insulin and leptin are receptor-activating ligands and rely on triggering downstream signaling pathways to fulfil their roles. For any pathway targeted for annotation, the review literature is extensively researched in order to identify the components of the pathway. Once a set of component genes has been identified, the rat, human and the mouse gene complements are annotated to the pathway term. The rat genes are also functionally annotated to the appropriate GO terms based on the rat experimental literature. In the case of disease and altered pathways, the genes whose mutations have been implicated in an altered pathway associated with the condition are annotated to the respective disease and altered pathway terms, in addition to the regular pathway and DO terms. Thus, annotations to disease pathway terms are made for those genes known to be dysfunctional in the context of an altered pathway. Disease annotations on a gene-by-gene basis are made using the DO. If there is an interactive diagram for a particular disease pathway, a link is provided to the DO Report page. The report lists all the genes that in some way have been associated with the condition and have been annotated to the respective disease term (see ‘Interactive pathway diagrams and pathway suites’ section). Supporting references for pathway and functional annotations are found in the gene report pages (see ‘Pathway data entry points and navigational capabilities’ section). A copy of the ontology in OBO format and the annotation files for the three species are available for download from the RGD ftp site at ftp://rgd.mcw.edu/pub/data_release/ and ftp://rgd.mcw.edu/pub/data_release/annotated_rgd_objects_by_ontology/, respectively. The ontology can be explored on the RGD website at http://rgd.mcw.edu/wg/pathway?100 or using RGD's ontology browser (see ‘Pathway data entry points and navigational capabilities’ section below), in the National Center for Biomedical Ontology's (NCBO) BioPortal at http://bioportal.bioontology.org/ontologies/42912 and the European Bioinformatics Institute's (EMBL-EBI) Ontology Lookup Service (OLS) at http://www.ebi.ac.uk/ontology-lookup/browse.do?ontName=PW.
Interactive pathway diagrams and pathway suites
The graphical rendition of a pathway is of great interest as it allows users to instantly see how the interacting partners, their adapters, effectors and regulators mold the molecular network and define its outcomes. RGD's interactive pathway diagram pages and the more recently added pathway suites are important components of the Pathway Portal. The diagrams are built using the Pathway Studio software package from Ariadne Genomics—http://www.ariadnegenomics.com/—and the diagram pages are built within a Content Management System (CMS). The elements of an interactive pathway diagram page consist of a description and the diagram of the pathway, a legend for entities, relationships and shapes, lists of abbreviations and references, and an import option for users of Ariadne. Protein domains mentioned in the description link to their entries in the Pfam database (http://pfam.sanger.ac.uk/); the description concludes with links to the pathway ontology report page and as applicable, to related GO term or DO term ontology report page(s), KEGG map, PharmGKB report and/or Reactome entry. Every component in the diagram links to a source of more information: for instance, protein or protein-related icons link to the corresponding RGD gene report page or to a dynamic list of genes, small molecules in the diagram or in a list, link to the corresponding PubChem (http://www.ncbi.nlm.nih.gov/pccompound/), Chemical Entities of Biological Interest [ChEBI (http://www.ebi.ac.uk/chebi/)] or the Comparative Toxicogenomics Database [CTD (http://ctd.mdibl.org/)] entry. Accompanying references link to their PubMed abstracts (http://www.ncbi.nlm.nih.gov/pubmed/). Very importantly, triggered or otherwise connected pathways present in the diagram link to their Ontology Report pages. Each ontology report contains the GViewer—a tool displaying the genome-wide view of rat chromosomes indicating the positions of the annotated genes. The report lists all the genes annotated to the term and shows the path(s) to the pathway term in the ontology. If there is a diagram page for that pathway term, its icon is shown on the top of the report page and it links to the interactive diagram page. Thus, users can ‘walk’ from one pathway to another, follow the journey of a signal, navigate between connected networks and explore their individual features. They can compare the normal and the altered versions of a pathway, and examine the role an altered pathway may play in the development of a disease and how drugs attempt to counteract it. The unique ID of the pathway term, along with features of the Ariadne and CMS software and bioinformatics approaches make such pathway expeditions possible. As an example, the interactive diagram page for the ‘testosterone biosynthetic pathway’ can be accessed directly from the list of current diagrams using the ‘Pathways’ entry point of RGD's home page (Figure 1A and B); it can also be accessed via the ‘steroid hormone biosynthetic pathway’, the ‘androgen signaling pathway’ (Figure 2A) or the ‘altered androgen signaling pathway’ diagram pages. The ‘altered androgen signaling pathway’ in turn, provides links to the normal ‘androgen signaling pathway’ and the ‘prostate cancer pathway’ (Figure 2B) diagram pages, and to the Cancer Portal while the ‘prostate cancer pathway’ provides the reciprocal links to the altered pathway and portal. In addition, the ‘prostate cancer pathway’ page also provides a link to the DO report page for Prostatic Neoplasms which lists all the genes that in some fashion have been associated with the condition or suspected to confer susceptibility and are annotated to the term. The aforementioned Cancer Portal, one of several Disease Portals so far released, has targeted breast, urogenital and pancreatobiliary neoplasms. Other cancer types will be targeted in the future. A description of the Disease Portals project is beyond the scope of this article; the interested user can check the 'Diseases' entry point in the main home page or take a video tour (see ‘Pathway data entry points and navigational capabilities’ section). The diagram for the ‘prostate cancer pathway’ has recently been updated to provide information on miRNAs aberrantly expressed in human prostate tumors; each listed miRNA has a link to its entry in RGD and in the microRNA database, miRBase (Figure 2B, inset). Announcements on more important pathway diagram updates as well as newly published ones can be found in the Latest News section and the rotating banner in the main home page (revisit Figure 1A).
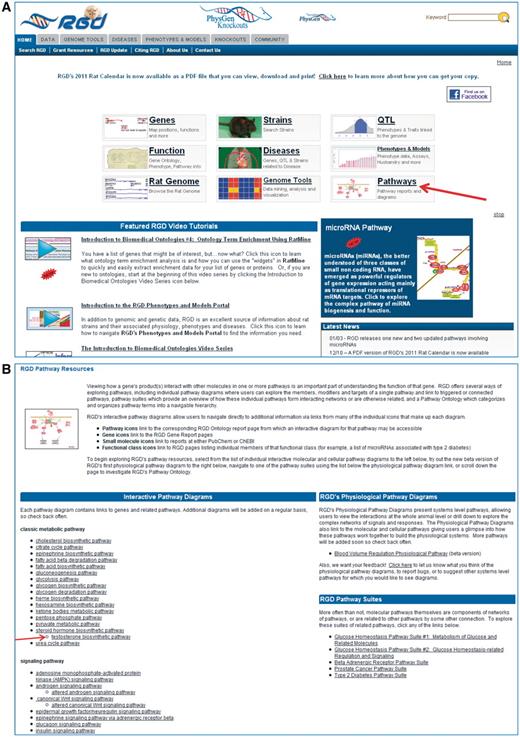
Shows a partial view of RGD's home page with the main entry points, video tutorials, rotating banner and the Latest News sections, with an arrow pointing to the Pathways entry (A) and the top portion of RGD's Pathway Resource page the Pathway entry brings, housing the interactive pathway diagram pages and pathway suites and physiological pathway diagrams with an arrow pointing to the ‘testosterone biosynthetic pathway’ (B).
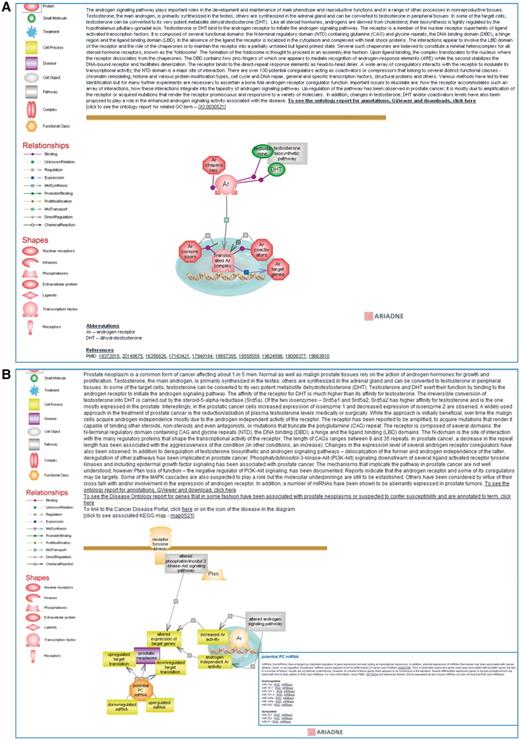
Shows a partial view of the interactive diagram page for the ‘androgen signaling pathway’ (A) and for the ‘prostate cancer pathway’ with the inset showing the list of miRNAs of potential interest in prostate cancer which can be accessed by clicking on the functional class icon (B).
While users can choose the direction or even the length of their pathway trip, an easy to follow visual overview of pathways, connected or otherwise related within a larger network, is provided by the pathway suites. Each suite offers an instant snapshot of the larger picture that brings together various types of pathways. It provides a roadmap of the network that connects several pathways and as applicable, their altered counterpart(s), disease and associated drug pathways. This is particularly useful in cases like diseases, when the global picture is more complex or when users may be less familiar with a topic. For instance, while most of the currently available diagrams are covering metabolic, signaling and regulatory pathways and the newer collection of disease and drug pathways is still small, the first published suites have addressed networks involving diseases and drugs. As an example, the prostate cancer pathway suite (Figure 3) shows the ‘normal’ road leading from steroid hormone to testosterone biosynthesis and to subsequent signaling via the androgen receptor and the ‘defective’ path connecting alteration in androgen signaling to prostate cancer. More recently published suites deal with the many aspects involved in maintaining the homeostasis of glucose (Figure 1B). A more experienced user can easily find pertinent pathways from the list of published diagrams and tailor the trip according to one's needs and via the links provided to find answers to questions such as how is glucose processed or stored, how does the system respond to changes in its circulating concentration, whether such responses may falter in type 2 diabetes and if so, whether drugs are being developed. However, the less familiar user may find it helpful to peruse the travel guide offered by the two suites for glucose homeostasis. ‘Glucose Homeostasis Pathway Suite #1: Metabolism of Glucose and Related Molecules’, as the name suggests, brings together various pathways of glucose metabolism such as oxidation and conversion, biosynthesis and storage. ‘Glucose Homeostasis Pathway Suite #2: Glucose Homeostasis-related Regulation and Signaling’ brings together insulin secretion and the insulin responsive glucose transport along with the insulin and glucagon signaling pathways. The two suites are linked to each other and from both one can navigate to the Type 2 Diabetes Pathway Suite and the Diabetes Disease Portal. The two hypothetical users can thus get to the same basic information, albeit following somewhat different routes. Each pathway suite contains a brief description of what is presented; icons of the individual pathway diagrams are grouped by categories as applicable, and are displayed with the name of the pathway term above and a short description of the pathway. From the title, the icon or a ‘click here’ indicator in the short description, the user can link to the respective pathway diagram page.
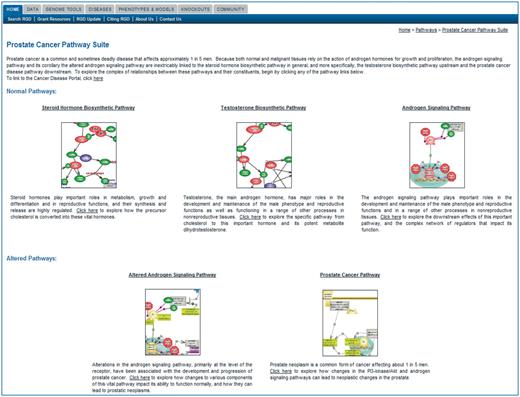
Shows the Prostate Cancer Pathway Suite.
A newly developing resource is represented by the Physiological Pathway Diagrams. This feature is the latest addition to the portal resources and its goal is to offer a systems level pathway view (revisit Figure 1B).
Pathway data entry points and navigational capabilities
Some of the pathway entry points and navigational capabilities RGD offers have already been mentioned in the previous sections. The current section will briefly summarize how pathway data can currently be accessed and how users can navigate between the various kinds of pathway data and other data types. An obvious entry point is ‘Pathways’ in the main home page of RGD's website; it provides an overview of pathway resources, houses the dynamic list of all published interactive pathway diagram pages and pathway suites, and has links to physiological pathway pages (Figure 1A and B). ‘Diseases’ entry point in the main home page provides links to the five Disease Portals that have been released so far: Diabetes, Obesity/Metabolic Syndrome, Cancer (breast, urogenital and pancreatobiliary), Cardiovascular and Neurological. The disease portal search options include diseases (default) and associated phenotypes, biological processes and pathways; the results provide lists of annotated objects and links along with tools. Searches can be narrowed by selecting given categories and entries within the category. For instance, in the cancer portal, one can select ‘cell death pathway’ as a pathway category and then choose the ‘intrinsic apoptoptic pathway’ or one of the extrinsic, death receptor-mediated pathways. The results show a summary of the number of rat, human and mouse genes annotated to the selected term(s), the list of individual genes by species, the GViewer for the rat genes with the option of viewing the human or mouse GViewer, or the rat–human or rat–mouse synteny, and an overview of GO annotations by vocabulary type. Individual gene reports pages can be accessed from either the gene list or the GViewer.
Users can search one or several ontologies via the Ontology Browser or the Genome Viewer accessible from Data/Ontologies on the home page or from Genome Tools/GViewer, respectively, and proceed to explore the vocabulary or see the ontology report for a term of interest. As an example, selecting the pathway ontology in the ontology browser and typing in ‘glucagon’ will bring up all the terms in the ontology that contain the word glucagon. Clicking on the tree icon to the right of a term will show the position of that term within the vocabulary and the path(s) to it; clicking on a term will bring up the ontology report page for that term. As mentioned, the ontology report shows the term and its definition, the GViewer for the rat genes, the list of annotated genes (across the three species), path(s) to the term and if there is an interactive pathway diagram available, the icon of the diagram (Figure 4A and B). The default mode for annotations is term-only; one can switch to term-and-descendants mode by clicking on the toggle provided (the arrow in Figure 4A). The GViewer allows users to add objects to the genome view. For instance, a second ontology term can be chosen giving a comparison of the rat genes annotated to the two terms. Users are also given the option of exporting selected lists of annotated objects from the GViewer. From within the ontology report, the user can choose to see the interactive pathway diagram page, if one exists, to explore the vocabulary or get to the report page of a gene of interest. The gene report page contains all the annotations listed by ontologies along with supporting references and other information types and links to orthologous human and mouse gene report pages and to external sources. Selecting any of the ontology terms from the annotation list will bring up the ontology report page for that term.
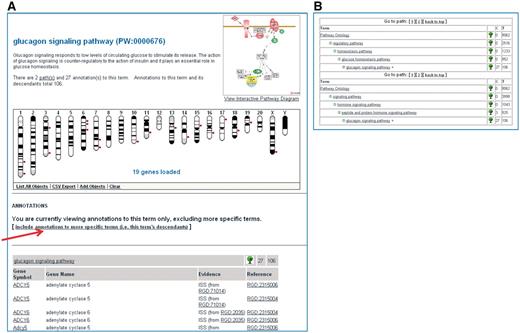
Shows a partial view of the Ontology Report page for the ‘glucagon signaling pathway’ (A) and the path(s) to the ‘glucagon signaling pathway’ term within the ontology (B).
RatMine [(http://ratmine.mcw.edu/ratmine/begin.do)] is another tool for finding information on rat genes including annotations to particular pathway and other ontology terms via a number of predefined templates or queries. Results originating from a predefined query or those arrived at based on the pathway diagrams and ontology searches can further be analysed. For instance, selected data sets can be compared for shared or uniquely represented genes or looked up for term enrichment across several ontologies. Additional resources and links allow for integration of data sets with protein-related analyses and visualization.
Conclusions and future directions
RGD has adopted a multitiered approach for the acquisition, dissemination and visualization of pathway data that includes ontology development and accompanying annotations along with the provision of pathway diagram pages and related tools. Pathway ‘walks’ mediated by the unique pathway ontology identifier and global connectivity views provided by the pathway suites allow users to explore the range of relationships between various types of pathways while the individual diagrams offer the picture of the molecular underpinnings of a particular pathway as presently understood. The annotation of genes to pathway terms and, beginning in early 2008 the graphical representation of pathways, constitute routine curation activities; they also promote the expansion of the ontology. As mentioned, the pathway suites are a relatively new feature with the first being published in 2010. New diagrams and associated annotations are released on a regular basis; in the process, new suites are being built and updates to existing diagrams are being made. A glimpse of this is captured as entries on the rotating banner and is briefly summarized in the ‘Latest News’ section; both are housed on the main home page of RGD's website. As of the time of this writing, there are over 9400 pathway annotations in the database and over 75 interactive pathway diagrams have been published. The pathway resources that RGD offers are of great interest and are a source of inspiration to the user community as evidenced by the number of hits they receive and the upgrades or novel trends exhibited at other places. Ongoing work will continue to be devoted to increasing the current collection of diagram pages; future efforts will seek to provide more comprehensive views of the interconnected and global networks. This includes the addition of new and updated pathway suites, updated interactive diagrams as well as the integration of molecular pathways within the broader context of physiology and systems biology. A better coordination between and integration of drug and disease pathways with the set of pertinent metabolic, regulatory or signaling pathways and of altered pathways with related genomic, genetic and clinical data are being considered. The development of new and/or the upgrading of existing tools as the breadth of information expands and the extent of data integration deepens will continue to constitute one of RGD's priorities.
Methods
The Pathway Ontology is being built using the OBO-Edit software tool developed by the GO Consortium (14). The pathway diagrams are being built using the Pathway Studio software tool developed by the Ariadne Genomics group [http://www.ariadnegenomics.com/]. The package includes the ResNet mammalian database containing entries for rat, human and mouse genes, small molecules, processes, diseases and accompanying information. In addition, new properties can be added in ResNet and values can be assigned to these properties. This feature has been exploited to provide PW IDs for pathways in a diagram as well as links for lists of genes and for small molecules to their entries in PubChem, ChEBI or CTD. When a pathway diagram is saved as an html, a folder with the pathway name is created with the files for all entities in the diagram and their associated information in ResNet. The folder is ftp-ed to the RGD's website; a script parses the files in the folder for RGD:IDs, PW:IDs and other links created in ResNet. This allows for entries in the diagram to link to gene report pages, dynamic lists of genes, pathway ontology reports or PubChem, as applicable. The diagram pages are being built using the WebGUI CMS. A pathway template with the legend for entities, relationships and shapes, has been created in the CMS for the pathway diagram pages. Within the template, articles for the description, the abbreviations and references, and the Ariadne import option are created and if applicable, for lists of genes and other objects (e.g. miRNAs). Lists of genes are being made for members of a class when there are too many to be displayed on the diagram page or for target genes. An HTTP Proxy utility is used to bring in and display the diagram in the page. Links such as those to ontology report pages or entries at various pathway resources and links to PubMed and Pfam databases are created within the CMS.
Funding
Funding for open access charge: National Heart, Lung and Blood Institute on behalf of the National Institutes of Health [5RO1HL064541].
Conflict of interest. None declared.
