


Abstract
We previously developed NetPath as a resource for comprehensive manually curated signal transduction pathways. The pathways in NetPath contain a large number of molecules and reactions which can sometimes be difficult to visualize or interpret given their complexity. To overcome this potential limitation, we have developed a set of more stringent curation and inclusion criteria for pathway reactions to generate high-confidence signaling maps. NetSlim is a new resource that contains this ‘core’ subset of reactions for each pathway for easy visualization and manipulation. The pathways in NetSlim are freely available at http://www.netpath.org/netslim.
Database URL:www.netpath.org/netslim
Introduction
Advances in methods for the detection and identification of proteins, particularly their post-translational modifications (PTMs) and protein–protein interactions (PPIs) have contributed enormously to our understanding of signal transduction. However, such information available in the literature is heterogeneous with respect to molecules and their reactions in various signal transduction pathways. The spatiotemporal organization and behavior of proteins still remains a sizeable challenge to the scientific community. Although these concerns have yet to be fully addressed, currently available signaling reactions do provide a basic framework to investigate the molecular mechanisms and dynamics of signal transduction events. Indeed, composite maps of these signaling events are often used to visualize, hypothesize and to develop mathematical models to predict the behaviors of normal and diseased cells (1, 2). Moreover, these signaling maps can also be overlaid with biological data from various high-throughput experimental platforms to obtain an integrated view of biological processes (3, 4).
NetPath (http://www.netpath.org) is a publicly available resource of comprehensively and manually curated signal transduction pathways (5) developed previously by our group using an open-source pathway annotation tool, PathBuilder (6). NetPath already includes numerous molecules and reactions which are not included in pathways or signaling maps available elsewhere (7). It can be argued that although all of the reactions in NetPath are derived from the literature, many of the pathways in NetPath are already too unwieldy because of the large number of molecules in each pathway and the large number of reactions. The Gene Ontology consortium developed GO Slim as a way to generate a list of core GO terms (8). Here, we applied more stringent criteria to pathways in NetPath to develop a similar ‘slim’ version of pathways containing only high-confidence reactions as a means to generate less complex and more easily visualized version of individual signaling pathways. These newly generated ‘slim’ signaling maps, designated NetSlim, are freely available through http://www.netpath.org/netslim.
Development of NetSlim
NetPath currently contains a number of cancer and immune signaling pathways whose reactions are available in standard formats including proteomics standards initiative—molecular interactions (PSI–MI) and biological pathway exchange (BioPAX) formats (5, 9–12). The pathway reactions are categorized as: (i) PPIs comprising both binary and complex interactions; (ii) enzyme–substrate reactions comprising both direct and induced catalyzed reactions; (iii) transport events that specify movement of molecules across distinct subcellular compartments; and (iv) differential gene expression coupled to transcriptional regulators, if known. Each reaction is linked directly to the published literature and information pertaining to the host organism, cell-type and subcellular location.
Criteria for NetSlim
In generating NetSlim, we applied the following inclusion criteria to extract a high confidence set of reactions from pathways in NetPath: (i) reactions supported by at least two research articles; (ii) reactions shown to occur in multiple cell types (iii) PPIs reported through high-throughput analyses, as well as induced PTMs identified using mass spectrometry are included if they are supported by any other experimental method; (iv) components of well established protein complexes even if they do not meet other criteria; and (v) molecules or reactions described in expert review articles. Schematic representation of the NetSlim criteria is provided in Figure 1. Reactions that fulfilled one or more of the above criteria were included in NetSlim.
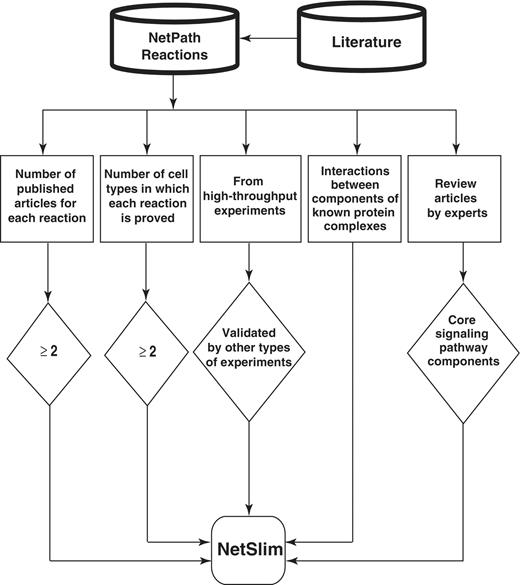
Schematic representation of the criteria used to select high-confidence pathway reactions from NetPath for NetSlim. Reactions supported by at least two research articles are considered confident. Reactions shown to occur in multiple cell types for specific pathways are also included. NetSlim further incorporates reactions reported through high-throughput analyses which were validated by a focused experiment (in the same research article or another research article). The interactions between components of known protein complexes are included to obtain a general view of a pathway. Molecules or reactions established through expert review articles are considered for NetSlim in order to provide the core set of reactions in a given pathway.
Graphical representation of NetSlim
The signaling pathway maps of NetSlim were generated using the PathVisio tool which facilitates editing and display of biological pathways (13). PathVisio is an improved visualization tool which incorporates all the features of GenMAPP (14). All molecular reactions that occur downstream of activated receptors are represented by solid edges, which depict direct interactions/reactions, or by dashed edges, which depict indirect/induced events. Signaling nodes are depicted based on the ability of molecules to interact with their partners, and on the availability of protein regulators for cross-talk with other signaling modules. The topology of the pathway, which determines whether a given molecule lies upstream or downstream from another reference molecule, is generally dependent on the biological information obtained from studies using mutants or inhibitors of specific molecules. The edges representing various PPIs, enzymatic reactions or protein translocation events are distinguished from each other by distinct colors. NetSlim maps with detailed legends are available at http://www.netpath.org/netslim. Pathway maps with nodes hyperlinked to specific NetPath molecule page and the edges linked to their corresponding citations can be obtained by clicking on ‘map with citation’ option in the NetSlim pathway pages. The browsing features and the information provided in NetSlim are shown in Figure 2 with TGF beta pathway as an example.
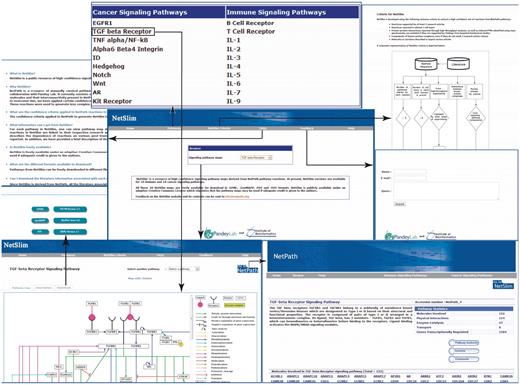
An overview of NetSlim. The NetSlim home page has options to browse the pathway maps. A description of the criteria used for NetSlim is available as a separate tab. Choosing a pathway such as the TGF beta signaling pathway, the ‘Pathway map’ tab provides access to the TGF-β NetSlim pathway map image and the ‘Description’ tab which has a brief description of the pathway. The ‘map with citation’ provided in the NetSlim pathway page contains molecules linked to specific NetPath molecule pages and their reactions linked to their corresponding citations. NetSlim maps can be downloaded in different file formats from specific pathway pages. The NetSlim data is also available to download in BioPAX, PSI-MI and SBML formats. A ‘Feedback’ page allows users to provide comments about the NetSlim resource. A link to NetSlim is provided on each pathway page in NetPath and vice versa.
NetSlim map of the TGF-β pathway as a model
The signal transduction mechanisms underlying the pathophysiological activities of transforming growth factor-β (TGF-β) have been extensively studied since its discovery nearly 30 years ago. Mammals express three TGF-β isoforms (i.e. TGF-β1, TGF-β2 and TGF-β3) that are encoded by distinct genes in a tissue-specific and developmentally regulated manner (15). In addition, numerous studies have clearly established TGF-β as a multifunctional cytokine that plays essential roles in regulating virtually all aspects of mammalian development and differentiation, and in maintaining mammalian tissue homeostasis (15–18). Even more remarkably, malignant cells have evolved a variety of complex mechanisms capable of circumventing the tumor suppressing activities of TGF-β, and in doing so, typically convert the functions of TGF-β to that of a tumor promoter, particularly the induction of carcinoma epithelial–mesenchymal transition, invasion, and dissemination to distant organ sites (15–18). This peculiar conversion in TGF-β function is known as the ‘TGF-β Paradox’, which underlies the lethality of TGF-β in metastatic cancer cells. Thus, elucidating the effectors and signaling modules activated by TGF-β may offer new insights into the development of novel neoadjuvants capable of effectively targeting the TGF-β pathway to significantly improve the clinical course of patients with cancer, fibrosis or immunologic disorders.
TGF-β is secreted from cells as a latent homodimeric polypeptide that becomes tethered to the extracellular matrix by latent-TGF-β-binding proteins. Mature TGF-β isoforms are activated and liberated from extracellular matrix depots by a variety of mechanisms, including proteolysis, reactive oxygen species, changes in pH and physical interactions with integrins, thrombospondin-1 or SPARC (19–22). Once activated, mature TGF-β initiates transmembrane signaling by binding to two distinct transmembrane Ser/Thr protein kinases, termed TGF-β type I (TβR-I) and type II (TβR-II) receptors (23–25). In some cells and tissues, TGF-β also binds to a third cell surface receptor, TGF-β type III (TβR-III), which transfers TGF-β to TβR-II and TβR-I (26). Full activation of these cytokine:receptor ternary complexes transpires upon TβR-II-mediated transphosphorylation and activation of TβR-I (27, 28), which then phosphorylates and activates the latent transcription factors, Smad2 and Smad3 (29, 30). Afterward, phosphorylated Smad2/3 interact physically with Smad4, with the resulting heterotrimers translocating into the nucleus to regulate the expression of TGF-β-responsive genes (29, 30). These Smad-dependent events are subject to fine-tuning and crosstalk regulation in the cytoplasm by their interaction with a variety of adapter molecules, including SARA, Hgs, PML and Dab2 (31–34), and with Smad7 (35, 36), whose inhibitory activity is modulated by STRAP, AMSH2 and Arkadia (37–39); and in the nucleus by their interaction with a variety of transcriptional activators and repressors that occur in a gene- and cell-specific manner (40). In addition to activating canonical Smad2/3-dependent signaling, accumulating evidence clearly links the development of a variety of human pathologies to aberrant coupling of TGF-β to its noncanonical effector molecules. Included in this ever expanding list of non-canonical signaling molecules stimulated by TGF-β are PI3K (41), AKT (42), mTOR (43), integrins (44) and focal adhesion kinase (45), and members of the MAP kinase [e.g. ERK1/2 (46), JNK (47) and p38 MAPK (48)] small GTP-binding proteins (e.g. Ras, Rho and Rac1) (18).
The TGF-β-signaling pathway constructed in NetPath currently contains 226 proteins that participate in 482 reactions comprised of 340 molecular association events, 105 enzymatic events and 37 translocation events. Graphical representation of these molecules in their entirety is quite cumbersome, thus making their meaningful interpretation difficult for biologists users of the NetPath resource. Further many NetPath molecules and their reactions are supported by either single publications or derived from high-throughput experiments lacking secondary experimental validation. While the entire network is useful, especially to gain coverage in gene expression analyses, users often want to see only the high confidence regions of a pathway and this is currently difficult to construct. We have now involved experts from the field to contribute their knowledge to NetSlim with regard to the inclusion or exclusion of molecules in high confidence datasets. For instance, the presented NetSlim model of TGF-β pathway possesses 121 proteins involved in 252 reactions with 173 molecular associations, 60 enzyme catalysis reactions and 19 translocation events, almost half the size of the full NetPath pathway. Review articles contributed to the inclusion of ∼30% of the reactions in TGF beta NetSlim pathway map. There were many reactions which were derived from high-throughput experiments but were not included because no further validation was conducted.
As such, this TGF-β NetSlim model represents the ‘core TGF-β pathway’ parsed from the less stringent and all inclusive resource, NetPath. Despite its trimmed appearance, our NetSlim model still presents more molecules and reactions as compared to major publicly available pathway resources containing the same pathway, such as Kyoto Encyclopedia of Genes and Genomes (KEGG) (49), National Cancer Institute’s Pathway Interaction Database (PID) (50), Science's Signal Transduction Knowledge Environment (STKE) Connections Maps (51), Reactome (52) or PANTHER (53). Some of the pathway resources developed by commercial entities have been customized to better reflect their available product line and reagents, thus presenting a skewed and distorted view of the underlying signal transduction pathways. Our new high confidence map of the TGF-β signaling system is shown in Figure 3. The NetSlim criteria have greatly diminished the complexity of the current pathway map and we hope that they will prove useful to the community.
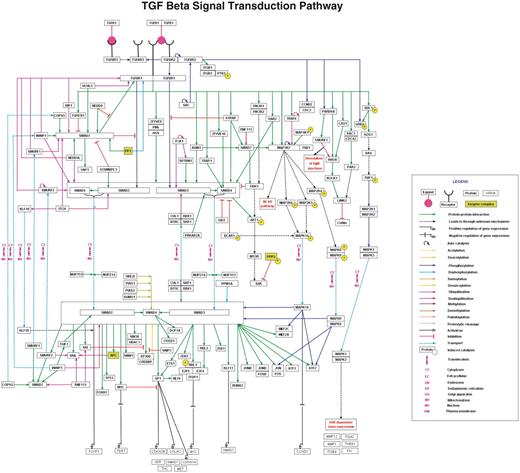
TGF-β pathway in NetSlim. The TGF-β pathway map represents the molecular reactions induced by the binding of TGF-β 1 to TGF-β receptor complex. The annotated NetSlim pathway for TGF-β possesses 121 proteins involved in 252 reactions with 173 molecular associations, 60 enzyme catalysis reactions and 19 translocation events. The nodes and edges represent the molecules and their reactions, respectively. A key for the various symbols, colors and abbreviations used in the pathway diagram is provided.
Impact of NetSlim criteria
The NetSlim criteria used to extract high confidence reactions from NetPath have considerably reduced the complexity of the pathway maps. However, as mentioned above, these pathway maps contain more molecules and reactions than other pathway resources available in the public domain. We have captured reactions described in the review articles while many others are still not included in reviews of the respective pathways in spite of being high confidence. The reactions identified in multiple cell types could be captured from single or multiple research publications and contribute to the list of high-confidence reactions. A comparison between the total number of molecules and the reactions in NetSlim and NetPath is provided in Figure 4.
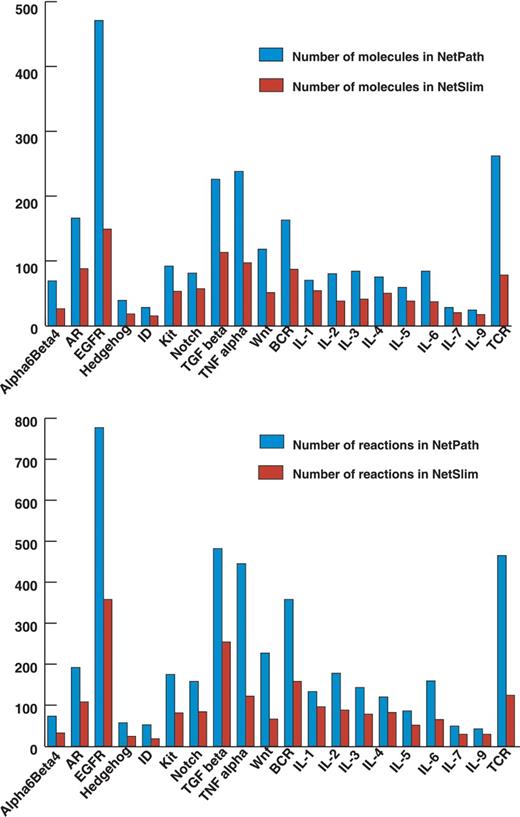
Comparative statistics of molecules and reactions in NetPath and NetSlim. The bar diagram represents the total number of molecules (A) and reactions (B) in signaling pathways in NetSlim and NetPath.
Data availability
Twenty NetSlim maps are currently available, one for each currently available NetPath pathway. NetSlim maps are freely available to download in .gpml and .mapp formats to facilitate overlay of gene or protein expression data. The NetSlim data is available to download in BioPAX, PSI-MI and SBML formats which can be used for the visualization and analysis using software such as Cytoscape (54), Ingenuity pathway analysis, Visualization and layout services for BioPAX pathway models (VISIBIOweb) (55) or Chisio BioPAX Editor (ChiBE) (56). The NetSlim maps are also available in PNG, and PDF formats for visualization and presentation. All data is made available under the Creative Commons license version 2.5 (57).
Future directions
Gene Ontology terms will be provided whenever functional significance of the nodes or edges are assayed using inhibitors, mutants, knockouts or silencing studies. We anticipate making both NetPath and NetSlim versions available for each pathway as they are curated by our team. We are also planning on making the pathway maps available in the Systems Biology Graphical Notation (SBGN) (58) format in the near future. Finally, we will keep this resource somewhat flexible so that the criteria can be updated depending upon input from the community and pathway experts.
Conclusion
Expanding application and increasing demand of various high-throughput techniques in proteomics have greatly accelerated the pace by which mechanistic details of signal transduction pathways are uncovered. Given the enormity of molecular reactions in the context of pathways already described to date, it is clear that we need to initiate systematic efforts at developing comprehensive pathway resources. NetSlim is an initial step to develop high-confidence pathway-specific reaction maps. We hope to involve the biomedical community as a means to improve the quality and accuracy of pathways in NetSlim and to keep them updated on an ongoing basis. We hope to establish a model where NetPath and NetSlim versions of individual signaling pathways will be curated centrally by our team and published in peer-reviewed journals with pathway authorities and other contributing biologists from the community as coauthors. Finally, we believe that NetSlim will serve the biomedical community in directing and undertaking novel pathway-based systems biology approaches that have hitherto not been possible.
Funding
Department of Biotechnology (DBT), Government of India research support to the Institute of Bioinformatics, Bangalore; Senior Research Fellowship from the Council of Scientific and Industrial Research (CSIR), India (to R.R., J.S., B.M., S.M.P.); Senior Research Fellowship from the Indian Council of Medical Research (ICMR), India (to D.T.); Junior Research Fellowship from CSIR (to A.R., G.J.S. and S.N.C.); Junior Research Fellowship from the University Grants Commission (UGC), India (to Y.S., N.S., S.M.S., S.A.). Young Investigator award from DBT (to T.S.K.P.); Wellcome Trust-DBT India Alliance Early Career Fellow (to H.G.). Funding for open access charge: Department of Biotechnology, India.
Conflict of interest. None declared.
Acknowledgements
The authors thank all the ‘Pathway Authorities’ who have reviewed and provided valuable feedback on the NetSlim maps.
References
Author notes
#Equal contributors
