


Abstract
Recently, we created IntOGen, a resource to integrate a large amount of cancer genomic data. IntOGen aims at facilitating the detection of the most recurrent alterations that drive tumorigenesis. It collates, annotates and analyzes high-throughput data about transcriptional, genomic and mutational changes taking place in tumors from different studies annotated with specific cancer types. Currently, it contains 118 studies for mRNA expression profiling and 188 studies for genomic alterations covering in total 64 different tumor topographies. In this article, we describe the Biomart portal for IntOGen. The portal provides easy access to different types of data and facilitates the bulk download of all the analysis results. Here, we describe the general features of IntOGen and give example queries to demonstrate its use.
Database URL: www.intogen.org.
Project description
Tumorigenesis is characterized by the accumulation of a multitude of alterations. High-throughput techniques have become common in the study of these alterations. However, the analysis of this type of data is challenging. One of the main difficulties is in sorting out the alterations that drive tumorigenesis from those that are only byproducts of the high number of divisions cancer cells undergo and have no effect on the cancerogenic phenotype. Moreover, the existence of different types of alteration makes the detection of causative ones even more difficult. Hence, it is clear the need for approaches to analyze and integrate cancer genomics data. IntOGen integrates high-throughput data related to different types of alterations taking place in cancer such as copy number alterations, point mutations and transcriptomic changes from many independent studies to identify the genes and modules (e.g. KEGG pathways, GO terms) more significantly altered in different tumor types (1).
Data content and sources
The data in IntOGen consists of publicly available cancer genomic studies collected from databases such as Gene Expression Omnibus (GEO) (3), ArrayExpress (4), Cosmic (5), Progenetix (6), the Sanger Cancer Genome Project (http://www.sanger.ac.uk/genetics/CGP/) and the data portal of The Cancer Genome Atlas (7). Each study contains results from high-throughput analyses of a number of human primary tumor samples compared to normal cells (normal cells of the same tissue in the case of expression) related to one or more types of cancer for a specific alteration. At the first step, all the samples in the study are annotated with appropriate terms from International Classification of Disease for Oncology (ICD-O) (8): a topography term indicating location in human body and, if available, a morphology term describing histological classification. Studies are also annotated with the platform(s) used for the experiment. An experiment in IntOGen consists of a set of assays coming from the same study that have been performed with the same platform. The analysis pipeline groups the assays in ‘analysis units’, which correspond to a set of assays in one experiment annotated with the same topography and morphology. Furthermore, ‘analysis units’ are also created with assays in one experiment annotated with the same topography and any morphology (Figure 1). Thus, one study can generate several ‘analysis units’. Table 1 summarizes the number of studies, experiments and analysis units included in the current version of IntOGen (v03).
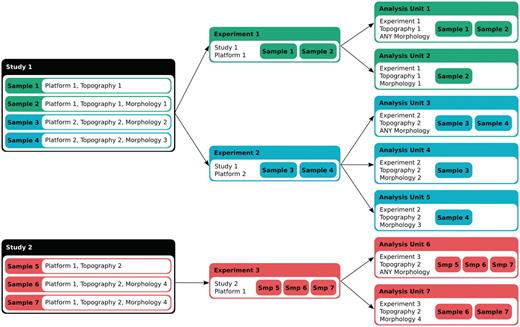
Data annotation and classification. Each sample assay in a study is annotated for the platform and the ICD-O topography and morphology terms. An experiment in IntOGen consists of a set of assays coming from the same study that have been performed with the same platform. The analysis pipeline then generates overlapping groups of assays from the same experiment in ‘analysis units’ in two ways, 1) according to the topography and the morphology, and 2) according to the topography (with the morphology annotated as ‘Any morphology’).
Summary of the data content in IntOGen (v03)
| Alteration type | Main data sources | Number of independent studies | Number of experiments | Number of analysis units |
|---|---|---|---|---|
| Transcriptomic | GEO | 118 | 122 | 243 |
| ArrayExpress | ||||
| TCGA | ||||
| Genomic (copy number) | Progenetix | 188 | 188 | 343 |
| Sanger Cancer Genome Project | ||||
| TCGA | ||||
| Total | 306 | 310 | 586 |
Data analysis in IntOGen
In IntOGen framework, the analysis is performed at different levels: on one side each experiment is analyzed independently (experiment level) and those experiments classified with the same topography and morphology terms are combined (combination level). Also on the other side, the analysis is performed at the level of genes (gene level) and at the level of modules (module level). A module is defined by a set of genes with some biological property in common, we currently analyze Gene Ontology (GO) modules, KEGG pathway modules, modules derived from genes sharing a transcription factor-binding side (TFBS) in their promoter and genes sharing microRNA target motifs in their 3′-UTR [see ref. (1) for details].
Figure 2 shows the flowchart of the analyses in IntOGen. First, within each analysis unit, we identify genes altered in more samples than expected by chance using Oncodrive [see ref. (1) for details]. The results for the same gene are combined statistically across the analyzed experiments classified with the same topography and morphology terms using the weighted z-method (9). An advantage of ICD-O is its hierarchical structure. If the study contains enough samples (at least 20) for which morphology type information is known, then detection of significant alterations can be done at the level of topography and the level of morphology. The limit of 20 samples was setup to increase the reliability of results, as we consider that smaller number of replicates in a large-scale study can lead to anomalous conclusions (1). In this way, alterations specific to certain morphology type can be identified as well as those common to the topography of the cancer in general. After significantly altered genes are detected, enrichment analysis is done to find significantly altered modules (e.g. biological processes or pathways) per experiment. In the same way as before, the results for the same module are combined across studies that analyze the same cancer type.
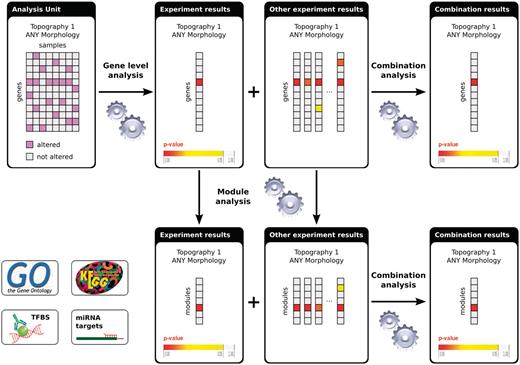
Flowchart of the analyses in IntOGen. Each analysis unit (set of assays from the same study using the same platform and annotated with the same ICD-O terms) is analysed to detect the significantly altered genes. The gene-level experiment results are analyzed further to detect significantly altered modules. The experiment results with the same ICD-O terms are combined both at the gene level and at the module level. For methods details see (1).
Data accessible from IntOGen Biomart
As can be expected, the interpretation of these highly inter-related results requires powerful visualization methods. The browser of IntOGen facilitates the exploration and intuitive visualization of results at different levels (available at: http://www.intogen.org), while the Biomart portal (2) (available at: http://biomart.intogen.org) allows complex queries and facilitates the bulk download of the all analysis results.
In IntOGen Biomart portal, users can query for three types of data. For each type, there is a database; IntOGen Experiments, IntOGen Combinations and IntOGen Oncomodules (Table 2).
Databases and data sets in the BioMart of IntOGen
| Databases | Data sets | Description |
|---|---|---|
| Experiments | Gene genomic alterations | Recurrence and significance of genomic alteration (gain and loss) for each gene at the level of experiments |
| Gene transcriptomic alterations | Recurrence and significance of transcriptomic alterations (upregulation and downregulation) for each gene at the level of experiments | |
| KEGG genomic alterations | Recurrence and significance of genomic alterations (gain and loss) for each KEGG pathway at the level of experiments | |
| KEGG transcriptomic alterations | Recurrence and significance of transcriptomic alterations (upregulation and downregulation) for each KEGG pathway at the level of experiments | |
| GO genomic alterations | Recurrence and significance of genomic alterations (gain and loss) for each GO term at the level of experiments | |
| GO transcriptomic alterations | Recurrence and significance of transcriptomic alterations (upregulation and downregulation) for each GO term at the level of experiments | |
| TFBS genomic alterations | Recurrence and significance of genomic alterations (gain and loss) for putative targets of each TF at the level of experiments | |
| TFBS transcriptomic alterations | Recurrence and significance of transcriptomic alterations (upregulation and downregulation) for putative targets of each TF at the level of experiments | |
| miRNA genomic alterations | Recurrence and significance of genomic alterations (gain and loss) for putative targets of each miRNA at the level of experiments | |
| miRNA transcriptomic alterations | Recurrence and significance of transcriptomic alterations (upregulation and downregulation) for putative targets of each miRNA at the level of experiments | |
| Combinations | Gene genomic alterations | Recurrence and significance of genomic alterations (gain and loss) for each gene at the level of combinations (tumor types and subtypes) |
| Gene transcriptomic alterations | Recurrence and significance of transcriptomic alterations (upregulation and downregulation) for each gene at the level of combinations (tumor types and subtypes) | |
| KEGG genomic alterations | Recurrence and significance of genomic alterations (gain and loss) for each KEGG pathway at the level of combinations (tumor types and subtypes) | |
| KEGG transcriptomic alterations | Recurrence and significance of transcriptomic alterations (upregulation and downregulation) for each KEGG pathway at the level of combinations (tumor types and subtypes) | |
| GO genomic alterations | Recurrence and significance of genomic alterations (gain and loss) for each GO term at the level of combinations (tumor types and subtypes) | |
| GO transcriptomic alterations | Recurrence and significance of transcriptomic alterations (upregulation and downregulation) for each GO term at the level of combinations (tumor types and subtypes) | |
| TFBS genomic alterations | Recurrence and significance of genomic alterations (gain and loss) for putative targets of each TF at the level of combinations (tumor types and subtypes) | |
| TFBS transcriptomic alterations | Recurrence and significance of transcriptomic alterations (upregulation and downregulation) for putative targets of each TF at the level of combinations (tumor types and subtypes) | |
| miRNA genomic alterations | Recurrence and significance of genomic alterations (gain and loss) for putative targets of each miRNA at the level of combinations (tumor types and subtypes) | |
| miRNA transcriptomic alterations | Recurrence and significance of transcriptomic alterations (upregulation and downregulation) for putative targets of each miRNA at the level of combinations (tumor types and subtypes) | |
| Oncomodules | Combinations | Sets of genes significantly altered in each cancer type and subtype |
| Experiments | Sets of genes significantly altered in each experiment |
In IntOGen Experiments database, there are data sets for genomic and transcriptomic alterations. Users can query the results of the recurrence analysis for these alterations at the level of genes or modules, such as KEGG pathways and GO categories, for each experiment included in IntOGen. For both types of data sets, the results can be filtered in many different ways. Here are a few examples: genes annotated with a list of GO ids, genes in a specific chromosomal band, a list of selected Entrez/Ensembl gene ids. The user can also filter by significance level and the results can be restricted to experiments done by specific authors, performed on a specific platform type, etc. The columns in the results can be determined by the selections done in attributes section. For experiment-level data, there are a number of statistics derived from the analysis that can be retrieved such as the number of samples in the experiment, the expected/observed number of alterations and P-values etc. Finally, a table that contains the selected attributes for the genes or modules is retrieved.
In IntOGen Combinations database, users can query the results for combinations, that is, the integration of results from experiments annotated with the same ICD-O terms. This database includes data sets for genomic and transcriptomic alterations for genes and modules. The filters and attributes works in a similar way as in Experiment database but without publication nor platform attributes and filters, and including the results attributes specific to the combination method.
In IntOGen Oncomodules database, there are two data sets, one for combinations and one for experiments. Each data set contains lists of genes that are significantly altered in a specific combination of ICD-O terms or in a specific experiment. Again the user can filter the results in a variety of ways, with the significance level he/she likes, according to certain characteristics of genes, for a cancer type and, in the case of oncomodules at the level of experiments, for author or platform type.
Query examples
Query #1 Use a list of genes to check whether they have been significantly gained or lost in the topology breast.
| Database | Data sets | Filters | Attributes |
|---|---|---|---|
| Database: IntOGen Combinations | Gene Genomic Alterations | Genes: ID List limit by a file with ids (Ensembl, Entrez etc.) | Genes>Ensembl> Gene Ensembl ID |
| ICD-O topography and morphology: breast; ANY morphology | Genes>Ensembl> Gene symbol | ||
| References>External references>Entrez Gene id | |||
| Results>Genomics> Gain P-value | |||
| Results>Genomics>Loss P-value |
The result of high-throughput analysis is usually a list of genes such as genes significantly deregulated in an expression experiment. As resources are limited, for downstream analysis, this gene list must be prioritized. One way to do this is to check if the individual genes are altered in any way in the panel of cancer experiments in IntOGen. In Query 1, the user can download the combined results for genomic alterations filtering them with their gene list by clicking on the ‘ID list limit’ box and specifying the type of id they use. For example, in order to filter using gene symbols such TP53 and RB1, in the filters sections, the user should check the ‘ID list limit’ box and select ‘Gene symbols’ from the drop down menu. The user can filter using a number of ids such as GO id, Refseq, etc. In the Figure 3 a screenshot of the web interface selecting the attributes for this query is shown.
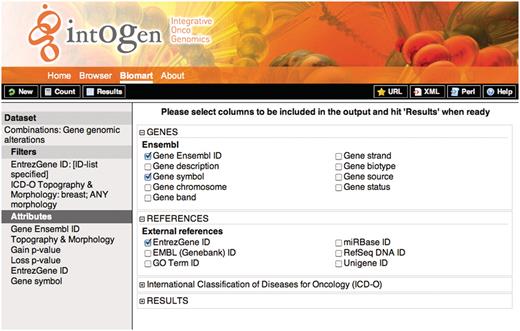
Screenshot showing the attribute selection for the query 1. On the left, the selected dataset, filters and attributes are shown. On the right the detailed attributes selection view. To retrieve the results the user should click on the ‘Results’ button on the upper-left black bar, the ‘Count’ button gives the number of rows that match the query and the ‘New’ button allows to start a new query.
Query #2–3 Find the genes gained in lung cancer. Check the transcriptomic alteration status of the genes gained in lung cancer.
Query 2
| Database | Data sets | Filters | Attributes |
|---|---|---|---|
| IntOGen Oncomodules | Combinations: Oncomodules | Type of alteration: Gain | Genes>Ensembl> Gene Ensembl ID |
| ICD-O Topography and Morphology: lung; ANY morphology |
| Database | Data sets | Filters | Attributes |
|---|---|---|---|
| IntOGen Oncomodules | Combinations: Oncomodules | Type of alteration: Gain | Genes>Ensembl> Gene Ensembl ID |
| ICD-O Topography and Morphology: lung; ANY morphology |
| Database | Data sets | Filters | Attributes |
|---|---|---|---|
| IntOGen Oncomodules | Combinations: Oncomodules | Type of alteration: Gain | Genes>Ensembl> Gene Ensembl ID |
| ICD-O Topography and Morphology: lung; ANY morphology |
| Database | Data sets | Filters | Attributes |
|---|---|---|---|
| IntOGen Oncomodules | Combinations: Oncomodules | Type of alteration: Gain | Genes>Ensembl> Gene Ensembl ID |
| ICD-O Topography and Morphology: lung; ANY morphology |
Query 3
| Database | Data sets | Filters | Attributes |
|---|---|---|---|
| IntOGen Combinations | Gene transcriptomic alterations | Genes: ID List from the previous query | Genes>Ensembl> Gene Ensembl ID |
| ICD-O topography and morphology: lung; ANY morphology | Genes>Ensembl> Gene symbol | ||
| Results > Transcriptomic > Upregulation P-value | |||
| Results > Transcriptomic > Downregulation P-value |
There are different types of alterations taking place in cancer. It is important to cross-check the relative contributions of different alteration types. With Query 2, the user will get a list of Ensembl genes gained in ‘lung, nos; any morphology’ experiments. The user can also retrieve the identifier he/she chooses such as gene symbols, EntrezGene id, etc by changing the attributes for genes. With Query 3, the user can use the list from the previous query, to filter the results for transcriptomic alterations.
Query #4 Compare the genomic alterations in brain cancer in general and two specific morphology types; ependymoma and astrocytoma.
| Database | Data sets | Filters | Attributes |
|---|---|---|---|
| IntOGen Combinations | Gene genomic alterations | ICD-O topography and morphology: brain; ANY morphology | Genes>Ensembl> Gene Ensembl ID |
| ICD-O topography and morphology: brain; astrocytoma, nos | Genes>Ensembl> Gene symbol | ||
| ICD-O topography and morphology: brain; epedymoma, nos | Results>Genomics> Gain P-value | ||
| Results>Genomics> Loss P-value |
Since the dissection of brain cancer into intrinsic subtypes has prognostic value, it has been the interest of experimental scientist to find gene list that can distinguish cancer subtypes. With Query 4, the user can download the genomic alterations in brain cancer and those for specific mophologies, epedymoma and astrocytoma. In the filters section ICD-O, multiple ICD-O terms can be selected by clicking while keeping the control key down for Windows machines and the command key down in Mac machines.
Query #5 Compare the expression level of the genes annotated with GO cell cycle term in different breast cancer experiments. Take the results from the experiment with the greatest number of samples.
Query 5
| Database | Data sets | Filters | Attributes |
|---|---|---|---|
| IntOGen Experiments | Gene transcriptomic alterations | ICD-O topography and morphology: breast; ANY morphology | Genes>Ensembl> Gene Ensembl ID |
| Filters: ID List limit by GO id: GO:0007049 | Genes>Ensembl> Gene symbol | ||
| Results> Transcriptomic> Upregulation, P-value | |||
| Results> Transcriptomic> Downregulation, P-value | |||
| Results> Transcriptomic> Upregulation: total number of samples |
While enrichment with modules is informative, the user can also get the results for the genes in a module. By comparing the two results, it is possible to see which genes from the pathway are more likely to determine the activity of the pathway in different experiments of the same cancer type. With Query 5, the user can filter the results from all breast studies for the genes with cell cycle annotation and compare the studies. To filter the results for gene with a specific GO id, in the filters section, activate ‘ID list limit’ box and select ‘GO term ID’ as the type of identifier.
Query #6 Compare the pathways up or downregulated in different prostate cancer experiments.
Query 6:
| Database | Data sets | Filters | Attributes |
|---|---|---|---|
| IntOGen Experiments | KEGG pathway transcriptomic alterations | ICD-O topography and morphology: prostate gland; ANY morphology | KEGG pathway id |
| KEGG name | |||
| Results> Transcriptomic> Upregulation P-value | |||
| Results> Transcriptomic> Downregulation P-value |
While cancers from different patients show extensive heterogeneity in terms of the specific genes altered, the set of biological processes/pathway affected by these alterations are similar. Enrichment analysis of sets of genes with a specific biological property is very useful to detect such patterns. With Query 6, the user can retrieve the results for the pathways from KEGG for different experiments that study breast cancer.
Query #7a Retrieve a table that lists the analysis units for transcriptomic alterations in IntOGen.
Query 7a
| Database | Data sets | Filters | Attributes |
|---|---|---|---|
| IntOGen Experiments | KEGG pathway transcriptomic alterations | None selected | ICD-O: Topography and morphology |
| EXPERIMENT: publication authors, publication year, PubMed id, publication title, experiment id | |||
| PLATFORM: platform title |
Query #7b Retrieve a table that lists the analysis units for genomics alterations in IntOGen.
Query 7b
| Database | Data sets | Filters | Attributes |
|---|---|---|---|
| IntOGen Experiments | KEGG pathway genomic alterations | None selected | ICD-O: Topography and morphology |
| EXPERIMENT: publication authors, publication year, PubMed id, publication title, experiment id | |||
| PLATFORM: platform title |
In order to retrieve the list of analysis units in IntOGen, the user has to perform two queries, one for transcriptomic alterations and the other for genomic alterations. This is because the corresponding data is in different data sets. It is important to select appropriate attributes to describe the analysis units, use no filters and retrieve the unique results only (click on ‘Unique results only’).
Discussion and future directions
IntOGen is a cancer analysis tool designed to facilitate the integration, analysis, exploration and interpretation of oncogenomic data. In addition to its browser, its BioMart interface provides access to high-throughput data related to genomic and transcriptomic alterations taking place in different types of cancers. A unique feature of IntOGen is that it provides analysis at different levels of integration. The user can compare the results for individual experiments to those obtained by merging the experiments studying the same cancer type. Both types of data are accessible through the BioMart interface. A major feature of the BioMart interface is that it facilitates bulk download of the data. We will continue adding new data from public databases as well as cancer projects such as TCGA (5) and ICGC (10).
Another advantage of using IntOGen is that the data downloaded can directly be analyzed in Gitools (11) (http://www.gitools.org), which is a stand-alone tool designed for the analysis and visualization of high-throughput data. Gitools can also be used to download data from other available BioMart portals. For example, one can easily perform enrichment analyses on IntOGen data with modules or gene sets from various Biomart portals to explore large-scale patterns in cancer genomics data (see http://help.gitools.org/xwiki/bin/view/Tutorials/ for examples).
With cheaper and faster sequencing technologies being available continuously, a deluge of cancer genomics data is expected in the coming years. Resources like IntOGen that allow the integration, visualization and interpretation of large amount of oncogenomics data will gain importance. We continuously work on improvements and updates on the system to be able to incorporate the data obtained using sequencing technologies. With more high-quality data and new analysis methods incorporated into IntOGen, we expect it to become an essential resource for experimental researchers.
Funding
Spanish Ministry of Science and Technology (SAF2009-06954); AGAUR fellowship of the Catalonian Government (to G.G.). Funding for open access charge: Spanish Ministry of Science and Technology (SAF2009-06954).
References
Author notes
†These authors contributed equally to this work.
