


Abstract
The vast majority of genes in humans and other organisms undergo alternative splicing, yet the biological function of splice variants is still very poorly understood in large part because of the lack of simple tools that can map the expression profiles and patterns of these variants with high sensitivity. High-throughput quantitative real-time polymerase chain reaction (qPCR) is an ideal technique to accurately quantify nucleic acid sequences including splice variants. However, currently available primer design programs do not distinguish between splice variants and also differ substantially in overall quality, functionality or throughput mode. Here, we present GETPrime, a primer database supported by a novel platform that uniquely combines and automates several features critical for optimal qPCR primer design. These include the consideration of all gene splice variants to enable either gene-specific (covering the majority of splice variants) or transcript-specific (covering one splice variant) expression profiling, primer specificity validation, automated best primer pair selection according to strict criteria and graphical visualization of the latter primer pairs within their genomic context. GETPrime primers have been extensively validated experimentally, demonstrating high transcript specificity in complex samples. Thus, the free-access, user-friendly GETPrime database allows fast primer retrieval and visualization for genes or groups of genes of most common model organisms, and is available at http://updepla1srv1.epfl.ch/getprime/.
Database URL:http://deplanckelab.epfl.ch.
Background
Large-scale genomic approaches have demonstrated extensive alternative splicing in humans and other model organisms (1, 2), and current gene models are continuously updated to include additional splicing events (3). The regulatory mechanisms underlying alternative splicing, as well as the biological significance and function of individual gene splice variants are, however, still very poorly understood (4). This is in large part due to the fact that simple tools allowing the analysis and quantification of individual splice variants with high sensitivity are lacking. High-throughput quantitative real-time polymerase chain reaction (qPCR) is an ideal technique to accurately quantify nucleic acid sequences including splice variants. In addition, it complements gene expression analyses done by microarray or deep sequencing because the latter analysis methods are still less efficient in terms of overall cost and computational expertise required than qPCR for the quantitative detection of gene transcripts, especially those that are lowly expressed such as many transcription factor (TF) genes (5, 6). The choice of suitable primer sets is thereby critical to obtain optimal qPCR results. An ideal qPCR primer design program should at least include the following features: first, given the above mentioned increasing interest in understanding the role of individual gene splice variants (1, 7, 8), the program needs to take into account all annotated splice variants of each gene to enable either gene- (covering the majority of splice variants) or transcript-specific (covering one splice variant) expression profiling; second, at least one primer needs to span exons to avoid amplification of contaminating genomic DNA; third, the specificity of each primer needs to be automatically evaluated by similarity search; fourth, no cumbersome post-processing should be required to retrieve the best primer combination and fifth, the location of primers pairs within their genomic context should be visualized for easy, final evaluation by the end user.
In search of qPCR primer design software for a large-scale TF gene expression profiling experiment, we considered several software packages but none of them fulfilled the stipulated requirements as these programs all varied in quality, functionality or throughput mode (Table 1). The most popular interface, based on Primer3 (9), named Primer3Plus (10), allows the user to define a variety of possible parameters and options for designing oligonucleotide primers. However, the use of this program is time-consuming because users have to manually process the large number of proposed primers when, for example, verifying primer specificity by BLAST (11). Another program, RASE (12) generates qPCR primers for the detection and quantitation of specific splicing isoforms, but does not enable the design of gene-specific primers. In addition, its associated web interface only supports low-throughput experiments. Other programs such as PerlPrimer (13), QuantPrime (14), and BatchPrimer3 (15) do allow batch primer input, and some databases of qPCR primers including Quantitative PCR Primer Database (16), RTPrimerDB (17), PrimerBank (18) and qPrimerDepot (19) were developed for high-throughput primer design or retrieval. But again, none of these packages combines and automates all of the important features required to address the increasing demands in qPCR primer design for high-throughput qPCR experiments, especially the requirement to target genes in gene- or transcript-specific fashion without post-processing (Table 1).
Comparison between previously established qPCR primer design programs and GETPrime
| qPCR primer design | Transcript/ sequence specific | Gene- specific (cover the majority of or, if possible, all transcripts) | Spanning exons to avoid amplification of contaminating DNA | Automated validation of primer specificity | No post- processing to select best primers | Graphical view of the location within the genome | Experimental primer validation | Interface for high- throughput experiments | Fast processing |
|---|---|---|---|---|---|---|---|---|---|
| Primer3Plus (10) | √ | x | x | x | x | x | x | x | √ |
| Autoprime (36) | √ | x | √ | x | x | x | √ | x | √ |
| PerlPrimer (13) | √ | x | √ | x | x | x | √ | x | √ |
| Primer Express | √ | x | x | x | x | x | √ | x | √ |
| BatchPrimer3 (15) | √ | x | x | x | x | x | √ | √ | √ |
| RASE (12) | √ | x | √ | √ | x | x | √ | x | √+/− |
| Primique (37) | √ | x | √+/− | √ | x | x | √ | √+/− | √+/− |
| QuantPrime (14) | √ | √+/− | √ | √ | √ | x | √ | √ | √+/− |
| Databases [RTPrimerDB (17), PrimerBank (27), qPrimerDepot (19)] | √ | x | √ | √ | √+/− | x | √ | x | √+ |
| GETPrimedb | √ | √ | √ | √ | √ | √ | √ | √ | √+ |
To fill this current void, we developed our own qPCR primer design software, GETPrime. This program was designed to generate primers targeting every gene available in the latest Ensembl release, which is used as a reference resource (20). However, to allow fast primer retrieval, we have linked our program to GETPrimedb, a database enabling fast retrieval via a user-friendly interface of gene- or transcript-specific primers for all Homo sapiens, Mus musculus, Caenorhabditis elegans, Drosophila melanogaster and Danio rerio genes in assembled chromosomes annotated in the Ensembl database.
Database construction and development
Primer generation
GETPrime combines several existing tools: the PerlPrimer program (13), Blast (11) and the Ensembl database through a custom perl wrapper, which enables automation of the workflow and decision process for selecting the best primer pairs (see workflow, Figure 1).
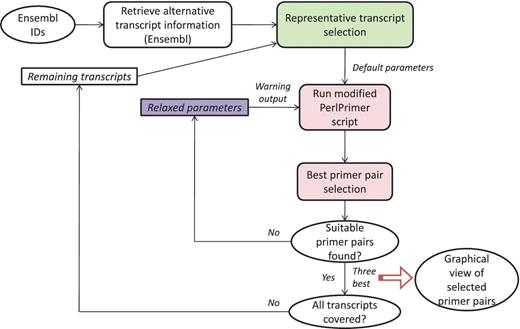
The first step in the GETPrime pipeline is the selection of a transcript, as an input, from the Ensembl database for each target gene of interest. For comprehensiveness, we included all genes featuring a ‘known’ or ‘novel’ status in the Biomart portal in the GETPrime database (21). Each gene-specific transcript is then selected based on two independent criteria: (i) its status must be annotated as ‘KNOWN’ because we opted not to include ‘novel’ transcripts in our database as these are not yet validated by species-specific sequencing data (Bert Overduin from Ensembl Project, Personal communication) and (ii) the highest junction score (Figure 2). In the first round, this score allows the selection of a transcript that contains conserved exon junctions within the alternative splice variants. If the same highest score is obtained by several transcripts, then the transcript with the shortest sequence is selected. Next, this first selected transcript is provided as an input to our modified PerlPrimer program. This program supports primer design for one specific transcript at exon junctions to avoid unspecific amplification due to DNA contamination. Using a graphical user interface, PerlPrimer runs Spidey (22) to detect intron/exon boundaries, and searches all possible primer pairs on the input transcript. To enable the generation of primers for a large number of genes, we modified PerlPrimer to use the exon junction coordinates supplied by Ensembl. In addition, in contrast to PerlPrimer, that frequently generates tens of candidate primer pairs without quality scores, GETPrime runs an extensive workflow to select the three best primer pair candidates based on stringent parameters (Table 2) and well-defined criteria which allow primer pair ranking (Figures 1 and 3).
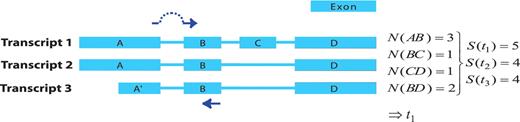
Visualization of the junction score algorithm concept for gene- or transcript-specific primer design. A schematic representation of a gene with three alternative transcripts is depicted. The blue boxes represent exons, the lines represent introns. Each transcript contains a subset of exons A–D and A′. The junction score (N) constitutes the number of transcripts containing the respective splice junction. To design gene-specific primers, the sum of the junction scores, represented by S, is calculated for each transcript and the transcript with the highest S-value that contains the junction with the highest N-score is selected (here t1). Then, the gene-specific primers are preferentially designed so that one of the primers spans the exon junction with the highest N-score within the selected transcript (t1), as indicated by the dark blue arrows.
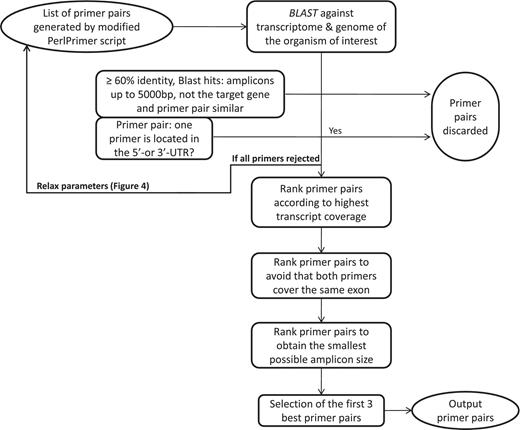
Workflow to select the best primer pairs. The selection of the best primer pairs is automated according to these hierarchical criteria. First, each primer pair is blasted and potentially discarded as described in the Figure and in the main text. Then, with the remaining primer pairs, pairs are discarded if at least one primer spans the 5′- or 3′-UTR. After these two stringent filtering steps, the remaining primers are ranked according to (i) highest transcript coverage, (ii) whether the primers are located within the same exon (not desirable) or not (desirable) and (iii) smallest amplicon size which has shown to be more optimal for qPCR efficiency and experimental variation (35).
Comparison between default and relaxed primer design parameters
| qPCR primer quality criteria | Default parameters | Relaxed parameters |
|---|---|---|
| Primer length | 19–25 bp | 19–25 bp |
| Amplicon length | 80–200 bp | 60–300 bp |
| Melting temperature (Tm) | 57–60°C | 57–60°C |
| ΔTm = 1°C | ΔTm = 2°C | |
| Exclude %GC | 40–60% only considered | 40–60% only considered |
| GC clamp | Two of the three 3′-bases of each primer must be a G or a C | Two of the three 3′-bases of each primer must be a G or a C |
| Exon/exon junction primers | At least 7 bp at the 5′-end and 3 bp at the 3′-end | At least 7 bp at the 5′-end and 3 bp at the 3′-end |
The melting temperature (Tm) is calculated in the PerlPrimer program (13) which uses J. SantaLucia's extensive nearest-neighbor thermodynamic parameters (38, 39) and the default salt conditions (1.5 mM Mg2+, 200 mM oligos, 0.2 mM dNTPs and 50 mM monovalent cations). Bolded text highlights the differences between the default and relaxed primer design parameters. G = guanine;C = cytosine.
The first important criterion (Figure 3) is primer specificity, which is assessed using BLASTN against the entire genomic DNA and cDNA from all predicted transcripts. To ensure primer specificity in BLAST, we cancelled the default filter, as this allows the detection of spurious alignments even outside biologically relevant genomic regions. This is also the reason why we implemented a low stringency E-value of 100, which assures that all possible alignments with primer sequences are detected. If both primers match with at least 60% sequence identity, a DNA or cDNA region spanning at most 5000 bp and the region does not correspond to the position of the targeted transcript itself, then the primer pair is discarded because it may wrongly target another gene or a pseudogene. The primer pairs that are similar (at least 50% overlap for both primers) to the one just discarded, usually shifted by 1 to 2 bases, are also discarded to avoid running too many BLAST searches. The BLAST criterion is especially important to specifically monitor the expression of protein-coding genes from the same family such as, for example, homeodomain TFs. The second criterion is to discard primer pairs that span the 5′- or 3′-untranslated regions (UTRs). Transcript quantification based on primers targeting these regions can be biased as 3′-UTRs contain multiple polyadenylated regions and 5′-UTRs are frequently absent or truncated if cDNAs are synthesized with an oligo(dT) primer. Other ranking criteria are the number of gene-specific transcripts that are covered (as reflected by the value of N shown in Figure 2), the size of the amplicon and whether the primer pair falls within the same exon.
If, at the end of the ranking pipeline, no primer pair has passed the selection, then certain parameters are relaxed until a satisfactory primer pair is obtained. Parameter relaxation is performed within the modified PerlPrimer script and within the best primer pair selection workflow (Figure 4). In the modified PerlPrimer script, the first parameters that are relaxed are the amplicon length and the melting temperature difference (Table 2), followed by the exon/exon junction criteria (allowing <7 bp at the 5′-end and/or <3 bp at the 3′-end) and the requirement to span different exons. In the best primer pair selection workflow, parameters that can be relaxed are the extent of primer specificity and the location of primers in the UTR regions, which sometimes constitute the only sites which enable the distinction of two or more transcripts. Primers that are generated under these relaxed conditions are tagged, and the user is informed on which parameters were changed to obtain primers. Genes for which no primers could be found, even after parameter relaxation, are labeled with the statement ‘no primers’.
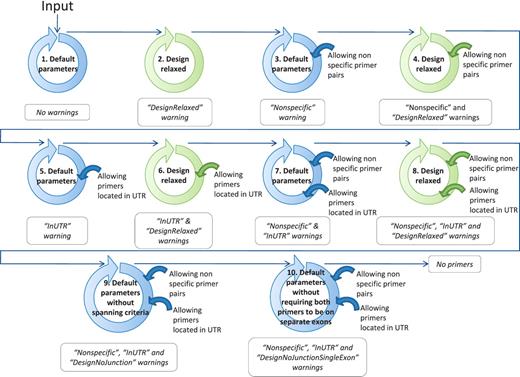
Workflow to find at least one suitable primer pair by relaxing the primer design parameters. The circles schematize the run of the modified PerlPrimer script and the workflow of the best primer selection indicated in Figure 1. The relaxation of the parameters within the modified PerlPrimer script and the allowed options in the selection of the best primer pairs are depicted in the center and on the right of the circles, respectively. Blue and green circles represent the default parameters and the relaxed design parameters, respectively (Table 2). The arrows symbolize the logical flow. If no primers are found with either set of parameters, the program reports ‘No primers’.
The three top-ranking primer pairs are saved in the output file along with a list of transcripts covered by the primer pair, the sequences of forward and reverse primers, the primer melting temperatures, the start and end primer positions, the Ensembl status of the gene (‘known’ or ‘novel’), indication of whether parameters were relaxed to obtain the primer pair, and a link to the graphical view. Finally, potential transcripts not covered by the top ranking primer pair are reanalyzed to design additional primer pairs covering the transcripts from the remaining set. This process is repeated until all predicted transcripts are covered by at least one primer pair. The results of this computational exercise for all annotated genes of the selected genomes are stored in a General Feature Format (GFF) file and saved in a MySQL database.
Furthermore, our pipeline has been extended for transcript-specific expression profiling by changing the workflow to select the best primer pairs. Instead of ranking primer pairs according to the highest transcript coverage, the ranking is done according to the smallest transcript coverage. The average number of genes in Ensembl release 61 covered by the best ranked gene- or transcript-specific primer pairs for each model organism is listed in Table 3. For example, 98% of the known Mouse Ensembl genes are covered by a gene- and transcript-specific primer pair. Of them, 50% have no associated warning and 2% have been obtained by relaxing primer parameters [amplicon length and deviation in the melting temperature (Table 2)] without any other type of warning. The overall computing time depended on the number of genes processed and varied per model organism, taking between two days (D. melanogaster) and two weeks (H. sapiens) on our server [Linux system (kernel 2.6.18) with 48 x Intel Xeon 2.67 GHz quad CPU with 74GB RAM memory].
Average number of genes covered by the best ranked primer pair for each species
| Species | Number of KNOWN protein- coding genes (Ensembl v61) | Genes covered by a primer pair, n (%) | Primer pairs without warnings | Primer pairs design relaxed without other warnings | Primer pairs in UTR without other warnings | Primer pairs with spanning criteria relaxed without other warnings | Primer pairs with both primers on separate exons without other warnings | Primer pairs non-specific without other warnings | Primer pairs with other warnings |
|---|---|---|---|---|---|---|---|---|---|
| Homo sapiens | 34 960 | 34 093 (97.5) | 14 521 | 643 | 967 | 2695 | 8997 | 3119 | 3151 |
| Mus musculus | 29 445 | 28 840 (97.9) | 14 425 | 600 | 967 | 1832 | 6052 | 2207 | 2757 |
| Caenorhabditis elegans | 38 237 | 21 964 (57.4) | 17 510 | 403 | 161 | 1528 | 833 | 736 | 793 |
| Drosophila melanogaster | 14 869 | 14 368 (96.6) | 8493 | 301 | 427 | 1241 | 2359 | 376 | 1171 |
| Danio rerio | 24 370 | 24 203 (99.3) | 18 091 | 487 | 499 | 899 | 1261 | 2174 | 792 |
We calculated the average number of gene- or transcript-specific primer pairs with their principal stringencies.
Database access
Google Web Toolkit was used to generate the web interface and to display the MySQL query results directly in the browser. The interface to retrieve primer pairs accepts gene symbols, also defined as ‘associated gene names’ by the BioMart portal (21), and Ensembl gene or transcript IDs. A choice is available to either find primers covering most of the transcripts of a gene (for maximum coverage with a minimal number of specific primers) or, if possible, to have individual primer pairs specific for each single transcript for detailed quantification of splice variants. The interface contains different filtering possibilities to obtain the desired primer output. For example, one can select only primers without warnings, or decide to include primers with specific warnings that are tolerated by the individual user (e.g. ‘inUTR’). A typical query example featuring visual cues at each processing step has been added to the interface to assist users. The final output of the GETPrime interface is an Excel file containing primer sequences and parameter properties, as well as hyperlinks directing the user to an in-house browser, based on JBrowse (23), showing the alternative transcripts and primer positions (Figure 5). The current GETPrime database is based on the Ensembl release 61. A previous version of GETPrime based on Ensembl release 50 is still accessible to the user on the same web interface. The only differences between the two versions are that, in the current version, novel genes are included and that hyperlinks for each primer pair are supported by distinct browser types.
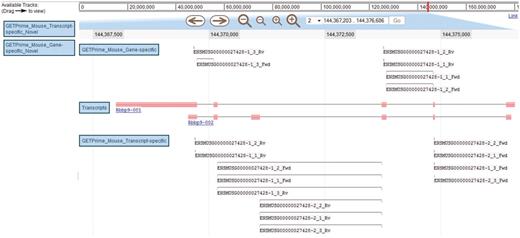
JBrowse-based graphical view of GETPrime primer pairs targeting the Rbbp9 mouse gene. The blue boxes on the left are the available tracks that can be dragged in the JBrowse genome view (23). In this example, the transcripts, the gene-specific primers (covering the majority of splice variants if possible) and the transcript-specific primers (covering a single splice variant, when possible) have been dragged into the browser. The upper part of the figure shows tools to zoom, to move to up- or downstream of the genome location, and to enter another chromosome, another position on the chromosome or also an Ensembl ID. Each primer is annotated by its Ensembl ID, its iteration in GETPrime (e.g. −1), its ranking (e.g. _3) and its primer type (forward and reverse primers are abbreviated Fwd and Rv, respectively). The blue box for each primer represents the respective alignment to the transcripts and sometimes a thin line between two blue boxes is used to bridge an intron region for primers spanning two exons. The primer pairs in the gene-specific track cover both transcripts. The primer pairs from the first iteration (‘−1’) and the second iteration (‘−2’) in the transcript-specific track are specific to the largest transcript Rbbp9-001 and the shortest transcript Rbbp9-002, respectively.
Database validation and application
The sensitivity and specificity of the primers generated by GETPrime were validated experimentally. First, as a control experiment, we selected three commonly used, and thus, already published primer pairs, each targeting one of the following control genes: Hprt1, Igfbp4, Tubb2c (see Supplementary Table S1 for sequences). Only primer pairs covering exactly the same transcripts as the one generated by GETPrime were selected. Similar to the well-established primer pairs, all three GETPrime primer pairs were of high quality showing high specificity based on melting curve and gel separation analyses as well as good amplification efficiency on cDNA synthesized from a qPCR Mouse Reference total RNA (a mean efficiency of 103% with an R2-value of 0.997, see ‘Materials and Methods’ section). In addition, the amount of PCR product generated by each primer pair in pre-adipocyte 3T3-L1 cells pre- and post-differentiation induction (‘Materials and Methods’ section, D0, D2 and D4) was comparable (ΔCq < 1).
Next, we evaluated the quality of GETPrime primers by targeting 60 TFs in cDNA samples synthesized from the same mouse reference total RNA (‘Materials and Methods’ section). We chose TFs as they are typically expressed at lower levels than non-TF-coding genes and are therefore in general more difficult to detect (24, 25), thus rendering this validation assay more stringent than when a number of genes is targeted coding for a diverse set of proteins. In total, 45 out of the 60 tested primer pairs were of high quality as evidenced by their high amplification efficiency (a mean efficiency of 98.94% with an R2-value of 0.994) and by their high specificity based on their corresponding dissociation curves. Of the remaining 15 primer pairs, one was found to form primer dimers indicated by the presence of a clear melting curve peak in the no template and the no reverse transcriptase negative controls, and 14 only yielded a low signal likely due to the fact that the corresponding target genes were only lowly abundant both in the Reference RNA as well as the 3T3-L1 RNA samples (26) (‘Materials and Methods’ section). However, we were able to generate a standard curve for five out of the 14 primer pairs because the corresponding TF open reading frame (ORF) clones are available in our laboratory. These primer pairs yielded an amplification efficiency mean of 98.4% with a mean R2-value of 0.995. Thus, 50 out of 51 primer pairs that we were able to test, satisfy the qPCR reliability criteria, demonstrating that the vast majority of primers in the GETPrime database are of high quality.
To further evaluate primer specificity, we designed a stringent assay with GETPrime primers which target one TF ORF within a library of TF ORF clones producing homologous proteins, here, either homeodomain- or ZF-C2H2 TFs (‘Materials and Methods’ section and Supplementary Table S2). For each of the selected TF targets, we obtained a clear qPCR amplification signal in contrast to when the same TF ORF library was used as qPCR template but without containing the respective target TF ORF (Supplementary Figure S1), indicating that the respective primer pair is highly target-specific. Finally, to evaluate the ability of GETPrime to differentiate between gene-specific transcripts, we used 3T3-L1 cells pre- and post-differentiation induction and chose one relatively straight-forward splicing scenario featuring one gene, Ubtf, that, according to Ensembl release 50, has two distinct transcript forms Ubtf_a and Ubtf_b, each representing respectively five and two different splice forms (Figure 6A). GETPrime primers were able to differentiate both Ubtf splice forms at the two selected differentiation time points and did so in quantitative fashion in that the sum of the individual transcript amounts matched the overall gene expression amount (Figure 6B).
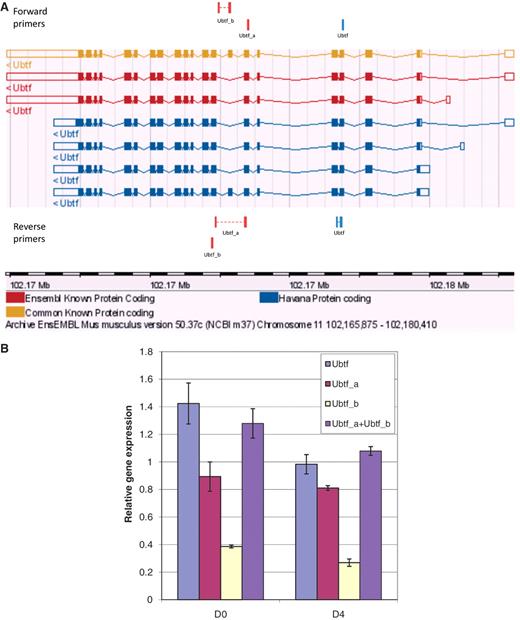
Graphical view and qPCR results to validate Ubtf-targeting primers covering either all or a subset of Ubtf transcripts. (A) The ‘Ubtf’ primer pair in blue covers all seven transcripts (gene-specific primers) and the red ‘Ubtf_a’ and ‘Ubtf_b’ primer pairs cover five and two transcripts, respectively (transcript-specific primers). In this example, GETPrime could not find primers differentiating each transcript. (B) The relative gene expression levels before differentiation (D0) and four days after (D4) were normalized to Hprt1 and Tubb2c expression levels. ‘Ubtf’ represents the primer pair covering all seven transcripts, whereas, ‘Ubtf_a’ and ‘Ubtf_b’ are primer pairs specific to a subset of five and two transcripts, respectively. ‘Ubtf_a+Ubtf_b’ represents the sum of relative gene expression of ‘Ubtf_a’ and ‘Ubtf_b’. The data indicate that GETPrime can effectively differentiate distinct transcripts, as the sum of the individual transcript amounts matched the overall gene expression amount.
Discussion
The experimental results demonstrate the power of GETPrime to produce gene- or transcript-specific qPCR primers. The results also show that the generated primers are of high quality and that these primers are able to detect low-abundant transcripts such as those coding for TFs. Moreover, they demonstrate their capacity to specifically recognize targets within a pool of templates coding for highly homologous proteins, as well as their high amplification efficiency. Thus, given the fact that there are, to our knowledge, no other software and web tools that offer the same set of attributes as the GETPrime platform (Table 1), we believe that GETPrime constitutes an important advance of the qPCR primer design field. One other recently developed qPCR primer design software QuantPrime (14) also features gene-specific primer design (i.e. covering the majority of splice variants) as an option. However, this software offers no straight-forward way to identify which transcripts are covered by the gene-specific primers. The user is therefore obliged to blast each primer in the Ensembl database to find this information, which is time-consuming, especially if a large set of genes need to be targeted. In addition, it is often impossible to generate primers that cover all gene transcripts. For these genes, multiple primer pairs need to be used to yield a gene-specific read-out. In contrast to QuantPrime, the GETPrime database provides all this information in easy-to-retrieve and graphical fashion. Thus, while it is clear that QuantPrime is a powerful primer design program, given its great parameter flexibility for large-scale qPCR primer design and user-friendly interface, it appears not to have been designed with the a priori aim of yielding gene- or transcript-specific primers. Moreover, we found that QuantPrime processing time significantly increases with increasing gene length and number. GETPrime does not suffer from this drawback as its database interface allows direct primer retrieval. This is similar to other Primer databases, like qPrimerDepot (19), PrimerBank (27) and RTPrimerDB (17), which also provide pre-computed qPCR primers. The limitations of these databases, though, are that they do not accommodate primer retrieval in batches and that they list multiple primer pairs per gene. It is then up to the individual user to evaluate each primer pair for experimental suitability, which is cumbersome, in contrast to GETPrime, which ranks all primers according to well-defined criteria. An important GETPrime drawback is that it is so far available only for five commonly used model organisms including humans. However, demands to design primers for other organisms of interest can be accommodated or can even be performed by the end user via adjustment of the GETPrime Perl script, which is available upon request. Thus, the GETPrime database currently includes primers for H. sapiens, M. musculus, C. elegans, D. melanogaster and D. rerio genes in assembled chromosomes annotated in the Ensembl database release 50 and 61. We thereby plan to update GETPrime as soon as major new Ensembl releases are available.
Materials and Methods
Cell culture
3T3-L1 mouse fibroblast cells (28) were cultured in DMEM supplemented with 10% fetal bovine serum, with l-glutamine 2 mM and penicillin/streptomycin (1×) in a 5% CO2 humidified atmosphere at 37°C and maintained <80% confluence before passaging. Differentiation of 3T3-L1 cells was induced by exposing two-day post-confluent cells [designated as Day 0 (D0)] to DMEM containing 10% FCS (Bioconcept, Allschwil, Switzerland) supplemented with 1 µM dexamethasone, 0.5 mM 3-isobutyl-1-methylxanthine and 1 µg/ml insulin (Sigma, St Louis, USA). At D2, cells were fed with DMEM containing FCS and 1 µg/ml insulin and two days later (D4), the media was changed to 10% FBS/DMEM. Full differentiation is usually achieved by Days 6–8. The D0, D2 and D4 samples have been used for RNA extraction, cDNA preparation and qPCR.
RNA extraction and cDNA synthesis
We have used two different experimental samples. First, to analyze the quality of the primers, we used Agilent's qPCR Mouse Reference total RNA (Agilent technologies, Santa Clara, USA). For the other reported experiments, we used total cellular RNA isolated from 3T3-L1 cells using the RNeasy Plus Mini Kit (Qiagen) according to the manufacturers’ instructions without DNAse treatment. After extraction, RNA was quantified using a NanoDrop Spectrophotometer 1000 v3.2.0 (NanoDrop Technologies, Detroit, USA). The RNA quality was further determined using a nanodrop (1.8 ≤ A260/A280 ≤ 2.2) and by visual inspection of separated bands on agarose gels. A quantity of 1 μg of RNA was used for the reverse transcription performed with random primers (Invitrogen) and Superscript III First Strand synthesis Supermix (Invitrogen, Carlsbad, USA) in a total volume of 20 µl according to supplier's recommendations. The cDNA samples were stored at −20°C.
qPCR
qPCR was performed in 96- (manual) and 384-well plates (robotic) with three technical replicates on the ABI-7900HT Real-Time PCR System (Applied Biosystems, Foster City, USA) using Power SYBR Green Master Mix (Applied Biosystems, Foster City, USA) using standard procedures. Briefly, the standard protocol from Applied Biosystem was used (50°C for 2 min and 95°C for 10 min; then 40 cycles of 95°C for 15 s and 60°C for 1 min) and finalized by a dissociation step (95°C for 15 s, 60°C for 15 s and a ramp rate of 2% to 95°C). The amount of DNA, primer and Power SYBR Green Master Mix are indicated in the Supplementary Table S1.
qPCR amplification efficiencies were calculated using the qPCR instrument software and were based on the linear regression of five serially diluted samples (a 4-fold dilution series). The slope of the standard curve gives the amplification efficiency by the formula E = 10(−1/slope). If the amplification is 100% efficient (percentage expressed by: E − 1), then the amount of PCR product should be doubled per cycle, resulting in an E-value of 2. Primers were considered reliable if they featured efficiency values between 92% and 108 % with a correlation coefficient, R2 (i.e. how well the standard curve regression line fits the data), >0.99. Primers were specific in targeting the gene or transcript of interest if qPCR melting curve analysis yielded a single sharp dissociation peak. In rare cases, a specific amplification reaction showed a so-called ‘shoulder peak’ (29) which occurs within amplicons containing multiple melting domains with varying Guanine-Cytosine (GC) contents. When additional peaks (off-target or primer–dimers) or shoulder peaks were found in the melting curve, the specificity of qPCR products was also assessed by gel separation. A no template (to detect primer dimer formation) and no reverse transcriptase (to exclude DNA amplification) negative controls were also included in the presented qPCR assays.
In the standard curve analysis, genes having Cq-values in at least three dilution series >33 were considered as lowly expressed and were excluded from the analysis of calculating the average amplification efficiency. When an ORF clone was available for one of these genes, the primer quality assessment was done on five aliquots of a 4-fold dilution series of the clone of interest (starting amount ∼1 pg).
Expression in 3T3-L1 was quantified using the ΔΔCt-method and the data were normalized to Hprt1 and Tubb2c expression. The expression of both these genes remains the most stable during 3T3-L1 cell differentiation within a set of six tested candidate reference genes (Actb, Hprt1, Igfbp4, Knab1, Tubb2c, GusB), as found by the normalization in geNorm software (30).
In our experiments, primers were retrieved from the GETPrime database based on Ensembl release 50 with the most stringent parameters if available, or with the slightly less stringent design method ‘DesignRelaxed’ (Figure 4 and sequences in Supplementary Table S1). Analysis of the standard curve, dissociation curve and results were done directly by using the software SDS 2.4 from Applied Biosystems. To allow qPCR data exchange, RDML files (31) were generated by using qbasePLUS software [http://www.biogazelle.com, (32)] and are available in the Supplementary Data.
Testing of primer specificity within a family
To validate primer specificity, we first generated two libraries containing 80 and 55 ORF clones encoding TFs belonging to, respectively, the homeodomain and ZF-C2H2 protein families (Supplementary Table S2). TFs from each family were selected based on their phylogenetic relatedness as reported in Refs (33) and (34), thus to make primer selection as difficult as possible. Next, we evaluated whether we could specifically target, respectively, seven (Dlx4, Hoxd10, Hoxc10, Pitx2, Barx1, Irx6, Hoxb6) and six randomly selected TF ORFs (Egr2, Zfp148, Zfp354c, Zfp451, Zfp688, Zscan20) within the latter libraries using GETPrime primers. To do this, we generated libraries with and without the selected target TF ORFs.
Funding
The Swiss National Science Foundation; SystemsX.ch; the NCCR program Frontiers in Genetics; Marie Curie International Reintegration Grant from the Seventh Research Framework Programme (to B.D.); Institutional support from the Ecole Polytechnique Fédérale de Lausanne (EPFL). Funding for open access charge: Ecole Polytechnique Fédérale de Lausanne (EPFL).
Conflict of interest. None declared.
Acknowledgements
C.G. designed and programmed GETPrime, carried out the primer testing and drafted the manuscript. A.G. designed and programmed GETPrime together with A.M. K.H. supervised the primer testing and revised the interface. F.D. loaded the GETPrime primers, designed their alignments in the browser. F.De. tested GETPrime and also designed the graphical user interface. J.R. supervised the project and assisted in the programming of GETPrime. B.D. supervised the design and the programming of GETPrime, tested the program, revised the interface and drafted the manuscript. All authors revised and approved the final manuscript.
