


Abstract
The identification of novel candidate markers is a key challenge in the development of cancer therapies. This can be facilitated by putting accessible and automated approaches analysing the current wealth of ‘omic’-scale data in the hands of researchers who are directly addressing biological questions. Data integration techniques and standardized, automated, high-throughput analyses are needed to manage the data available as well as to help narrow down the excessive number of target gene possibilities presented by modern databases and system-level resources. Here we present CancerMA, an online, integrated bioinformatic pipeline for automated identification of novel candidate cancer markers/targets; it operates by means of meta-analysing expression profiles of user-defined sets of biologically significant and related genes across a manually curated database of 80 publicly available cancer microarray datasets covering 13 cancer types. A simple-to-use web interface allows bioinformaticians and non-bioinformaticians alike to initiate new analyses as well as to view and retrieve the meta-analysis results. The functionality of CancerMA is shown by means of two validation datasets.
Database URL:http://www.cancerma.org.uk
Introduction
Cancer is a multi-factorial disease that can arise from alterations in expression levels of oncogenes and tumour suppressor genes, details of which can be elucidated by means of expression data (1). In the last decade, a large amount of microarray data for gene expression profiles has become available in public repositories such as ArrayExpress (2) and Gene Expression Omnibus (GEO) (3), which provide the opportunity to retrieve, reanalyse and integrate the data (4). Retrieval and reanalysis of publicly available data allow the development of automated pipelines to ensure a broad spectrum of users can execute rapid, homogeneous and reproducible analyses across a large number of datasets, addressing novel and specific questions. Data integration techniques, so-called meta-analyses, aim to combine the data available and integrate information from multiple independent but related microarray studies to identify significant genes [reviewed by Feichtinger et al. (5)]. Combining studies can enhance reliability and generalizability of the results (6) and can be used to obtain a more precise estimate of gene expression. In particular, the benefit of enhancing the statistical power can help to overcome the most profound limitation of microarray studies: testing tens of thousands of hypotheses, relying only on a relatively low number of samples (7, 8). For example, Arasappan et al. (9) found a refined expression signature for systemic lupus erythematosus, and Vierlinger et al. (10) reported the identification of a potential biomarker for papillary thyroid carcinoma by means of meta-analysis approaches.
Here we present CancerMA, an openly accessible integrated bioinformatic analytical pipeline with a user-friendly and intuitive web interface to automate the reanalysis of public cancer microarray datasets with user-defined sets of biologically significant and related genes. The underlying analytical approach was developed for a previous study to identify a cohort of novel cancer-specific marker genes (11) and was automated forming the core of the CancerMA tool. Further analyses and visualizations were added to aid the data interpretation. This tool allows bioinformaticians and non-bioinformaticians alike, to obtain refined and integrated differential expression for their genes of interest across a manually curated database of 80 datasets and 13 cancer types as well as to investigate the relationships between cancer types and to reveal commonalities among them. Furthermore, it can help to narrow down the excessive number of target gene possibilities presented by modern databases and system-level resources to a manageable number of putative candidates, which can be followed up in the laboratory and/or fed into an interaction network analysis. Thus, it puts a meta-analysis pipeline in the hands of those asking the biological questions. To validate our approach, we have analysed two experimentally derived datasets from the literature and could reproduce the published results.
Methods and structure of CancerMA
CancerMA consists of a web interface, a set of pipelined analyses and two relational databases, one holding the analysis data for each user and another one holding the gene annotation data. The general workflow is visualized in Figure 1.
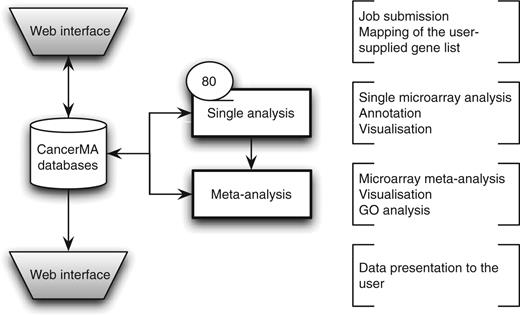
CancerMA workflow. The web interface box indicates the areas where the user provides input and/or can view the mapping or analysis results. The analysis is carried out automatically without any user input. The single analysis determines the differential expression for 80 cancer microarray datasets individually, whereas the meta-analysis combines the results form the individual analyses to a differential meta-expression profile.
Cancer dataset retrieval
We searched for raw data of patient-derived, untreated cancer samples with corresponding normal samples deposited in the ArrayExpress (2) or the GEO (3) repository using the HG-U133 Plus 2 array from Affymetrix. After manual assessment, we divided the retrieved datasets according to the cancer type, subtype and stage. We omitted datasets with less than three control or cancer samples as well as datasets deriving from foetal tissues, tissues influenced by other diseases or cancer-associated tissues (e.g. tumour microenvironment). We could obtain 92 datasets from 50 experiments covering 13 distinct cancer types. To allow a meta-analysis, at least two datasets per cancer type were required. Subsequently, quality control using the ‘simpleaffy’ R package (12) was used to further assess the datasets. Based on the guidelines from Affymetrix/‘simpleaffy’ (available at: http://www.bioconductor.org/packages/release/bioc/vignettes/simpleaffy/inst/doc/QCandSimpleaffy.pdf), datasets with scale factors with 3-fold of one another, an ActB 3′:mid ratio <3 and a GAPDH 3′:mid ratio <1.25 were selected. Scale factors assess the comparability of the arrays, whereas the signal ratios of ActB and GAPDH can be used to measure the RNA quality. Based on this assessment, we omitted 12 datasets and excluded individual CEL files of 37 datasets. Finally, 80 individual curated cancer datasets originating from 45 experiments and covering 13 different cancer types (Supplementary Table S1) remained. For more details, refer to Feichtinger et al. (11). The full list of 80 datasets, including the GEO/ArrayExpress accession numbers as well as the 13 cancer types covered, are available on the CancerMA website (http://www.cancerma.org.uk/information.html). Additional experimental datasets can be obtained from the microarray repositories and added to the pipeline by the authors as they become available.
The CancerMA pipeline and databases
The pipeline handles the single microarray analysis, the meta-analysis, the GO analysis as well as the annotation and the visualizations.
After manual assessment and quality control, all 80 datasets described above were individually pre-processed (background correction, normalization and computation of expression values) according to methods described by Hubbell et al. (13) using the ‘affy’ R package from Bioconductor (14), which assures uniformity of the analysis process.
For gene and probe annotation purposes, the Ensembl database (15), the HUGO Gene Nomenclature Committee (HGNC) database (16) and the annotation files provided by Affymetrix (available at: http://www.affymetrix.com/support/technical/annotationfilesmain.affx) were established as a local MySQL database.
When a new job is submitted, the user-supplied gene list is used to filter the 80 pre-processed datasets in order to reduce the number of features and enhance the statistical power (17). The ‘Limma’ R package (18) from Bioconductor is used to compute differentially expressed genes, and the resulting P-values are adjusted for multiple testing with Benjamini and Hochberg’s method to control the false discovery rate (19). For the single array analysis, genes with a P-value <0.05 and a log2-fold change >1 are selected as potentially significant.
Subsequently, the results of the 80 individual analyses are combined. A meta-P-value and a meta-log2-fold change value are calculated for each cancer type (Supplementary Table S1) as well as for all cancers in total using Stouffer’s method (20) and weighted linear combination (21), respectively. As two-sided P-values are oblivious to the effect direction, these P-values need to be converted to the corresponding one-sided P-values for up- and downregulation separately (22). In case of multiple probes mapping to the same gene identifier, the most extreme log 2-fold change value with its corresponding P-value are further used for feature selection. Genes with a |meta-log2-fold change| >1 or a confidence interval that does not span 0, and a meta-P-value <0.05 are considered as potentially significant.
Finally, all significantly up- and downregulated genes of the meta-analysis are fed into a gene ontology (GO) enrichment analysis using the ‘GOstats’ R package (23) from Bioconductor.
To visualize the analysis results, Circos plots (24), forest plots (25) and Krona plots (26) are created. All data belonging to a user are stored for 30 days in the CancerMA user database, which can be accessed using the web interface during this time. This analytical approach was developed for a previous study published by the authors, and automated for the basis of the CancerMA tool. For more details, refer to Feichtinger et al. (11).
The CancerMA web interface
First, the CancerMA web interface handles the mapping of a user-supplied gene list as well as the subsequent job submission. Second, it allows the user to access the analysis results.
When submitting a new job, the user supplies a list consisting either of Ensembl IDs or of gene names, for which the identifiers are then mapped to their appropriate Affymetrix IDs by the tool to tell the user which genes can be analysed. Finally, the job can be submitted by providing an email address.
When viewing a finished job, the results of the various analyses and the visualizations are presented to the user in a simple-to-use web interface. All result files are also available for download. To view an example, visit http://www.cancerma.org.uk.
Implementation
CancerMA is running on an Intel core i7 2.66 Ghz workstation with 12 Gb RAM and installed with CentOS 5.4 GNU Linux OS (x86_64). For the relational databases, MySQL 5.0.77 (available at: http://www.mysql.com) was used. The CancerMA web interface was implemented using: HTML/CSS, Twitter Bootstrapp (available at: http://twitter.github.com/bootstrap/), Javascript/jQuery (available at: http://jquery.com/) and Perl 5.8.8 (available at: http://www.perl.org). The CancerMA pipeline was implemented using: R 2.12.1 (available at: http://www.cran.r-project.org) (27); the Bioconductor package (available at: http://www.bioconductor.org) (28) and Perl 5.8.8 (available at: http://www.perl.org). CancerMA is freely available online at http://www.cancerma.org.uk.
Use of CancerMA
CancerMA was developed for automated computation of the differential meta-expression for genes of interest to biologists/clinicians and, in particular, as a user-friendly and intuitive tool to view and interpret the analysis results. The CancerMA web interface for viewing the analysis data consists of three sections: a general overview, the information section as well as the result section. The general overview provides basic information about the submitted job and the data available to the user. The information section includes among others the annotated genes of interest and information about the datasets used in the analysis. The result section includes the analysis results of the meta-analysis, of the single analyses, of the single analyses (only) and of the GO enrichment analysis. The meta-analysis results comprise tables with statistical values and visualizations for the meta-upregulated as well as for the meta-downregulated genes of interest. The GO analysis results contain the enriched GO terms for the meta-up- and the meta-downregulated genes, respectively. The single analysis results show all up- and downregulations of the genes of interest in all individually analysed datasets. The single analysis (only) results, however, provide genes of interest which are either consistently up- or downregulated across the datasets. Circos and Krona plots visualize the single and meta-analysis results in their entirety to highlight relationships within the data. Furthermore, forest plots visualize the meta-analysis results for each gene separately. For a detailed documentation, please refer to the CancerMA help section (http://www.cancerma.org.uk/help.html).
Validation
We used two experimentally determined datasets providing genes differentially expressed in cancer to validate our analysis results and demonstrate the utility and the functionality of the tool: (i) 10 upregulated and 9 downregulated genes in lung cancer determined by cDNA array analysis and partially validated by RT–PCR (29) and (ii) 13 upregulated genes in ovarian cancer validated by RT–PCR (30).
The meta-analysis results of the 17 differentially expressed genes in lung cancer (two genes reported to be upregulated were not present on the arrays used by CancerMA) were consistent with the findings described by Kettunen et al. (29) (Figure 2). Most genes determined to be up- or downregulated in this study were reported in various other publications to be up- or downregulated accordingly (31–42). For example, the expression of the gene CAV1 was found to be highly downregulated in five of six cancer microarray datasets (Figure 3). This also provides a good example for the capability of meta-analysis techniques to identify a more valid set of differentially expressed genes, as biological, experimental and technological variations, including differences in experimental conditions, tissues, cell lines, species, platforms, sample treatment and processing can lead to inconsistencies in gene expression, which reflect the differences in the experimental setting in addition to the objective studied (43). Furthermore, interesting patterns emerge from our meta-analysis results; for example, the expression of PLK2, MMP11, CCNB1 and TIMP1 is mainly upregulated in cancer (Figure 2A), whereas the expression of AKAP12, CAV1, CAV2, COPEB/KLF6 and BENE/MALL is mainly downregulated in cancer (Figure 2B). Additionally, commonalities between cancer types can be inferred; for example, the expression pattern found in lung cancer is highly similar to the one in colorectal, ovarian and breast cancer, in particular for the upregulated genes (Figure 2A).
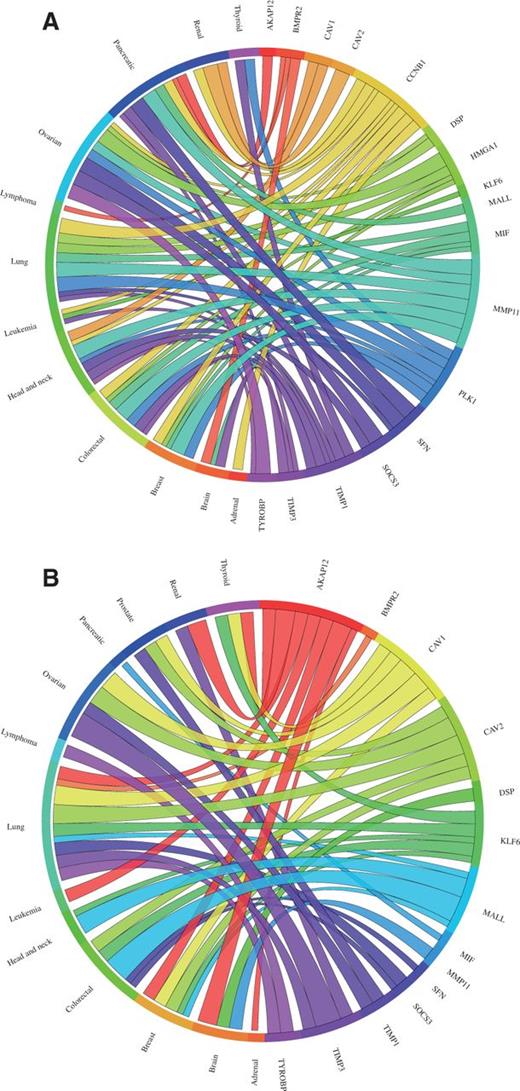
Circos plots showing the meta-change in gene expression in relation to corresponding cancer types. The plot shows the meta-up- and meta-downregulated genes of the validation dataset from Kettunen et al. (29): (A) The expression of the genes DSP, CCNB1, PLK1, MIF, HMGA1, SFN, TIMP1 and MMP11 was found to be upregulated, whereas (B) the expression of the genes AKAP12, BMPR2, COPEB/KLF6, SOCS3, BENE/MALL, TIMP3, CAV1, CAV2 and TYROBP was found to be downregulated in lung cancer consistent with the published results. Each connection between a gene and a cancer type indicates a statistically significant mean up- or downregulation for that cancer type derived from a number of combined array studies for cancer tissue versus normal tissue. The weight of the connection corresponds to the magnitude of the meta-change in gene expression.
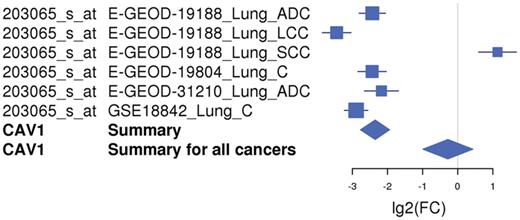
An example of a forest plot showing the expression of gene CAV1 downregulated in lung cancer. The expression of the CAV1 gene is downregulated in five of six microarray studies and upregulated in one study. The forest plot shows the meta-log 2-fold change values for the individual studies as well as the total values for lung cancer and for all cancer types combined. Each study is illustrated by a square; the position on the x-axis representing the measure estimate (lg2FC ratio), the size proportional to the weight of the study and the horizontal line through it reflecting the confidence interval of the estimate.
Our meta-analysis of the ovarian cancer validation dataset resulted in eight genes significantly upregulated, consistent with the results described by Hough et al. (30), four genes not differentially expressed and one gene downregulated (Figure 4). Almost all upregulated genes were reported in various other publications to also be upregulated in ovarian cancers (44–51). Several clinical trials examining the efficiency of an immunotherapy targeting the products of these genes are currently running (52, 53). According to our meta-analysis, TIMP3 expression was found to be significantly downregulated in ovarian cancer. However, this is consistent with the findings that TIMP3 is a possible tumour suppressor gene. An analysis of DNA copy number and gene expression of 22q in 18 ovarian carcinomas has shown that copy number loss across the TIMP3 locus is frequent, leading to decreased detectable TIMP3 mRNA levels (54). Furthermore, TIMP3 expression was reported to be downregulated in the lung cancer validation dataset that we used (29) and Hough et al. (30) noted that TIMP3 was not highly or consistently expressed in their tumour samples. The four genes (IGFBP2, MGP, STAT1 and SLP1) not showing significant upregulation appear to lack consistency in expression across tumour samples and/or cancer subtypes, as according to the single microarray analysis they are upregulated just in some microarray datasets (Supplementary Figure S1). This is also consistent with the findings of Hough et al. (30, 50), as they report that IGFBP2 was not consistently expressed between their tumour samples. Furthermore, STAT1 was reported to be overexpressed only in certain subtypes of serous ovarian carcinomas (55).
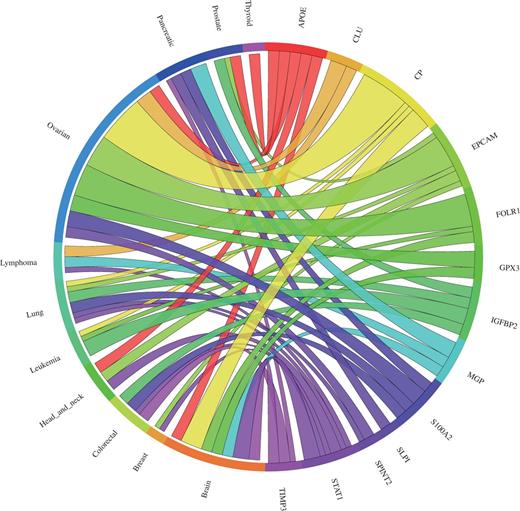
Circos plot showing the meta-change in gene expression in relation to corresponding cancer types. The plot shows the meta-upregulated genes of the validation dataset from Hough et al. (30): The expression of the genes GPX3, CLU, EPCAM, SPINT2, FOLR1, S100A2, APOE and CP was found to be upregulated in ovarian cancer consistent with the published results. Each connection between a gene and a cancer type indicates a statistically significant mean up- or downregulation for that cancer type derived from a number of combined array studies for cancer tissue versus normal tissue. The weight of the connection corresponds to the magnitude of the meta-change in gene expression.
Example workflow
In our previously published work (11) we have analysed human meiotic genes using the analytical approach now implemented into CancerMA and, with RT–PCR experimental validation, identified a novel, clinically relevant subgroup of the cancer/testis gene family (the meiCT genes), which have potential as novel cancer markers and therapeutic targets. This work serves as an example workflow for potential users.
Discussion
Purposes and benefits of CancerMA
CancerMA allows the automated computation of the differential meta-expression for genes of interest to biologists/clinicians across 80 cancer microarray-derived datasets covering 13 cancer types. As shown by the validation, our meta-analysis approach enhances the statistical power by increasing the sample size and can resolve conflicting conclusions between individual studies by finding a more valid set of differentially expressed genes. Furthermore, our pipeline approach focuses on the meta-analysis on a set of related genes specified by the user, which additionally serves to enhance the significance and accuracy of the analysis, and also to narrow down the excessive number of possibilities presented by whole genome arrays to a manageable number of putative leads (17). Direct experimental evidence or other inferred relationships, such as genes involved in interaction networks, can serve as a basis to compile a set of related genes. Relationships within a gene set could include co-expression, co-regulation, affiliation to the same pathway or biological process as well as common pathological involvement.
Screening for the differential expression within a given set of genes could reveal diagnostic, therapeutic and prognostic strategies and applications for specific cancer types as well as uncover common dysfunction of specific genes, gene modules or pathways across various cancer types. Furthermore, genome-scale meta-analysis can reveal common drivers of change or similar expression modules across various cancer types and therefore point towards conserved disrupted pathways or mechanisms in cancer; for example, the p53 pathway is often disrupted in cancer either due to point mutations in TP53 gene or due to one of the numerous alternative gene mutations that may lead to disruption of this pathway at key points [reviewed by Vogelstein et al. (56)]. Genetic alterations in different genes can often manifest a similar or common phenotype where these genes are related as part of the same pathway. The fact that mutations in a vast number of genes have been associated with cancer, yet disruption of only a few key pathways may give rise to the characteristics of cancer, highlights the importance of focussing on sets of related or interacting genes [reviewed by Vogelstein and Kinzler (1)].
CancerMA relies on the availability of public microarray data. Currently, we can cover 13 cancer types, but we hope that further datasets will become available in due course allowing us to expand the meta-analysis. Furthermore, we have selected datasets using the Affymetrix UG-133 Plus 2 array, as this array type is widely used and covers a large proportion of the human genome. Nevertheless, a number of genes (in particular, novel gene discoveries) are not covered by this array type and thus cannot be evaluated by this tool. However, we intend to continue the development of this tool, extending CancerMA to incorporate other Affymetrix array types and arrays form other platforms such as Illumina in due course.
Comparison to databases and tools currently available
Additionally to the repositories storing microarray data such as ArrayExpress and GEO (3), more specialized databases have become available; for example, databases such as M2DB (57) and M3D (58) collected microarray data and uniformly pre-processed it, but do not provide data analysis and integration. Web platforms such as Oncomine (59), GEO Profiles (3), Gene Expression Atlas (available at: http://www.ebi.ac.uk/gxa/) or Gemma (60) focus on gene expression profiles across multiple conditions and tissues but do not combine the results of the individual studies. Web platforms such as GeneSapiens (61) and Genevestigator (62) combine individual studies by pooling and subsequently analysing the data with traditional techniques but do not use meta-analysis approaches. However, various microarray meta-analysis approaches are available as R packages such as metaMA (63), Rankprod (64) and metaArray (65), but require skills in statistics and R. Therefore, a simple-to-use web tool such as CancerMA providing the computation of the meta-expression profile using manually curated, patient-derived cancer microarrays for a set of genes of interests to biologists/clinicians to a wide audience is not yet available to our knowledge [for a detailed review of meta-analysis databases and tools, refer to Feichtinger et al. (5)].
Conclusion
In summary, we present CancerMA, an integrated bioinformatic analytical pipeline to automate the identification of novel candidate cancer markers/targets by means of analysing the expression of user-supplied gene lists across a manually curated database of 80 publicly available cancer microarray datasets and 13 cancer types. Such a meta-analysis enhances reliability and generalizability of the analysis results and leads to a more precise estimate of gene expression. Furthermore, the pipeline facilitates automated, homogeneous and reproducible analysis across a large number of datasets, and establishing a simple-to-use online web interface to access the pipeline puts specialist meta-analyses in the hands of biologists.
Funding
The Welsh National Institute for Social Care and Health Research (NISCHR) (HS/09/008 to J.F.); North West Cancer Research Fund grant (NWCRF) (CR888 to R.J.M.). Funding for open access charge: NISCHR (award number: HS/09/008).
Conflict of interest. None declared.
Acknowledgements
The authors would like to thank Dr Sarah Morgan and Dr Jane Wakeman for their assistance in proofreading the manuscript.
References
Author notes
Citation details: Julia Feichtinger, Ramsay J. McFarlane and Lee D. Larcombe. CancerMA: a web-based tool for automatic meta-analysis of public cancer microarray data. Database (2012) Vol. 2012: article ID bas055; doi:10.1093/database/bas055.
