


Abstract
Common metabolic and endocrine diseases such as diabetes affect millions of people worldwide and have a major health impact, frequently leading to complications and mortality. In a search for better prevention and treatment, there is ongoing research into the underlying molecular and genetic bases of these complex human diseases, as well as into the links with risk factors such as obesity. Although an increasing number of relevant genomic and proteomic data sets have become available, the quantity and diversity of the data make their efficient exploitation challenging. Here, we present metabolicMine, a data warehouse with a specific focus on the genomics, genetics and proteomics of common metabolic diseases. Developed in collaboration with leading UK metabolic disease groups, metabolicMine integrates data sets from a range of experiments and model organisms alongside tools for exploring them. The current version brings together information covering genes, proteins, orthologues, interactions, gene expression, pathways, ontologies, diseases, genome-wide association studies and single nucleotide polymorphisms. Although the emphasis is on human data, key data sets from mouse and rat are included. These are complemented by interoperation with the RatMine rat genomics database, with a corresponding mouse version under development by the Mouse Genome Informatics (MGI) group. The web interface contains a number of features including keyword search, a library of Search Forms, the QueryBuilder and list analysis tools. This provides researchers with many different ways to analyse, view and flexibly export data. Programming interfaces and automatic code generation in several languages are supported, and many of the features of the web interface are available through web services. The combination of diverse data sets integrated with analysis tools and a powerful query system makes metabolicMine a valuable research resource. The web interface makes it accessible to first-time users, whereas the Application Programming Interface (API) and web services provide convenient data access and tools for bioinformaticians. metabolicMine is freely available online at http://www.metabolicmine.org
Database URL:http://www.metabolicmine.org
Introduction
Metabolic disorders, thought to result from the interaction of genetic factors with the environment (1), are seen as a global health concern (2). Diabetes alone is reported to affect in excess of 285 million people and constitutes one of the leading and growing causes of mortality worldwide (3). Novel genome-wide approaches to the study of disease susceptibility have yielded some interesting results, leading to the discovery of a number of genes implicated in common metabolic diseases (1, 4, 5), including an international effort to find loci associated with type 2 diabetes (6). The challenge from here is to take this research further by identifying a more complete set of susceptibility genes, as well as using existing knowledge to provide insight into the molecular mechanisms underlying metabolic diseases.
Genomics and proteomics methods are perfectly suited to this task in terms of providing a system-wide view necessary for understanding complex diseases, but they come with their own set of interpretation challenges. Although integration of different kinds of data has the potential to add considerable power and robustness to data analysis (7), asking questions across domains of biological knowledge also requires significant effort and expertise (8). The range of, sometimes very large, data sets in a wide variety of formats and locations presents researchers with a significant task of assembling data into a common format to enable integrative analysis. Additionally, having to select from the vast array of available analysis packages and tools adds further layers of complexity. A consultation with our research collaborators revealed a need for an integrated genomics and proteomics resource to address some of these issues, such as providing easier data integration and identifier resolution, as well as data collation and analysis. metabolicMine was developed with these needs in mind.
A number of databases relevant to metabolic disease research already exist. These range from genetic databases such as OMIM (9) and T2D-Db (10), rare metabolic disease databases based on individual case reports such as RAMEDIS (11), to general metabolic and endocrine databases such as the Human Metabolome Database (12) and Hmrbase (13). In addition to the aforementioned custom databases, there are a number of data integration platforms available, including BioMart (14), BioWarehouse (15) and InterMine (16). metabolicMine has been built with the InterMine platform because it provides a useful combination of features including fast keyword searches, a flexible querying system, list analysis, visualization tools and a space for researchers to save their own lists and queries.
metabolicMine contains a range of human data sets and also related rat and mouse data, allowing researchers to draw on a wide range of biomedical studies. Comprehensive genetics, genomics and proteomics data sets, such as the ones from Ensembl, NCBI and Uniprot, include all records for the specific taxons and are included in full for human, rat and mouse data. These datasets are integrated alongside complementary full-data collections containing metabolic disease-relevant subsets, e.g. metabolic pathways from KEGG and Reactome, the Genome-Wide Association Studies (GWAS) Catalogue (containing various type II diabetes, metabolism and obesity studies) and gene expression data from studies profiling metabolic disease-relevant tissues and subjects. The collection of diverse integrated data sets, along with facilities for more in-depth data mining, makes metabolicMine a potentially valuable resource to the metabolic disease research community.
Features
metabolicMine allows researchers to perform data analysis drawing on a wide range of data sets relevant to metabolic diseases. It provides a number of tools for this. In brief, the web interface provides researchers with a way to browse through the data, input their own lists, construct and run queries, as well as visualize, save and export the results. Alongside the keyword search and query capabilities, a region search tool is also included. To save the analysis results, a private ‘MyMine’ workspace exists for storage of lists and queries. The outputs of queries can be used as the basis for further queries and list analysis, thus allowing iterative analysis. The results can be exported in a variety of formats, and can also be exported directly to Galaxy (17). Here, we present a more detailed overview of the main metabolicMine features, using a range of examples to illustrate the tools available and their utility.
Data browsing
The QuickSearch tool provides full-text searching across all fields of the database. It supports the use of identifiers (e.g. gene symbols, accession codes, PubMed identifiers), keywords (e.g. diabetes) and authors (e.g. Sanger F), and accepts wildcards (*) and the Boolean operators AND, OR and NOT. This enables exploratory data browsing, as well as quick access to specific information. For example, a broad search for ‘diabetes’ gives >8000 results, ranging from genes and publications to pathways, disease descriptions and GWAS results. Faceted filtering options then enable further refinement by category or by organism (Figure 1). Thus, filtering the ‘diabetes’ search to only include the ‘Gene’ category gives 1407 genes—around 800 human, 400 mouse and 100 rat—for which there is evidence (e.g. from UniProt curated comments and GWAS studies) for association with diabetes. From here, there are links to the report pages for individual diabetes-related genes. Alternatively, researchers interested in a particular gene can find the information about it quickly—a search for the diabetes-associated gene HNF1A leads to information about the human, mouse and rat homologues, as well as links to a range of associated publications.
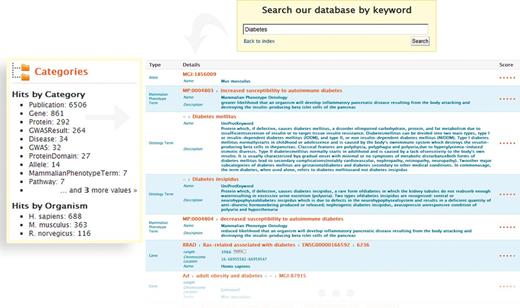
Keyword search and faceted results filtering in metabolicMine. A researcher conducts a broad keyword search with the word ‘Diabetes’. The search engine operates across all data fields, and a category filter shows the different data types matching the search terms (e.g. Gene, Protein, GO Term or GWAS). The Lucene indexing library generates a score from 0 to 1 for the keyword search, based on how closely the search term matched what is in the search index. The results can then be refined by Category (by selecting, for example, ‘Gene’ or Publication) or by Organism (human, rat or mouse).
Report pages
Each data object in metabolicMine has a report page, which typically contains information collated from a range of different data sets. Tables, interactive graphical displays and links enable researchers to explore each kind of data, for instance giving them a broad view of the many different functions an important gene, or other data object, may have. In addition, as all data are interlinked and have their own report pages, the report pages serve as a starting point for further data exploration. Support for synonymous names is included as part of identifier resolution. Here, we illustrate the utility of report page features by using them to explore information about the human diabetes gene PPARG.
Using QuickSearch, the first search result for PPARG leads to the gene report page (Figure 2). Here, one can discover that this gene is a nuclear receptor involved in adipocyte differentiation, and that PPARG defects are associated with conditions including diabetes and hypertension and may be connected to obesity susceptibility. Staining data from ProteinAtlas (18) indicate that the presence of PPARG is strongest in the digestive tract (Figure 2B). The disease gene expression data for ArrayExpress (19) show the gene is strongly upregulated in a number of cancers including bladder, prostate, esophageal and colorectal cancer, as well as in conditions such as irritable bowel syndrome and polycystic ovary syndrome (Figure 2C). This fits with a suggested link between the upregulation of PPARG, a collection of risk factors sometimes termed ‘metabolic syndrome’, and susceptibility to certain types of cancer (20).
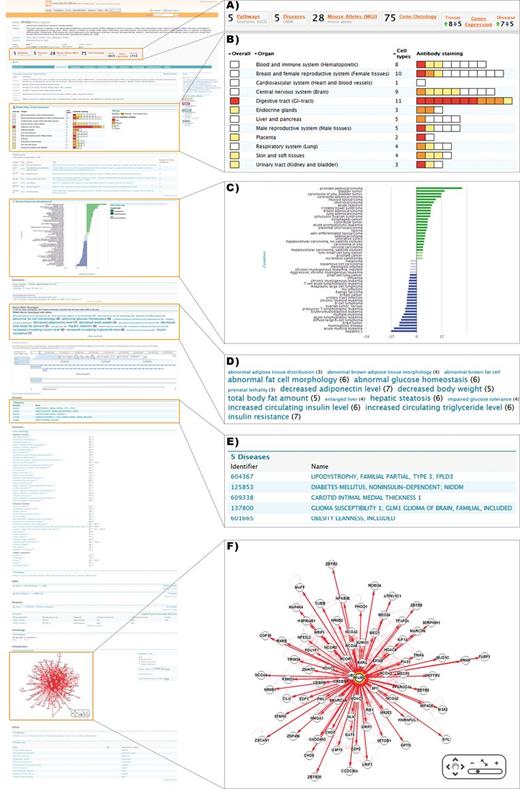
Detailed view of a metabolicMine gene report page, focusing on the gene PPARG. Report pages collate information from a range of data sets and include visualization tools and further links. (A) Previews provide summary counts for key data sets, helping the user identify relevant information. (B) Heatmaps are used to indicate PPARG protein levels in different tissues based on staining results in Protein Atlas. (C) Disease expression data from ArrayExpress is visualized, enabling exploration of links with different diseases. (D) The phenotype Tag Cloud is associated with the available alleles of the mouse PPARG homologue, enabling researchers to find interesting mouse strains for further experiments. Phenotypes with more alleles are displayed more prominently. (E) Human disease associations are summarized in tabular form and hyperlinked to the relevant report pages. (F) An interactive graphical tool enables exploration of PPARG's interactions with other genes, generated using data from IntAct and BioGRID.
Links to ∼1400 publications featuring this gene are included, and at a glance implicate it in a range of conditions ranging from colitis and fatty liver to osteoporosis. Like all results tables, the publications data can be exported and potentially used for text mining. Pathway information is also available, and indicates reported roles in five pathways, including the PPAR signalling pathway, as well as thyroid cancer and Huntington’s disease. The pathway names are linked to the lists of genes present in the pathway in question, which can then be exported, or explored further using list analysis pages.
Another feature of particular interest to experimental scientists is the incorporation of key data from model organisms. This means that the researcher can immediately see that there is a PPARG mouse homologue, and that the alleles have a high prevalence of insulin resistance phenotypes, among others (Figure 2D). Exploration of the mouse allele data can identify mouse strains useful for further studies, as well as additional genes sharing the same phenotype. This facilitates serendipitous biological discovery, as well as helping researchers explore a range of relevant resources.
List analysis
Genomics and proteomics experiments often generate large lists of genes, proteins or sequence variants. A common goal for the researcher is to prioritize these into sets of candidates for further study [see (21) and references therein]. This becomes particularly challenging when analysing the output of high-throughput experiments, where thousands of genes might be flagged in the same experiment, making the identification of candidate genes through manual curation extremely time-consuming.
To help address the aforementioned challenges, metabolicMine allows researchers to both upload lists of items from external sources and create lists from search results. Identifier resolution takes place automatically, meaning that users can upload old identifiers, and these can be converted to current identifiers through their synonyms [for more information on the technical aspects of identifier resolution, see Smith et al. (16)]. Each time a list is created (or if an existing list is visited from the Lists tab), the researcher is presented with a list analysis page that combines collated data and summary statistics. This enables sets with similar properties (e.g. functional annotations or pathway membership) to be quickly identified, making it particularly well suited to the task of data filtering and exploration. The ‘list analysis’ pages include graphical and statistical tools (‘widgets’), which summarize and highlight properties of the list, and also provide further opportunities to filter large lists to a smaller set of interesting candidates.
To illustrate the features of the list analysis tools, we randomly selected a list of 450 human genes and seeded it with 50 human genes annotated with the gene ontology (GO) term ‘insulin receptor signaling pathway’ [GO:0008286], producing a sample of 500 genes (included as a Supplementary Data). Uploading the gene list to metabolicMine automatically generates summary statistics for a range of data sets, including GO enrichment and pathway enrichment (Figure 3A). The GO enrichment widget identifies 52 insulin receptor signalling genes, including all of the seeded 50. Likewise, the pathway enrichment widget identifies the insulin signalling pathway from KEGG as the top result, and the enriched publications describe members of the insulin signalling cascade, such as PI3 kinase and mTOR.
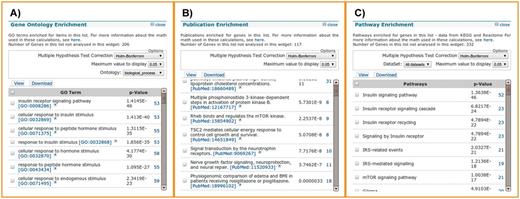
List analysis tools. List analysis pages contain a number of graphical and statistical analysis tools (‘widgets’). Here, we show examples of the tools available, using 450 randomly selected genes with 50 insulin receptor signalling pathway genes spiked in. (A) The GO enrichment analysis correctly identifies the 50 genes involved in the insulin receptor signalling pathway, along with 3 others that happened to be in the random gene list. (B) The publication enrichment widget identifies a number of articles describing members of the insulin signalling cascade, such as PI3 kinase and mTOR. (C) The pathway enrichment widget identifies the insulin signalling pathway from KEGG as the top result. This highlights how list analysis can be used to identify relevant target genes from a larger original gene set, for instance, one derived from a gene expression study.
The utility of these enrichment statistics tools rests on the fact that they calculate which properties are significantly over-represented in the list, and rank the properties according to the probability of them being present in a randomly selected set of the same size, with a choice of methods to compensate for multiple testing. The P-values are calculated using a hyper-geometric distribution, with the background population being all the genes in the organism in question, with the Holm–Bonferroni correction applied to the P-values unless the user specifies otherwise. The documentation can be found online at http://intermine.readthedocs.org/en/latest/embedding/list-widgets/enrichment-widgets/. This allows the user to find and focus only on the terms most relevant to the list in question, highlighting any surprising enrichments. These are then displayed alongside other data, such as known interactions with other genes loaded from IntAct (22) and BioGRID (23), and links to homologues in the yeast, fly and rat InterMine databases [(24–26), respectively]. Further information about the data is also included in metabolicMine, such as the interaction evidence codes from IntAct (22) and BioGRID (23). In addition, results from a set of commonly used ‘template’ searches are automatically displayed on the page, with the effect of collating information about the list members, such as single nucleotide polymorphism (SNPs) or GWAS associated with the genes.
Data querying
Although report pages and list analysis pages provide two powerful ways of viewing and analysing both single entities and sets of data, metabolicMine also provides tools for performing sophisticated searches across all of the integrated data. There is a library of predefined ‘template’ searches, created and modifiable using the QueryBuilder. These consist of simple forms with drop-down lists and text boxes with auto-completion, where users can specify filters (Figure 4). Some of them are simple searches, such as ‘Search for proteins containing a particular protein domain’ or ‘Find the predicted mouse orthologues for a particular gene’. Others include more complex searches, sometimes querying a number of data sets: for example, for the candidate gene(s) identified in a GWAS, show which genes they interact with. Importantly, researchers can constrain their searches to lists of items that they have previously saved, enabling analysis of sets of genes in one step.
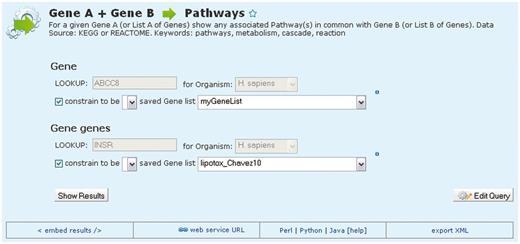
An example template search. MetabolicMine includes a library of template search forms—predefined searches designed to perform a particular task. Each one contains a description and a form, with default values, to fill in. In this example, the template compares two lists of genes and shows which genes from the two lists are members of the same pathway(s). Users can also modify templates and create their own using the QueryBuilder.
When a template search is executed, the results are returned in table format. As searching large data sets often produces many lines of output, results tables support a range of spreadsheet functionality to aid navigation, including column operations (sort, add-remove-hide columns, re-order columns) and in-place filtering. Data summaries are available for each column: for instance, for numeric data, simple summary statistics are provided, whereas for text data, the frequency at which terms are used is listed and additionally, these summaries provide options to filter results. Results tables also support list operations (including the creation of new lists or addition of items to an existing list) and allow flexible export of results in a range of different formats such as tab-separated (TAB) comma-separated (CSV), XML, gene feature format (GFF) and UCSC browser extensible data (BED) format. New lists can be derived from all or selected members of appropriate columns, facilitating iterative analysis.
Advanced users can modify templates to create new types of search, or directly create their own queries using the QueryBuilder tool. The QueryBuilder is a tool, which allows users to navigate through the integrated data model and build a query by (i) applying filters to the relevant data and (ii) selecting data fields that they wish to see in their results. The advantage of the QueryBuilder is that it allows users to combine data in any way they wish and produce a results table with exactly the columns of data that they require. Importantly, each template search can be edited using the QueryBuilder, for instance, filters can be removed or further ones added, or the choice of output columns can be changed. Thus, templates can be used as a starting point in the generation of related searches. The modified templates can then be saved for further use in the workspace of the user's ‘MyMine' account. The QueryBuilder is a powerful tool, allowing users to construct precise data mining queries according to their own specifications and aiding exploratory data analysis by allowing data to be combined in novel ways.
Template and/or QueryBuilder searches provide a convenient tool for answering specific questions and linking parts of analysis together (Figure 5). Templates can be combined with the different aspects of the metabolicMine interface. For instance, a researcher investigating diabetes susceptibility views the human PPARG gene report page and identifies mouse alleles with phenotypes related to insulin resistance. The researcher is interested in other genes that give the same phenotype. Entering the phenotype term ‘insulin resistance’ into the ‘Phenotype to Alleles’ template search form identifies 133 mouse genes sharing this phenotype. Creating a list from the results table, the researcher reaches the list analysis page, which automatically runs a number of enrichment algorithms on the data. As might be expected, the GO enrichment widget indicates that 28 of these genes are involved in ‘response to insulin stimulus’ [GO:0032868] (P < 4.7E-28). Additionally, 26 genes are involved in fatty acid metabolic processes [GO:0006631] (P < 1.3E-15). Accessed through the hyperlinked number, the researcher may view these fatty acid metabolism genes as a new results table and convert it to a new gene list for further analysis.
![Using metabolicMine to uncover additional candidate genes. A researcher viewing the human PPARG gene report page finds mouse alleles with an insulin resistance phenotype. Conducting a template search (Phenotype → Alleles) using this phenotype term identifies 133 mouse genes sharing this phenotype, which can be saved as a list. The list is presented on a list analysis page that automatically runs a number of enrichment algorithms on the data. The GO enrichment widget identifies a subset of 26 genes involved in fatty acid metabolic process [GO:0006631] (P < 1.3E-15) that can be saved as a new list. Converting this list to their human orthologues shows enrichment for the adipocytokine signalling pathway. In addition, the top hit from the publications enrichment widget describes human genes associated with high-density lipoprotein cholesterol (HDL-C). Together, these provide the researcher with additional candidate targets for exploring interventions for insulin resistance and dyslipidaemia.](https://oup.silverchair-cdn.com/oup/backfile/Content_public/Journal/database/2013/10.1093_database_bat060/3/m_bat060f5p.jpeg?Expires=1716553158&Signature=Mqn730Bg1Qr6K94HJBqcLRGBBjPIKgulge9OYC3Nfu4s~VGaO50B1vjOmJrZfboCV~ZJPovyDeN9i5gZVAubBhJ2-3c7hjTH6J3VNZw77zK8YDCrvy9Kw5I7iqK9WFfEI74rwDpEXHnVN9a2iIHwJpEvDR3QjCOfFvf6EEl-997NyrUxIWZYn1FpJNFtaREg7IpRK7cs3JL8hl0DYwD3ghgMKN0GK-X3sZSPVFNsltb78U0xQJuFbqTG960yDaGgebPlCE~t~dW6Pn3jJZJMbEyhBn7lTILFVy3GzDzP86Czv3~7xC6aC1yRf5QW22jH1GKIA7n2K5aRGIYT835-Ow__&Key-Pair-Id=APKAIE5G5CRDK6RD3PGA)
Using metabolicMine to uncover additional candidate genes. A researcher viewing the human PPARG gene report page finds mouse alleles with an insulin resistance phenotype. Conducting a template search (Phenotype → Alleles) using this phenotype term identifies 133 mouse genes sharing this phenotype, which can be saved as a list. The list is presented on a list analysis page that automatically runs a number of enrichment algorithms on the data. The GO enrichment widget identifies a subset of 26 genes involved in fatty acid metabolic process [GO:0006631] (P < 1.3E-15) that can be saved as a new list. Converting this list to their human orthologues shows enrichment for the adipocytokine signalling pathway. In addition, the top hit from the publications enrichment widget describes human genes associated with high-density lipoprotein cholesterol (HDL-C). Together, these provide the researcher with additional candidate targets for exploring interventions for insulin resistance and dyslipidaemia.
An important step in translational genomics is taking data from model organisms and extracting meaning from it to further human disease research. metabolicMine makes finding orthologues straightforward. In the aforementioned example, following the ‘H. sapiens’ orthologues link automatically creates a new list of 25 human genes orthologous to the 26 mouse genes in question using data from Ensembl Compara. Again, the GO enrichment widget on the list analysis page shows enrichment for lipid processes but, interestingly, the top hit from the publications enrichment widget describes human genes associated with high-density lipoprotein cholesterol (HDL-C), perhaps providing the researcher with additional candidates, e.g. dyslipidaemia interventions.
Region search
For many of the loci implicated in metabolic disease, such as the ones flagged in GWAS, it is not always clear which underlying variant or gene is involved (27, 28). Some loci contain multiple ‘plausible’ candidate genes, whereas other loci harbour no protein-coding genes at all, with many of the proposed disease-associated variations identified in GWAS occurring within gene deserts or other types of non-coding DNA (29, 30). This is problematic, as the correct identification of reliable localized markers, such as susceptibility SNPs, is crucial both to furthering our understanding of the diseases in question and to offering more precise diagnostics.
With this in mind, metabolicMine supports analysis of genomic intervals for either human or mouse through its regions search interface. This tool allows researchers to upload a set of chromosome coordinates and retrieve a list of genomic features such as genes, SNPs or non-coding RNAs contained within the region. A ‘liftover’ (31) service enables update of coordinates built on older genome assemblies, and uploaded intervals may be expanded bidirectionally by up to 10 Mb. In Figure 6, we present an example generated from genomic interval coordinates in the region of the genes PPARG, UBASH3A and TSPAN6. The interactive genome browser shows the UBASH3A area on chromosome 2, along with SNPs located in this region. Results are presented in order along each chromosome and are linked to the relevant report pages allowing further exploration of individual features found, such as genes, mRNA and SNPs. As with all of metabolicMine’s results pages, there are options to create lists from the genomic features, or export features in a range of useful formats.
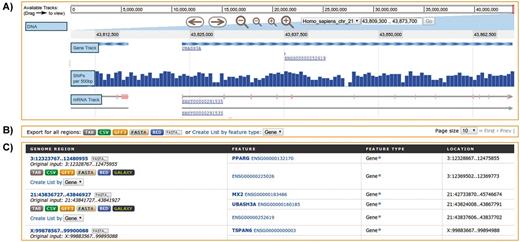
Regions Search. Analysis of genomic intervals using metabolicMine’s regions search, showing gene feature results from an uploaded list of genomic regions. (A) The embedded interactive genome browser allows a visual exploration of the results. (B) The results can be exported in a range of formats, including TAB, CSV, GFF, BED and FASTA. (C) The table displays results hyperlinked to individual report pages.
Future developments of the regions search will expand the range of genomic features to include regulatory markers such as sites of transcription factor binding and histone modification [e.g. from the ENCODE project (32)] and also allow analysis of intervals in the context of haploblock linkage disequilibrium information.
Construction and content
System architecture
A detailed description of the InterMine system has already been published elsewhere (16). Briefly, the core of it is based around an object/relational mapping system written in Java, which accepts object queries from a web application, and executes them in a PostgreSQL (33) relational database. To optimize the speed of the queries, InterMine makes use of a custom-built query optimizer that rewrites SQL queries to make use of pre-computed tables. The underlying data model is described through a simple XML file and the database schema, and corresponding Java classes and web application are automatically generated from this, reducing system maintenance time. InterMine contains an easily extensible data model specifically written for handling common types of biological data. In the 20 June 2013 Beta release, the metabolicMine database contains 318 million objects, and took 60 hours to build using a dedicated 16 core, 96 GB RAM build machine. Pre-processing of data forms a large part of the build time; some data are loaded from flat files, whereas others are loaded from database dumps. For example, the 54 million SNPs integrated in this build were retrieved from a local copy of a MySQL database through a number of queries covering multiple data tables. This builds a large pre-computed table that can be loaded into metabolicMine, taking between 10 and 14 h to integrate depending on the load on the build machine. The size of the database without pre-computed tables is 625 GB, whereas with them the size is ∼2.4 TB. With this many objects, database indexing can account for a significant portion of build time (typically 30–40% or 19 h of processing). The main bottlenecks in the build process are related either to data quality or to machine tolerance and load. For example, errors in data sources are caught by the in-build test that halts the build until the error can be identified and fixed. Also, the intensive flow of communications between and within databases can, occasionally, cause time-outs, which interrupt the build. In-build and post-build testing typically takes 1–2 days—usually split equally between a database developer (in-build tests) and a biologist (post-build tests). During the testing phase, a number of scripts perform data quality checks, which look at consistency and technically accurate data integration—e.g. highlighting and resolving missing, duplicate or inconsistent fields. Approximately half of the database releases complete without error and, of the builds that fail, most problems are resolved easily (e.g. database communication errors). However, ∼20% of errors require additional rebuild time and effort from both developer and biologist (e.g. a source data format change, which requires modification of the parsing scripts). More information on establishing your own InterMine instance can be found in Smith et al. (16), with tutorials available at http://www.intermine.org. However, although establishing an InterMine instance is relatively straightforward, building a resource as large as metabolicMine requires a lot of further work in terms of data loading and integration, as well as testing and maintenance. The InterMine APIs provide the opportunity to use metabolicMine integrated data and resources as a starting point for building other applications without needing to replicate the effort of building and maintaining metabolicMine itself.
Web services
For bioinformaticians, metabolicMine can also be accessed programmatically via RESTful web services. InterMine’s client libraries are available in a number of popular programming languages including Python, Perl, Ruby, Java and JavaScript. These client libraries give researchers access to all core functionality, as well as to metadata and specialized resources. This provides methods for powerful automation of analysis workflows, easy access to bulk customized data sets, as well as enabling complex interrogation of the data. Further to this, new resources can be developed using the web services. A recent example of this is the YeastGenome iPhone application developed by the Saccharomyces Genome Database (34) from their InterMine database, YeastMine (24).
Links to general documentation about InterMine are available at http://www.intermine.org, and information specific to web services including sample code is available at http://intermine.readthedocs.org/en/latest/web-services/. To further ease the web services learning curve, automated code generation is available for all queries within the InterMine web application—when a template or a query is selected, links to the automatically generated code for running the query via an API in Perl, Python, Ruby and Java are provided at the bottom of each query page.
Data quality checking
Automated and manual data validity checks are used to ensure the quality of the integrated data. For instance, data download scripts automatically check for new versions of data and perform basic validation including formatting, content and file integrity. Data parsers then load data into metabolicMine, and during this process many data validation and integration checks are carried out. For example, this includes an identifier resolution system, which performs and checks the reconciliation of identifiers across data sets from different data sources and genome versions. This system allows older data sets to be integrated successfully alongside new ones into a current InterMine database.
A number of automated tests are run after each database build to assess successful integration. These include consistency checks for the number of database objects created, the presence of duplicate objects, missing or empty fields or incorrect data types. Further scripts execute a catalogue of both simple and complex queries that, to execute successfully, require different data sources to be present and integrated correctly. Comparing the results of these queries between database releases is a powerful way to identify any problems that have occurred during the database build. We are in the process of exposing our test results at http://ci.intermine.org/
Data sources
metabolicMine integrates a wide variety of metabolic disease data, ranging from the known functions of genes and proteins [e.g. from RefSeq (35), UniProt (36)] to data sets, which may allow further inference of function, regulation and possible disease associations. GO (37) annotations present functional information, whereas gene expression, protein–protein and genetic interactions can reveal regulatory principles. Further to this, disease data are included, such as GWAS (38), OMIM (39) and mouse phenotypic alleles (40). A list of data sources integrated in the current release of metabolicMine is given under the ‘Data’ tab on the website front page, and is listed in Table 1.
Examples of data sources loaded into metabolicMine
| Data type | Source | URL | Data type | Source | URL |
|---|---|---|---|---|---|
| Genome annotation | Ensembl | www.ensembl.org | Phenotype ontology | MGI | www.obofoundry.org |
| Genes | NCBI | www.ncbi.nlm.nih.gov/gene | Gene ontology | GO | www.geneontology.org |
| Proteins | UniProt | www.uniprot.org | Gene expression | ArrayExpress | www.ebi.ac.uk/arrayexpress |
| Protein localization | Protein Atlas | www.proteinatlas.org | Orthologues | Ensembl Compara | www.ensembl.org/info/docs/compara |
| Protein domains | InterPro | www.ebi.ac.uk/interpro | Variation | Ensembl variation | www.ensembl.org/info/docs/variation |
| Protein interactions | IntAct | www.ebi.ac.uk/intact | includes dbSNP and 1000 genomes | ||
| Protein interactions | BioGRID | www.thebiogrid.org | Regulatory regions | Ensembl regulation | www.ensembl.org/info/docs/funcgen |
| Genetic interactions | BioGRID | www.thebiogrid.org | Pathways | Reactome | www.reactome.org |
| Protein structure | PDB | www.rcsb.org | Pathways | KEGG | www.genome.jp/kegg/pathway.html |
| Human diseases | OMIM | www.ncbi.nlm.nih.gov/omim | Disease ontology | Disease ontology | diseaseontology.sourceforge.net |
| Papers for genes | PubMed | pubmed.gov | GWAS | HuGE | hugenavigator.net |
Conclusions
metabolicMine is an integrated information resource facilitating genetic and genomic analysis of metabolic diseases, from finding relevant data sets and examining them, to providing an infrastructure that facilitates in-depth analysis. metabolicMine is unusual in the degree to which it gives access to relevant heterogeneous data sources.
metabolicMine is designed to help address some of the difficulties specific to performing integrative analysis. The data are presented in a standard format, bypassing, from the point of view of the user, the usual difficulties of dealing with data from heterogeneous sources. Furthermore, the data origin and metadata are preserved, enabling the researcher to make judgement calls about the use of particular data sets, and trace them from their original sources.
The summary information on particular genes is useful in terms of collating information in one place and facilitating the retrieval of data sets, saving researchers’ time and potentially introducing them to new and useful data. Further to that, the list analysis capacities help to distil the meaning from high-throughput experiments and large gene lists, making it easier for the researcher to glean biological meaning. This facilitates serendipitous research finding, by presenting an overview of results from standard tools that the researcher may not have otherwise had time to use. Finally, the advanced query capabilities of metabolicMine mean that users can answer specific and sophisticated biological questions while drawing on a large number of data sources without the high level of bioinformatics expertise that these types of analysis would typically require.
Following the successful implementation of metabolicMine as a pilot for integrating diverse human data and interoperating with model organism data, it is envisaged that the role of metabolicMine will be expanded to cover other disease areas, as part of the HumanMine project, starting in July 2013. One of the specific improvements we are planning as part of this is the inclusion of metabolomics data. Metabolomics has the potential to bridge the gap between genotype and phenotype, particularly in the study of common metabolic disorders. A number of public metabolomics reference databases and repositories have already been created, including HGMD (12), KEGG (41), HumanCyc (42), BiGG (43), LipidMaps (44), PubChem (45), ChEBI (46) and MetaboLights (47). Although currently we do not include metabolite data as part of metabolicMine, we eagerly await the wider adoption of metabolomics standards and intend to continue expanding and updating the metabolic disease data sets available, as part of a broader focus on the genomics of human health. There are also a large number of further data sets that can be added, including, for example drugs and their related diseases and targets.
Along with providing a broader base for human genomics, we will also focus on strengthening the facilities available for translational genomics, and thus enabling researchers to draw on a wealth of model organism experimental data alongside the human studies. This is being undertaken as a collaboration between InterMine (16) and five major model organism databases (MODs), including budding yeast (SGD, 34), rat (RGD, 48), zebrafish (ZFIN, 49), nematode worm (WormBase, 50) and mouse (MGI, 51), known as the InterMOD consortium (52). All of the MODs have built or are in the process of building their own InterMine instances—the first time these widely used resources have converged on a common software platform. Shared standards are being implemented, and further comparative tools are being developed to enable users to draw on a wide range of data to complement their research. This will provide researchers with not only a platform for interoperation with the MODs but also a greater depth of biomedical data to support research into the underlying processes that produce complex human disease. As such, HumanMine/metabolicMine data will be central to the interpretation of model organism data in a biomedical context.
In conclusion, metabolicMine presents a powerful framework for an integrative analysis of metabolic data, and one that will continue being updated and improved long-term. Given the importance of the data and the research surrounding it, combined with the data integration and powerful query capacities, we hope that this resource should be invaluable in the field of metabolic disease research.
Acknowledgements
We would like to thank Felicity Payne, Giles Yeo and Robert Semple for contributing use cases that have helped shape metabolicMine's functionality. We would also like to thank our collaborators Inês Barroso (WT Sanger Institute), Roger Cox (MRC Harwell), Tim Frayling (Peninsula Medical School), Philippe Froguel (Imperial College), Mark McCarthy (WTCHG, Oxford), Stephen O’Rahilly (IMS MRL, Cambridge) and Antonio Vidal-Puig (IMS MRL, Cambridge), along with their lab members, for valuable discussions of content, features and design for metabolicMine. M.L. and R.L. have developed the biological aspects of metabolicMine, while the computational aspects were developed by R.N.S., F.H., A.K. and R.S.. The article was written by M.L., R.L., J.A. and G.M., who conceived the project. All authors read and approved the final manuscript.
Funding
This work was supported by the Wellcome Trust (grant number 090297). Funding for open access charge: Wellcome Trust.
Conflict of interest. None declared.
References
Author notes
Citation details: Lyne M, Smith RN, Lyne R, et al. metabolicMine: an integrated genomics, genetics and proteomics data warehouse for common metabolic disease research. Database, Vol. 2013, Article ID bat060, doi:10.1093/database/bat060.
