


Abstract
Many stand-alone desktop software suites exist to visualize single nucleotide polymorphism (SNP) diversity, but web-based software that can be easily implemented and used for biological databases is absent. SNPversity was created to answer this need by building an open-source visualization tool that can be implemented on a Unix-like machine and served through a web browser that can be accessible worldwide. SNPversity consists of a HDF5 database back-end for SNPs, a data exchange layer powered by TASSEL libraries that represent data in JSON format, and an interface layer using PHP to visualize SNP information. SNPversity displays data in real-time through a web browser in grids that are color-coded according to a given SNP’s allelic status and mutational state. SNPversity is currently available at MaizeGDB, the maize community’s database, and will be soon available at GrainGenes, the clade-oriented database for Triticeae and Avena species, including wheat, barley, rye, and oat. The code and documentation are uploaded onto github, and they are freely available to the public. We expect that the tool will be highly useful for other biological databases with a similar need to display SNP diversity through their web interfaces.
Database URL: https://www.maizegdb.org/snpversity
Background
With low-cost genomic technologies, increasingly more data are available to biologists, and online biological databases, such as MaizeGDB (1) and GrainGenes (2), are being challenged by the diversity of data types that need to be curated, managed, queried, and visualized. For some data types, web-based software applications are already available. Among them are web-based browsers that display genome assemblies and genomic elements as horizontal customizable tracks, such as JBrowse (3) or Ensembl genome browser (4). For genotypic data, however, web-based graphical solutions are highly limited (but not not-existent: e.g. JBrowse offers solutions for SNP visualization for vcf and BAM formatted files). This is not due to the fact that genotypic data sets are less important to display, but rather because they are inherently more difficult to visualize when multiple stocks (including genetic stocks and breeding accessions) are involved, as they cannot be adequately displayed as 1D tracks, and at least 2D representations are necessary. For example, back in 1989, Young and Tanksley (5) represented restriction fragment length polymorphism maps for an individual in an F2 population on a graphical chromosome set by using black and white regions for different parental origins. Almost three decades later, highly accurate genotypic resolution has reached the single nucleotide level, and genotypes from multiple stocks can be measured and analyzed in a matter of hours.
Stand-alone desktop software applications for genotype visualization are already available and extensively used by researchers, including TASSEL (Trait Analysis by aSSociation, Evolution, and Linkage) (6) and FlapJack (7). Both software suites provide powerful ways of displaying genotypic data, along with a wide range of customization, visualization, and analysis tools. However, usage of these tools requires prior installation, lengthy downloads of the correctly formatted data sets, and other cumbersome actions which inhibit accessibility. In addition, they are desktop-based, and therefore usually incompatible for use with online biological databases, including model organism and clade-oriented databases. These databases are tightly integrated with related data sets and would benefit from displaying genotypic data of their favorite species for their respective communities. An online tool to display genotypic diversity would drastically increase the utility of biological databases. Their users will benefit greatly from having the ability to access to web-based visualization tools, especially the ability to link genotypic diversity data to other types of data that are already available.
On the downside, online applications usually have a narrower range of features and capabilities as compared to desktop applications. One reason is the utilization of different types of technologies: desktop applications have access to wide variety of technologies that are optimized for specific operating systems. These technologies profit from high-performance CPU power and fast accessibility and retrieval back and forth from a storage unit. Server-side online applications can also harness these technologies, but their performance is lower as there is an additional step of data transfer over the Internet that can be limited by bandwidth limitations. Compared to desktop applications, graphical rendering on a web browser adds an additional impediment to speed. To improve the performance of online applications, client-side applications are developed that rely on users’ computer power for its processing and graphical rendering. For client-side applications, data transfer rate can still be an issue, but instead of relying on a single local server, client-side applications use users’ computer resources for rendering and therefore reducing the load-balance burden on the local server considerably. What is gained in speed in client-side applications, however, is lost in the range of features and capabilities that are provided by desktop and server-side online applications. Despite these shortcomings, online tools can provide an intuitive and easy-to-use interface that allows rich cross-linking with other data types and informational pages on biological databases.
The need for a web-based tool to display diversity for biological databases was clearly expressed in a survey (8) conducted by MaizeGDB (9), the maize community’s database. In 2015, MaizeGDB prepared and sent a survey to maize geneticists and breeders to learn about their needs for displaying diversity. Forty-eight researchers from academia, industry, and government responded to the survey. The survey questions and raw responses, with personally identifiable information stripped, can be found here as Supplementary Material in the following reference (8). The survey identified and prioritized three areas of future development at MaizeGDB: (i) displaying single nucleotide polymorphisms (SNPs) in a given region for a given list of lines, (ii) showing haplotypes for a given list of lines, and (iii) presenting pedigree relationships visually. In a response to these survey results, MaizeGDB developed a web-based software to visualize SNP diversity for multiple maize stocks, to enable the maize research community to visualize, analyze, and share SNP diversity data.
In order to ensure a wide use of SNPversity for other biological databases, the MaizeGDB team made its code and documentation available through github (https://github.com). Other biological databases have shown interest in using the tool on their interfaces, and we are currently working with GrainGenes to implement SNPversity for small grains data.
Implementation
Operating systems and browsers
The usability of SNPversity at MaizeGDB was tested both on Windows operating system (Windows 10) and Unix-based systems. SNPversity was optimized on Firefox for PC and Mac. We tested the tool with Chrome version 56.0.2924.87, as well as Safari version 9.1.2.
Code base and documentation
Codebase and the documentation for SNPversity is deposited on github at https://github.com/Maize-Genetics-and-Genomics-Database/snpversity, and they are freely accessible to the public.
Data sets
The data sets are from Panzea (10–12). Panzea is a project focused on understanding the connection between phenotype and genotype for complex traits in maize and its wild relative teosinte. SNPversity has four data sets in total based on the maize B73 reference genome (13); two for the B73 RefGen_v2 reference genome (one raw, one imputed), and two for the B73 RefGen_v3 reference genome (one raw, one imputed). These datasets are freely available, but located behind an authentication protocol, handled by CyVerse (http://www.cyverse.org). Data sets for the recently released RefGen_v4 (14) are still being developed. The ZeaGBS data sets were sequenced using the lower resolution genotyping by sequencing (GBS) technique (15), and contain 955 690 SNPs. The HapMap data sets contain over 83 million SNPs, where 30 million SNPs are marked with ‘LLD’ high-confidence markers. The imputations for alleles not detected by experiments (16) were performed using the LinkImpute method (17).
The diversity sets are aligned to the different assemblies of B73 maize reference genome and each set contain different number of taxa and SNPs. GBS sets were created using genotype-by-sequencing approach, and HapMap is a larger set of SNPs derived using a range of methods. Imputed set infers alleles that are not experimentally detected. All SNP data sets can be downloaded from the Panzea website.
Data storage
Diversity data sets are created and formatted by Panzea (10–12) not in the form of a relational database, but in a Hierarchical Data Format (HDF) version 5 (HDF5). HDF is an open-sourced but highly complex file format specifically designed to store, traverse, and retrieve large amounts of data efficiently (hdfgroup.org), and, in comparison to relational database systems, provides advantages in reducing computational cost in both query processing time and disk storage space. On the downside, in order to optimally achieve efficient storage, an HDF file is stored as a binary file and querying it requires a compatible HDF reading software to be installed on the system. For this purpose, we used the TASSEL software application programming interface (APIs) (6) to access the diversity data. The data sets were developed and distributed publicly by the Panzea group. As these data sets are quite large, they can be accessed online through Panzea’s CyVerse data storage.
Application programming interface
TASSEL (Trait Analysis by aSSociation, Evolution, and Linkage) (18) is a high-performance toolkit whose primary purpose is investigating the relationship between phenotypes and genotypes using quantitative genetics. For instance, TASSEL offers a large selection of complex functions such as performing Genome Wide Association Studies (GWAS), GBS, Principal Component Analysis (PCA), as well as corresponding data visualization. TASSEL was developed and is currently maintained by the Buckler Lab for Maize Genetics and Diversity (19). We decided to use the TASSEL library because of portability (the code is written using the Java programming language), flexibility (TASSEL is an open-source library), and quick performance driven by TASSEL’s optimizations for big data and support for HDF5-data (18). TASSEL’s clear and extensible architecture allows for reuse of existing functions to suit our needs. For instance, we were able to implement our own writeToJSON() function [similar to writeToHapmap() or writeToVCF() in the ExportUtils class] that outputs a JSON file containing SNP data.
Sharing query results
One of our goals when designing this tool was to improve accessibility for our users. One factor to consider is the ability to share interesting queries, or have them ready for reinvestigation. For this reason, all executed query results remain accessible by a unique URL for up to 6 weeks. An automated script that removes generated files older than 6 weeks is executed on a weekly basis using the Cron scheduler. Furthermore, while viewing the results table, users have the option to export the current page into a comma separated values (CSV) format. This allows users to store query results permanently on their computer in a human-readable format. Users can then open the generated CSV files conveniently using their preferred spreadsheet software.
Technologies used in SNPversity
We used several different technologies to create SNPversity. An overview of the technologies, and how we used them are shown in Table 2.
The statistics of the current diversity data sets available at SNPversity for maize from Panzea (10–12)
| Name | Assembly | # Taxa | # SNPs | File size(GB) |
|---|---|---|---|---|
| Maize ZeaGBS v2.7 (imputed) | B73 RefGen_v2 | 17 280 | 955 690 | 5.5 |
| Maize ZeaGBS v2.7 (raw) | B73 RefGen_v2 | 18 013 | 955 690 | 3.8 |
| Maize HapMap v3.2.1 (imputed) | B73 RefGen_v3 | 1210 | 83 153 144 | 34.2 |
| Maize HapMap v3.2.1 (raw) | B73 RefGen_v3 | 1210 | 83 153 144 | 24.7 |
Technologies used in the creation of the SNPversity tool and their descriptions
| Name | Link | Description | Used by |
|---|---|---|---|
| Chosen | https://harvesthq.github.io/chosen/ | A jQuery plugin that make select boxes more user friendly | Homepage |
| JSON-simple | https://github.com/fangyidong/json-simple | Java library used to convert Java Objects into their JSON representation | Tassel wrapper |
| PostgreSQL | http://www.postgresql.org/download/ | Object-relational database management system | Server Back end (PHP) |
| BlockUI | http://malsup.com/jquery/block/ | jQuery plugin that blocks user interface (loading screen) | Homepage, Query Results page |
| Toolbar.js | http://paulkinzett.github.io/toolbar/ | A jQuery plugin that creates tooltip style toolbars | Query Results page |
| FontAwesome | https://fortawesome.github.io/Font-Awesome/ | CSS file including a wide selection of different icons | Query Results page |
| JQuery | https://jquery.com/download/ | Javascript library designed to simplify client-side scripting | Homepage, Query Results page |
| Tassel API | https://bitbucket.org/tasseladmin/ tassel-5-source/overview | Java platform designed for the optimized analysis of crop genomic diversity | Tassel wrapper |
Estimating time queries
We wrote a custom code, fetch_time.py, to estimate time queries, which is available on the github site. The script runs on Python 2.7 and takes in three parameters: data set name, number of stocks, and range of data set in bp. It then prints out and returns the estimated time in seconds. A basic example can be found under the ‘time_estimate’ folder on github. The type of algorithm to run by default is specified using the MODEL_TYPE variable at the beginning of the code. Supported options are ‘regression’ or ‘knn’. The multivariable regression function used comes from the statsmodels library (20). The KNN regressor is from scikit-learn (21).
Results and discussion
An overview of the SNPversity workflow
A high-level workflow of SNPversity is shown in Figure 1. In general terms, the SNPversity workflow is as follows. When a user reaches the homepage of SNPversity, he/she encounters a set of preferences and menu options to choose. The user then interacts with SNPversity by specifying maize assembly, stocks, and genomic coordinates of interest. Here the menus for stocks are dynamically generated on the fly through system calls that use TASSEL libraries for data query and extraction. The user has then the option of requesting a downloadable text file that contains allelic states for a set of stocks for a certain range of genomic coordinates. If the user instead choose to deploy SNPversity’s web-based visualization feature, then after the ‘Submit’ button is clicked, SNPversity starts interacting one more time with TASSEL libraries to extract a set polymorphic data, which is stored in the HDF5 format, based on selected stocks and coordinates, and create output files in JSON format. The output files are then digested by the visualization layer to create a colorful, and interactive display showing SNPs in grids where SNP positions and stocks form rows and columns respectively. The colors represent and differentiate major and minor allelic differences: green—major allele, orange—minor allele, red—insertion, aqua—deletion, and grey—unknown value.
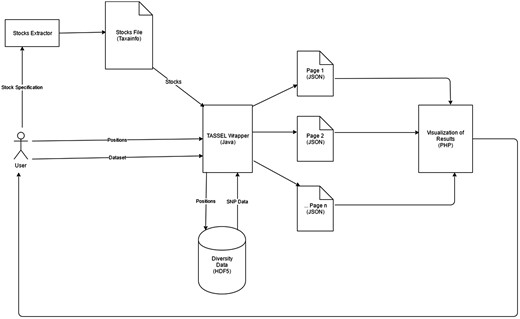
High level workflow and technical overview of SNPversity components. Users interact with the drop-down menus and enter their choices through the SNPversity home page. The necessary data, such as stocks information are pulled and feed into a TASSEL-based wrapper. The wrapper first queries diversity data stored in the HDF5 representation. The wrapper then creates appropriate JSON files for the PHP layer to visualize the data online.
Description of selections and features on the SNPversity homepage
The form of the homepage shown in Figure 2 contains many inputs for the customization of queries. These are explained below:
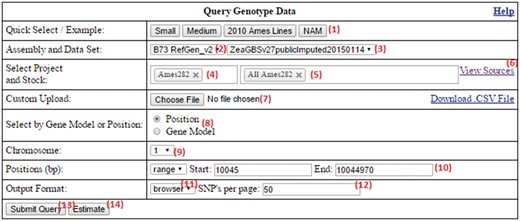
The SNPversity homepage form at MaizeGDB. The homepage contains many data and visualization options that allow the user to reach the right data sets and display the desired information in the desired formats. Please see text for additional details.
Example queries that populate the form can be run by pressing the buttons in the beginning of the row. Sample data entries are provided (e.g. small, medium, 2010 Ames Lines, NAM) as a way of showing the capabilities and visualization options available to the user.
Selection of desired assembly/reference genome. Depending on selection, this will update the fields (3–5). Maize has a fully assembled reference genome (B73 stock), and different assembly versions are available. SNPversity can also work with species without a reference genome.
Selection of desired data set.
Selection of projects. This will populate (5) if a project selected. If there are no projects, this field will be hidden.
Selection of stocks. When the user starts typing, stock names with the exact match of the typed string will dynamically appear to help the user choose the desired stocks and a set of stocks.
View sources. Clicking this displays a pop-up box (i.e. a modal window) to navigate through the stock file sources that are used to populate the project/stock fields (4, 5). A subset of this source file can also be submitted to (7).
Custom upload. This fields accepts files with customized extension and formats (.taxainfo, .stockinfo, .csv). The files with taxainfo or stockinfo extensions are SNPversity-specific files describing individual lines. In contrast, the files with the csv extension allow the user to pin down projects and stocks (or just stocks, which degenerates into the taxainfo format). An example csv file can be found on the same row under the ‘Download .CSV File’ link. An example taxainfo file can be downloaded in (6). Any stocks selected in (5) will be merged with the stocks in this file.
Select by gene model/position. This allows the user to select the range of chromosome plus base pair positions of the genome to be specified manually, or by entering the gene model. Currently, only the first transcripts (ending in _T01) are accepted for the maize assembly. When implementing at another biological database, this part of the code needs to be modified according to how transcripts are represented for specific genome annotations.
Chromosome. Select the chromosome of reference genome.
Positions. Select base pair (bp) positions of the selected chromosome.
Output format. Select desired output format. Options are .hapmap, .vcf, or in the browser (generated JSON file).
Number of SNPs to display per page. This is to allow users to have control over the size of the results page to be displayed. This can become very large or even cause the browser to crash, especially if a lot of stocks are selected.
Submit query. This submits all the entered information in the form.
Time estimation. This looks at the already entered information and gives the user a time estimate of his/her current query processing time.
If the visualization option is selected for the ‘Small’ example data set, then submitting the query will display the results page shown in Figure 3. The output page that has several features:
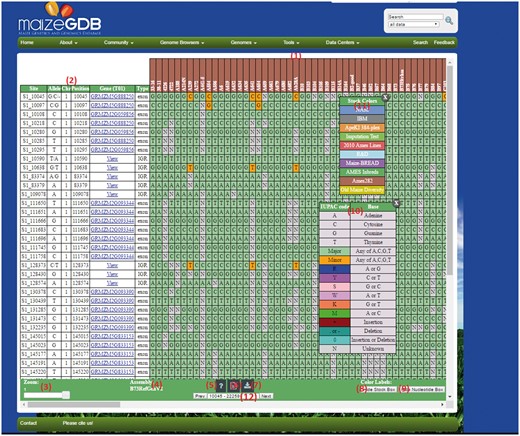
An example SNPversity output page. The output page is designed with contrasting colors to facilitate an intuitive understanding of SNP characteristics and differences. The output shows when ‘Medium’ quick example is selected. The colors represent and differentiate major and minor allelic differences: green—major allele, orange—minor allele, red—insertion, aqua—deletion, and grey—unknown value. Please see text for further details.
Stocks selected. Each column is represents a stock.
Results table. The colored cells represent SNP data, whereas the first six columns give information such as genomic position and any found gene models.
Zoom function. This allows the user to zoom in/out of the results table to customize viewing experience. This option is not fully functioning in Firefox.
Assembly version. Shows the selected assembly version.
Help. Clicking this button will display a pop-up window with help documentation.
Download .taxainfo file. This will download all selected stocks into a TASSEL-compliant file ready for re-use by the ‘Custom File Upload’ input field.
Export as CSV. Clicking this button will download the currently visible page into a CSV file.
Show Stock Box. This will open up the stock box (11).
Show Nucleotide Box. This will open up nucleotide box (10).
Nucleotide box. This is a draggable, sticky table that explains the color-coding used to label the SNP data.
Stock box. This is a draggable, sticky table that explains the color-coding of Stock columns (only if B73 RefGen_v2).
Page Selection. This drop-down box allows the user to navigate to different subsection of the results by page. All content is loaded automatically after a user selects it.
SNPversity step-by-step instructions
We have created a step-by-step document that explains how to (i) Select desired assembly and data set; (ii) Select project(s) and stock(s); (iii) Submit stocks via custom file upload; (iv) Specify genomic range by exact position; (v) Specify genomic range by Gene Model; (vi) Select output format and SNP’s per page; (vii) Estimate query time; and (viii) Submit the query. The document includes screenshots, short videos, and descriptions for each step. A link to the document can be found under HELP | About on the SNPversity page. The step-by-step protocol is also provided as a Supplementary Material.
Time estimation of queries
While entering a query, a user may wish to find out how long a query would take to run. For this purpose, an ‘Estimated Query Time’ button is provided, which displays a time estimate of the user’s intended query on the top-right corner of the screen based on the pre-calculated times. We provide the details of these pre-calculations below. On the web interface, the display notification is color-coded for the users according to the following specification: 0–4 min, Green; 5–9 min, Yellow; and >10 min: Red. Up to five notifications are displayed persistently (if comparison of different queries is desired).
In order to calculate time estimation of queries, we collected processing times for different number of stocks with varying coordinate ranges. For each query, we recorded one data-point containing stocks, range of positions within a data set, and the time it took to run the query. Then we fitted two regression models, k-nearest neighbor (KNN) and multivariable regressions, with leave-one-out cross-validation (LOOCV), and predicted the query time for the remaining point. Our results summarizing the performance of our time prediction models, including mean absolute error of actual versus predicted time values can be found below in Table 3. Our results show that the estimated times can be highly variable depending on the data set, and the performance of different regression models strongly depend on the data set as well.
SNPversity’s query time for representative cases using k-nearest neighbor algorithm (KNN) and multivariable regressions
| Data set | # Datapoints | Mean query times | Standard deviation of query times | KNN error | Multivariable error |
|---|---|---|---|---|---|
| Maize ZeaGBS v2.7 (raw) | 14 | 81 | 68 | 23 | 31 |
| Maize ZeaGBS v2.7 (imputed) | 244 | 46 | 59 | 19 | 28 |
| Data set | # Datapoints | Mean query times | Standard deviation of query times | KNN error | Multivariable error |
|---|---|---|---|---|---|
| Maize ZeaGBS v2.7 (raw) | 14 | 81 | 68 | 23 | 31 |
| Maize ZeaGBS v2.7 (imputed) | 244 | 46 | 59 | 19 | 28 |
Actual mean and standard deviation of query times for specific data sets are provided in the first four columns. The last two rows results show the mean absolute error between predicted and actual times and are calculated based on the leave-one-out cross-validated (LOOCV) results using KNN and multivariable regression algorithms respectively. Times are expressed in rounded values in seconds. Please see text for further details.
In order to improve SNPversity performance continuously, we created a monitoring system in place that records processing speeds along with the specific user queries. As more queries are executed on SNPversity, we will be continuously collecting these data points and harnessing them to periodically update and improve the prediction models to estimate query processing time.
Conclusions
Sequencing technologies combined with powerful assembly algorithms enable identification of allelic differences in the genomic context more accurately and rapidly, creating new challenges in storing, managing, accessing, and visualizing the data in an integrated fashion. Online databases are where multiple types of data are stored and linked through web interfaces. Although displaying data points in a tabular format allows fast data retrieval and rendering, graphical representations provide quicker interpretation of information.
When it comes to displaying SNP diversity, several powerful desktop software applications already exist, most notably TASSEL (6) and Flapjack (7), but stand-alone web-based visualization tools that can be easily implemented at web-based biological databases are not common, and SNPs are usually displayed through genome browsers such as JBrowse (3) or Ensembl genome browser (4). Consequently, their display capabilities are limited and not specialized. The stand-alone SNPversity software suite was developed at MaizeGDB to respond to the bottleneck for displaying allelic diversity through a web-interface with features that allow comparison of diversity across multiple stocks.
SNPversity uses a simple and intuitive interface, and can powerfully display large data sets in a matter of seconds. The tool can be easily implemented at any biological database as it is open source and its code can be downloaded from github and easily customized.
SNPversity provides the user the ability to choose from multiple stocks for a range of genomic coordinates of a reference genome (e.g. B73 for maize). The output is projected on a web browser as a table, with each row displaying a single SNP location, and each column representing a distinct stock. Each square intersecting a SNP location and a stock is then colored according to the allelic status of that SNP, major or minor, and, in the absence of the allelic status, the square is colored according to the nucleotide.
In conclusion, SNPversity is designed to be portable to other biological databases. Its code and documentation are free, downloadable, and customizable. In addition to MaizeGDB, the portability of SNPversity is being tested for implementation on GrainGenes, a centralized data resource and community service for small grains, reducing implementation hurdles to adapt SNPversity and facilitate its adoption by other biological databases.
Availability of data and material
The SNPversity tool can be accessed at MaizeGDB at this link (22). The code and documentation can be accessed at GitHub (23).
Funding
This work was supported by United States Department of Agriculture-Agricultural Research Service by funding salaries and open access charges. The funding agency played no role in in the design of the study and collection, analysis, and interpretation of data and in writing the manuscript.
Supplementary data
Supplementary data are available at Database Online.
Acknowledgements
We thank Jack Gardiner for his insightful suggestions for the manuscript and Ed Buckler and Terry Casstevens for their valuable input during the creation of SNPversity. USDA is an equal opportunity provider and employer.
Conflict of interest. None declared.
References
scikit-learn http://scikit-learn.org (5 September, last date accessed).
Author notes
Citation details: Schott,D.A., Vinnakota,A.G., Portwood II,J.L. et al. SNPversity: a web-based tool for visualizing diversity. Database (2018) Vol. 2018: article ID bay037; doi:10.1093/database/bay037
