


Abstract
Public health laboratories are currently moving to whole-genome sequence (WGS)-based analyses, and require the rapid prediction of standard reference laboratory methods based solely on genomic data. Currently, these predictive genomics tasks rely on workflows that chain together multiple programs for the requisite analyses. While useful, these systems do not store the analyses in a genome-centric way, meaning the same analyses are often re-computed for the same genomes. To solve this problem, we created Spfy, a platform that rapidly performs the common reference laboratory tests, uses a graph database to store and retrieve the results from the computational workflows and links data to individual genomes using standardized ontologies. The Spfy platform facilitates rapid phenotype identification, as well as the efficient storage and downstream comparative analysis of tens of thousands of genome sequences. Though generally applicable to bacterial genome sequences, Spfy currently contains 10 243 Escherichia coli genomes, for which in-silico serotype and Shiga-toxin subtype, as well as the presence of known virulence factors and antimicrobial resistance determinants have been computed. Additionally, the presence/absence of the entire E. coli pan-genome was computed and linked to each genome. Owing to its database of diverse pre-computed results, and the ability to easily incorporate user data, Spfy facilitates hypothesis testing in fields ranging from population genomics to epidemiology, while mitigating the re-computation of analyses. The graph approach of Spfy is flexible, and can accommodate new analysis software modules as they are developed, easily linking new results to those already stored. Spfy provides a database and analyses approach for E. coli that is able to match the rapid accumulation of WGS data in public databases.
Introduction
Whole-genome sequencing (WGS) can provide the entire genetic content of an organism. This unparalleled resolution and sensitivity has recently transformed public health surveillance and outbreak response (1, 2). Additionally, the identification of novel disease mechanisms (3, 4) and rapid clinical diagnoses and reference laboratory tests are now possible (5, 6).
The rapid characterization based on WGS relies on the outputs from multiple software programs that are targeted for specific applications. Examples include the identification of known antimicrobial resistance (AMR) genes, through software programs such as the Resistance Gene Identifier (RGI) (7), ResFinder (8), Antibiotic Resistance Gene-Annotation (ARG-ANNOT) (9) and Antimicrobial Resistance Identification By Assembly (ARIBA) (10); or the identification of known virulence factor (VF) genes through software programs such as VirulenceFinder (8), SRST2 (11), and GeneSippr (12).
For subtyping in clinical diagnoses and reference laboratory environments, software programs rely on pre-selected intraspecies genes or genomic regions, which are targeted through software programs such as Phylotyper (13), SerotypeFinder (14), the EcOH dataset applied through SRST2 (15) and V-Typer (16). These methods represent in-silico analogues of traditional wet-laboratory tests, which allow new whole-genome sequences to be viewed in the context of historical tests without the need for the time and labor of the traditional wet-laboratory tests.
Comprehensive platforms that combine individual analyses programs into a cohesive whole also exist. These include free platforms such as the Bacterium Analysis Pipeline (BAP) (17) and the Pathosystems Resource Integration Center (PATRIC) (18). Commercial applications, such as Bionumerics, which is used by PulseNet International for the analyses of WGS data in outbreak situations also exist and offer support as well as accredited, standardized tests (19). These platforms are designed to be applied to individual projects.
Many of the analyses used in the characterization and study of bacterial genomes, such as serotyping, VF and AMR identification, are broadly useful, and therefore they are often computed multiple times for the same genome across different studies. An effective method to mitigate this re-computation is to make the storage and retrieval of results part of the analyses platform and effectively link to the genomes of interest through a standardized ontology. Downstream studies, such as population comparisons, can be performed on existing results without re-computation. Such measures help ensure the rapid response times required for public health applications and allow results to be integrated and progressively updated as new data becomes available.
We have previously developed Superphy (20), an online predictive genomics platform targeting E. coli. Superphy integrates pre-computed results with domain-specific knowledge to provide real-time exploration of publicly available genomes. While this tool has been useful for the thousands of pre-computed genomes in its database, the current pace of genome sequencing requires real-time predictive genomic analyses of tens-of-thousands, and soon hundreds-of-thousands of genomes, and the long-term storage and referencing of these results, which the original SuperPhy platform was incapable of.
Here, we present a new platform merging the pre-computed results of SuperPhy, with a novel data storage and processing architecture, which we call Spfy; Spfy integrates a graph database with real-time analyses to avoid re-computing identical results. Additionally, graph-based result storage allows retrospective comparisons across stored results as more genomes are sequenced or populations change. Spfy is flexible, accommodating new analysis modules as they are developed. The database is available at https://lfz.corefacility.ca/superphy/spfy/.
Functionality
Spfy provides rapid in-silico versions of common reference laboratory tests for the analyses of E. coli. It supports the following in-silico subtyping options: serotyping, through both O- and H-antigen identification using ECTyper (https://github.com/phac-nml/ecoli_serotyping) as well as VF gene determination; Shiga-toxin 1 (Stx1), Shiga-toxin 2 (Stx2) and Intimin typing using Phylotyper (13); and AMR annotation using the RGI from the comprehensive antibiotic resistance database (7). An example of the VF results is given in Figure 1. Spfy reports the corresponding percent identity used in each analysis, or in the case of Stx1, Stx2 and Intimin, a generalized probability of a result. Spfy also performs pan-genome analyses using Panseq (21), with the entire pan-genome stored in the database and associated with source genomes.
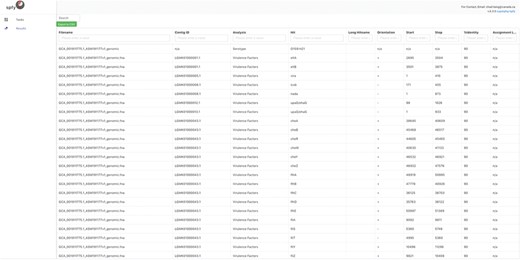
Detailed results for the serotyping and virulence factor subtyping task. While data storage in Spfy is graph-based, a familiar tabular structure is presented to users. The genome file, GCA 001911825.1 ASM191182v1 genome.fna, was analyzed with the determined serotype associated with the file and virulence factors associated with the contigouous DNA sequences they were found on. The Start/Stop positions on the contig., are provided along with the Percent Identity (Cutoff) used in the analysis.
No account creation is required to use the platform. A sharable token is automatically created for users upon entering the website and is embedded into the website address. Users can share results by copying their URL, and files submitted from different computers using the same token will be visible to anyone with the same link. We recommend using the Chrome web browser to access Spfy; the website was also tested with Firefox, Safari and Edge.
Spfy handles all of the analyses tasks by dividing them into subtasks, which are subsequently distributed across a built-in task queue. Results are converted into individual graphs and stored within a larger graph database according to the previously created ontologies the Genomic Epidemiology Ontology (GenEpiO) (22), the Feature Annotation Location Description Ontology (FALDO) (23) and the Microbial Typing Ontology (TypOn) (24), which includes metadata for genotypes, location, biomarkers, host and source, among others.
By integrating task distribution with graph storage, Spfy enables large-scale analyses, such as epidemiological association studies. Any data type or relation in the graph is a valid option for analysis. This means that genomes can be compared on the basis of the presence or absence of pan-genome regions, serotype, subtyping data or provided metadata such as location or host source. All results are displayed to users in real-time, usually within 2–3 minutes. For example, Spfy can determine if a statistically significant difference exists, using Fisher’s exact test, among any identified AMR genes, between E. coli genomes of serotype O157 and genomes of serotype O26, as shown in Figure 2. This feature is available through the ‘statistical comparisons’ task on the website. Different types can also be joined into a group through logical connectives AND, OR or negation. This approach can be used to compare any data regardless of source software.
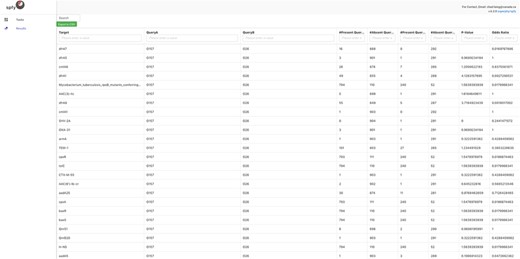
E. coli genomes of serotype O157 (904 genomes) compared against genome of serotype O26 (292 genomes) for statistically significant differences in the carriage of 129 AMR genes. Fisher’s Exact Test is used by Spfy for these comparisons.
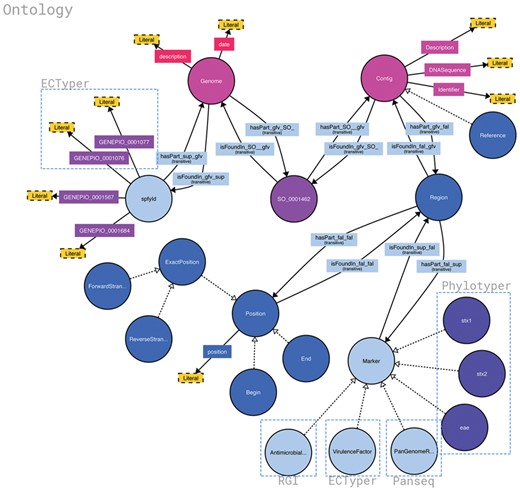
Structure of the Spfy graph database. Brackets highlight the source of different data points and the software it was generated from. Data are added in as the analysis modules complete, at varying times, and the overall connections are inferred by the database. Non-bracketed sections are sourced from the uploaded genome files or user-supplied metadata. Figure was generated using http://www.visualdataweb.de/webvowl/.
Implementation
The server-side code for Spfy, graph generation and analysis modules were developed in Python, with the front-end website developed using the React JavaScript library (https://facebook.github.io/react/). When new data is added to the database, the following steps are taken:
(i) The upload begins through the website, where user-defined analyses options are selected. The results of these analyses are immediately reported to the user, while all other non-selected analyses are subsequently completed in the background and stored in the database without interaction from the user. The public web service accepts uploads of up to 200 MB (∼50 E. coli genomes uncompressed, or 120 genomes compressed) at a time, though an unlimited amount of data can be submitted to a local instance.
(ii) User-selected analyses are enqueued with the Redis Queue (http://python-rq.org/) task queue. Redis Queue consists of a Redis Database (https://redis.io/) and task queue workers which run as Python processes.
(iii) The workers dequeue the analyses, run them in parallel and temporarily store results in the Redis database.
(iv) Python functions parse the results and permanently store them in Blazegraph (https://www.blazegraph.com/), the graph database used for Spfy.
Data storage
Semantic web technologies describe the relationships between data and have been proposed as an open standard for sharing public information (25), while graph databases are a flexible means of storing this information (26). Biological data can be a genome, contiguous DNA sequence or gene, and these are linked together in a searchable graph structure using existing ontologies. This system is flexible and allows novel data to be incorporated into the existing graph.
The permanent storage of results is as a one-time cost, which avoids re-computation when the same analysis is re-run. During analyses, Spfy searches the graph for all data points annotated with the queried ontology term. This graph data is then converted into the required structure, usually numerical arrays, for the given analysis module.
In a graph database, a search can begin at any node or attribute. This is in contrast to an Structured Query Language (SQL) database, which requires a predefined schema, or a NoSQL database, which treats data as documents with varying structure. For example, the addition of a new analysis module would typically require a new table definition in an SQL database or the addition of a new document type in a NoSQL database. With a graph database, new nodes or attributes are added and then connected to existing data, removing the need for explicit joins or data conversions. Currently, all data associated with the analyses pipelines (subtyping, pangenome etc) are stored in the database. The graph database was designed to store required data in an efficient manner. For example, Spfy does not store redundant entries; there is only one instance of any given AMR or VF gene represented as a node in the database. The platform will create a new edge between additional genome isolates and existing AMR/VF nodes. Additionally, data can be added to Spfy in parts, and the database will infer the correct connections between the data.
Spfy primarily uses Blazegraph (https://github.com/blazegraph/database) for storage along with MongoDB to cache a hash table for duplicate checking. The cache allows Spfy to more efficiently check for duplicate files in Blazegraph than would be possible through a search of the graph structure. MongoDB is also used to support the synchronized user sessions feature of the website.
Web design
The front-end website is written as a single-page application. To ensure a familiar user interface, we followed the Material Design specification (https://material.io/), published by Google, built around a card-based design (Figure 4). Both the task selection and result displays follow the same design pattern, where data storage is graph-based, but the results of analysis modules are presented to users in a familiar tabular structure and available for download as .csv spreadsheet files.
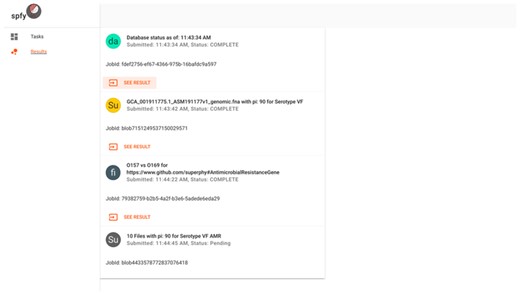
The results interface for submitted tasks. Cards represent individual tasks submitted by the user, such as checking the database status, subtyping of single genomes, population comparisons or subtyping of multiple genomes.
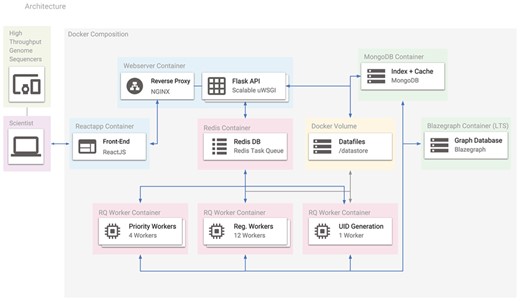
The Docker containers used in Spfy. Arrows represent the connections between different containers, and the entire platform can be recreated with a single command using its Docker-Compose definition. Users access the platform using the ReactJS-based website, which makes requests to the Flask API. Any requested analysis task is distributed to the Redis Task Queue and data files are stored in a Docker volume. MongoDB stores a hash table for efficient duplicate checking of results in Blazegraph.
Service virtualization
Docker (https://www.docker.com/) is a virtualization technology to simulate self-contained operating systems on the same host computer, without the overhead of full hardware virtualization (27). The Spfy platform depends on a series of webservers, databases and task workers, and uses Docker to compartmentalize these services, which are then networked together using Docker-Compose (https://docs.docker.com/compose/) (see Figure 5). Docker integration ensures that software dependencies, which are typically manually installed (28, 21, 11, 29), are instead handled automatically.
One of the key benefits of using common-place technologies is the compatibility with other infrastructure resources. Docker containers are widely supported by cloud compu-ting services: Amazon Web Services (https://aws.amazon.com/docker/), Google Cloud Platform (https://cloud.google.com/container-engine/) and Microsoft Azure (https://azure.microsoft.com/en-us/services/container-service/), and self-hosted cloud computing technologies such as OpenStack (https://wiki.openstack.org/wiki/). Spfy packages compute nodes as reproducible Docker containers and allow the platform to easily scale to demand.
Results
Spfy was tested with 10243 public E. coli assembled genomes from Enterobase, storing every sequence and the results for all included analysis modules. These included: serotyping (O-antigen, H-antigen), toxin subtyping (Shiga-toxin 1, Shiga-toxin 2, and Intimin), the identification of VF and AMR determinants and determination of the pan-genome content of E. coli. The resulting database has 17 820 nodes and 3 811 473 leaves, with 1 125 909 074 object properties. Spfy has been up since May 2017. The server accepts assembled E. coli genomes with the .fasta or .fna extensions. Submissions are subjected to quality control checking for at least 3 of 10 E. coli specific sequences in an isolate, to ensure the submitted genomes are of the species E. coli, before subsequent analyses are run. These E. coli specific markers were identified by our group in a previous study (20); briefly, these E. coli specific markers were identified by blast comparisons (90% sequence identity and 90% length) to be exclusive to E. coli, and our validation work showed that three of these markers were sufficient to uniquely identify an E. coli genome while tolerating moderate levels of genome sequence incompleteness.
Spfy runs on a virtual machine (VM) with 8 vCPUs emulating single-core Intel Xeon E3-series processors, and with 32 GB of RAM. The VM is running CentOS version 7.3, with Docker version 17.06.1-ce and Docker-Compose version 1.12.0. On comparison tasks, Spfy can retrieve and compare 1 million nodes/attributes in the graph database in ∼70 seconds. As shown in Figure 6, performance scales linearly with the number of genomes involved in the comparison, or the number of target nodes retrieved per genome; 1.5 million nodes/attributes can be compared in ∼90 seconds and 2 million nodes/attributes in ∼110 seconds.
On analysis tasks, Spfy runs all included analyses modules in an average of 130 seconds per genome. Spfy can also queue batches of genomes for analysis, decreasing the average runtime to an average of 54 seconds per file due to parallelization of analysis runs (Figure 7). In total, the platform analyzed 50 genomes in 45 minutes and 100 genomes in 89 minutes.
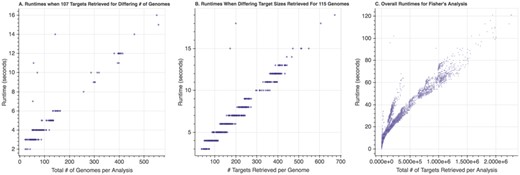
Runtimes of Fisher’s Exact Test depending on the number of nodes/attributes involved in the comparison. (A) Runtimes as the number of genomes increased for a fixed (107) number of targets per genome. (B) Runtimes as the number of targets increased for a fixed (116) number of genomes per target. (C) Overall runtimes as the total number of targets retrieved increased; the total number of targets was calculated as follows: (Number Genomes Group A + Number Genomes Group B) x Number Targets per Genome. In all cases, a linear increase in runtime was observed as the number of targets or genomes increased.
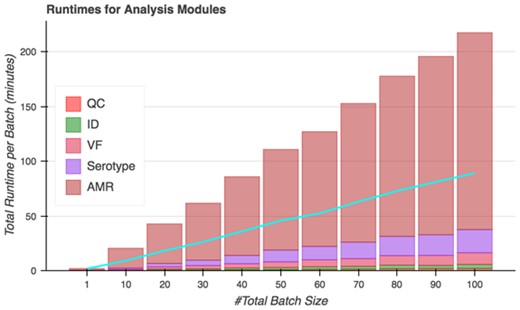
Total runtimes of Spfy’s analysis modules for batches of files. The blue line indicates the actual time to completion after accounting for parallelization; 50 files are analyzed in 45 minutes and 100 files in 89 minutes.
Discussion
Many bioinformatics software programs have been developed ad hoc, with individual researchers and laboratories developing software specific to their environment (30). Such tools were often script-based, with custom data formats and only suitable for small collections of data (30). Recent efforts (31, 17) have focused on providing a common web interface for these programs, while still returning the same result files. However, many subsets of biology now require the analyses of big-data, where inputs are taken from a variety of analysis programs, and involve large-scale data warehousing (32). The ability to integrate data from different source technologies, merge submissions from other laboratories and distribute computations over fault-tolerant systems is now required (32).
One of the key goals in developing Spfy was to accommodate and store a variety of result formats, and then to make the data from these results retrievable and usable as inputs for downstream analyses, such as predictive biomarker discovery.
We have shown how a graph database can accommodate the results from a variety of bioinformatics programs and how Spfy is performant for data retrieval of the results from multiple analyses among over 10 000 genomes. Spfy provides results from big-data comparisons with the same efficiency as old analyses on single files.
Impact on public health efforts
The isolation and characterization of bacterial pathogens are critical for Public Health laboratories to rapidly respond to outbreaks and to effectively monitor known andemerging pathogens through surveillance programs. Until recently, public-health agencies relied on laboratory tests such as serotyping, pulsed-field gel electrophoresis, PCR-based amplification of known VFs and disc-diffusion assays for the characterization of bacterial isolates in outbreak, surveillance and reference laboratory settings (1). Current efforts are focused on predictive genomics, where the relevant phenotypic information can be determined through examination of the whole-genome sequence without need for the traditional laboratory tests.
Comparison of four bioinformatic pipelines and their underlying database. Functionally, Spfy integrates different analysis modules as in BAP while also merging large datasets as in PATRIC
| Spfy | Galaxy | BAP | PATRIC | |
|---|---|---|---|---|
| Database | Blazegraph | PostgreSQL | MySQL + file system | MongoDB + shock |
| Type | Graph | SQL | SQL + file system | NoSQL |
| Focus | Integrated analyses | Workflow technology | Batch analysis | Integrated analysis |
| Spfy | Galaxy | BAP | PATRIC | |
|---|---|---|---|---|
| Database | Blazegraph | PostgreSQL | MySQL + file system | MongoDB + shock |
| Type | Graph | SQL | SQL + file system | NoSQL |
| Focus | Integrated analyses | Workflow technology | Batch analysis | Integrated analysis |
Spfy provides rapid and easy predictive genomic analyses of E. coli genomes while also addressing the problem of large-scale comparisons. With the larger datasets involved in population genomics, it is no longer viable for individual researchers to download data to perform comparisons. Instead, efforts have focused on storing biological data online and enabling analyses of those data (32). By using a graph database, Spfy integrates results from different technologies, as well as laboratory results and user-submitted metadata. In addition, datasets can be built and submitted from multiple laboratories for joint analyses.
Comparison with other bioinformatics pipeline technologies
The automated analysis of WGS is currently facilitated by existing scientific workflow technologies such as Galaxy (31). Galaxy aims to provide a reproducible, computational interface that is accessible to individuals without programming knowledge. Galaxy defines a formal schema for linking different analysis software together, so the entire pipeline can be replicated and also extended as new tools are developed. The Galaxy workflow focuses on running an individual analysis pipeline. It does not include functionality to store and collate analysis results for large-scale comparative studies.
The BAP (17) provides an integrated analysis pipeline for bacterial WGS data as a web service. It provides an individual per-genome report of the determined species, multilocus sequence type and VF and AMR genes (17).
Spfy is similar to these technologies in that it automates workflows for users and uses task queues to distribute selected analyses. On a per file basis, Spfy performs at a similar speed to BAP on predictive genomics tasks, though Spfy does not provide genome assembly services. After accounting for assembly services, BAP reported (17) an average runtime of 8–9 minutes per genome over 476 runs which is in the same scale as Spfy’s average of over 2 minutes. Note, however, that the two platforms are not directly comparable, due to the differences in analysis tasks involved. In similar tasks such as AMR determination, the ResFinder program included in BAP took an average of 3–4 minutes (17) and is similar to the RGI program included in Spfy, which took an average of 1 minute 30 seconds.
However, unlike these workflow managers, Spfy is designed to help solve the re-computation of analyses by storing results in a graph database for downstream comparative studies (Table 1). This allows Spfy to, for example, perform population-wide analyses on varied data from multiple diverse individual software.
PATRIC (18) and Spfy share the same goal of integrated analyses. PATRIC has support for comparing up to nine user-submitted genomes against a reference genome, based on gene annotations; the platform indexes a NoSQL document store to compare similar document types. Unlike PARTIC, Spfy provides the ability to perform statistical comparisons of any permutation of a population group based on the chosen data types, and the graph database of Spfy has no limit on the number of genomes grouped for comparison.
Conclusions
The integrated approach taken in the creation of Spfy, where the analyses, storage and retrieval of results are combined, provides enormous benefits for the large-scale analyses of E. coli. The developed analyses modules are also self-contained and can be used in existing platforms such as Galaxy. Future work will focus on adding machine learning modules to improve genotype/phenotype predictions and supporting bacterial species such as Salmonella and Campylobacter. The source code for Spfy is hosted at https://github.com/superphy/backend, and is available for free under the open-source Apache 2.0 license. A developer guide is provided at https://superphy.readthedocs.io/en/latest/.
Acknowledgements
Spfy is part of a larger multi-year grant at the agency and will be used to provide some newer analysis modules when they are finished.
Funding
Public Health Agency of Canada under the Genomics Research and Development Initiative, Round 6.
Conflict of interest. None declared.
Database URL: https://lfz.corefacility.ca/superphy/spfy/
References
