


Abstract
Habitual consumption of certain foods has shown beneficial and protective effects against multiple chronic diseases. However, it is not clear by which molecular mechanisms they may exert their beneficial effects. Multiple -omic experiments available in public databases have generated gene expression data following the treatment of human cells with different food nutrients and bioactive compounds. Exploration of such data in an integrative manner offers excellent possibilities for gaining insights into the molecular effects of food compounds and bioactive molecules at the cellular level. Here we present NutriGenomeDB, a web-based application that hosts manually curated gene sets defined from gene expression signatures, after differential expression analysis of nutrigenomics experiments performed on human cells available in the Gene Expression Omnibus (GEO) repository. Through its web interface, users can explore gene expression data with interactive visualizations. In addition, external gene signatures can be connected with nutrigenomics gene sets using a gene pattern-matching algorithm. We further demonstrate how the application can capture the primary molecular mechanisms of a drug used to treat hypertension and thus connect its mode of action with hosted food compounds.
Introduction
Nutrigenomics is defined as the science studying the role of nutrients and bioactive food compounds on gene expression. Research in nutrition and food technologies is attracting interest from the scientific community, as reflected by the increasing number of published scientific works related to this field since the last 10 years. There is evidence pointing out that nutrition may exert its impact on health outcomes by directly affecting the expression of genes in critical metabolic pathways. Research from the ‘80s already suggested that diet likely accounted for about 30% of the risk of developing cancer (1). Moreover, diet is considered as one of the main risk factors in the etiology of cardiovascular diseases (CVDs). It is widely accepted that dietary components can regulate cellular processes spanning from gene expression to protein synthesis, but there is a minimal understanding of the underlying molecular mechanisms (2).
The endless increasing number of transcriptomic data generated with high-throughput technologies, which are available in public repositories, has triggered the development of web applications that allow the comparison of gene expression profiles for distinct purposes. The Connectivity Map (CMap) (3) was the first introduction of such a methodology, aiming at connecting small molecules, genes and diseases. Nowadays, their catalogue of cellular signatures representing perturbations with pharmacologic perturbagens keeps growing. NFFinder is another similar application that makes use of transcriptomic data for drug repurposing issues in the context of orphan diseases (4). CREEDS is also an interesting project based on the same principle but focusing on crowdsourcing manual curation of gene signatures instead of one-fits-all automated gene expression analysis (5).
Despite the increasing availability of nutrigenomics experiments in public databases, such data remain underutilized, and therefore the information about modes of action of food compounds and natural products that might explain their observed healthy properties at the cellular level is scarce (6). For instance, the existence of software packages tailored to analyse and mine data generated from nutritional research is almost inexistent, and researchers working in this field are restricted to analyse their experiments individually. Previous computational analysis of food-derived bioactive compounds has allowed the identification of possible biological function or molecular mechanism. For example, molecular docking simulation has been used to evaluate in silico inhibitors of cyclooxygenase 2 (7) and pancreatic lipase (8), or BET bromodomains (9) by natural dietary bioactive compounds. In the context of a whole diet, computational frameworks using gene expression profiles have been used to establish diet-disease associations (10), which could be used for designing future dietary recommendations. Natural products present a high structural heterogeneity and are a rich source of drugs or drug-like lead (11). Although the final products may not necessarily represent the active ingredients of the natural source, a large number of drugs in the market have their origin in nature. Since the effect of a drug treatment on a cell culture can be captured by the triggered gene expression profile, a resource allowing to establish connections among different food compounds, as well as connections between food compounds and drugs available in the market, based on the similarity of their effect on gene expression, would be highly valuable.
Here we present NutriGenomeDB, an easy-to-use web application that allows exploration of differential gene expression profiles from nutrigenomics experiments through data tables and interactive visualizations. The phenotype-centred analysis module allows the comparison of human expression profiles against a curated built-in database of nutrigenomics experiments performed in human cells. The application is freely accessible at http://nutrigenomedb.org.
Materials and Methods
Data collection
Gene expression profiles were identified in the Gene Expression Omnibus (GEO) database (https://www.ncbi.nlm.nih.gov/geo). Queries were conducted with variations of the following search terms: nutrigenomics, nutrient, nutrition, extract, natural product and phytochemical. In general, selected studies were performed on human cellular models, using microarray technology, and the experimental design included at least two replicates per group.
Data processing
Samples were manually assigned to control or treatment condition by inspecting the corresponding experimental design of each study. For data corresponding to Affymetrix platforms, raw data (CEL files) were downloaded and normalized locally with the Robust Multi-array Average algorithm using specific Bioconductor packages. For data generated with other microarray platforms, the normalized matrix was directly downloaded from the source for differential expression analysis. Differential gene expression was assessed using the LIMMA package from Bioconductor R project and setting the treated samples as the target group. Each experiment was characterized by a gene set defined as the top 10% differentially expressed genes, avoiding any filtering steps based on statistical significance. These gene sets were then sorted by the level of differential expression (log2 fold change). Conversion of probes to gene names was performed locally with the ‘annotate’ Bioconductor library.
Web interface
NutriGenomeDB was built using Ruby on Rails framework. Gene differential expression data for each experiment is hosted in a MySQL database. The database can be searched with one or multiple gene symbols in order to get gene expression results among the obtained nutrigenomics gene sets. Interactive tables presenting the results were implemented using DataTables JavaScript and are available for download in either Excel or PDF format.
Two different open source libraries were used to implement interactive visualizations on the gene-centred exploratory module. After interrogating the stored gene sets for a particular set of genes, the available multiline plot visualization, allowing exploration of gene expression levels across nutrigenomics experiments, was implemented using Plotly’s Python graphing library. The expression heatmap functionality, able to cluster nutrigenomics experiments based on the differential expression profile of a set of query genes, was built using the Clustergrammer web-based tool using specific JavaScript and Python libraries (12). For gene signature comparison functionality, the Gene Set Enrichment Analysis algorithm was implemented (13), using the obtained nutrigenomics gene sets as a reference database.
Submitted queries on the phenotype-centred analysis module are identified with a unique job ID and remain stored for later accession on the web server for 1 month. Identified genes connecting the experiments can be used to launch a statistical overrepresentation test of molecular functions via PANTHER database web services.
Results
NutriGenomeDB overview
NutriGenomeDB contains manually curated gene sets defining nutrigenomics experiments available in the GEO database. Based on the selection criteria, a total of 61 nutrigenomics studies were identified in the GEO database. The experimental design of these studies represents 231 differential gene expression experiments (Supplementary Table 1). Therefore, each experiment is defined by a gene set, representing around the top 10% differentially expressed genes sorted by the level of differential expression. Gene sets range from 1500 to 3000 gene features depending on the platform used for gene expression analysis. From a total of 568.463 stored rows in NutriGenomeDB, 156.374 are statistically significant at an adjusted P-value equal or lower than 0.05, corresponding to 27.51% of statistically significant genes among the hosted nutrigenomics gene sets. The gathered data was generated among 19 distinct microarray platforms. NutriGenomeDB is based on two main modules: (i) a data browse module allowing exploration of gene expression data across experiments through interactive visualizations and (ii) a phenotype-centred analysis module allowing the comparison of gene signatures, aimed at finding potential connections among phenotypes and food compounds (Figure 1). The essence of the phenotype-centred analysis module approach is to quantify the similarity of external gene expression signatures characterizing a phenotype in response to a specific treatment (gene expression results from users) and those triggered by food bioactive components available in the literature (GEO), by quantifying such a connection through a gene signature pattern-matching algorithm. Identified connections might be quantified either by the total number of overlapping genes or the calculated net enrichment score (NES). This score is obtained by walking down the introduced list of genes, ranked by their level of differential expression, increasing a running-sum statistic when a gene belongs to the nutrigenomics gene set and decreasing it when the gene does not (13). Such an increase in the running sum is proportional to the rank metric for that gene, so the contribution of highly over- and underexpressed genes will be more important. The enrichment score is the maximum deviation from zero encountered during that walk. NES is the corresponding adjusted enrichment score, which accounts for differences in the gene set sizes included in NutriGenomeDB. A highly positive NES means that overlapping genes between the query and reference gene signatures are mainly found on the top of both lists (highly overexpressed in both cases), and vice versa for a negative NES.
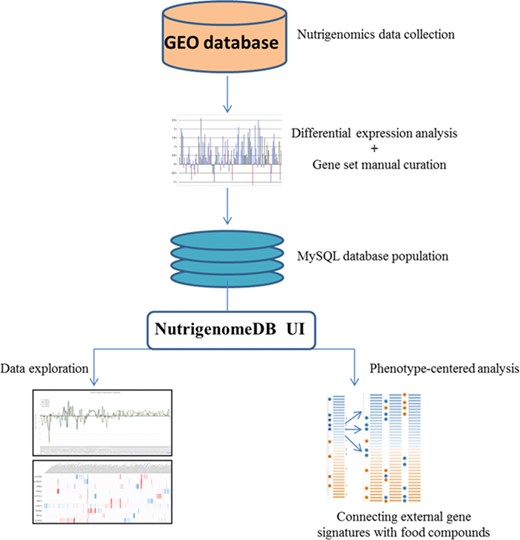
Framework of the methodology for setting up NutriGenomeDB web application. Following identification of studies related to nutrigenomics at the cellular level, experiments were analyzed for gene differential expression. Manually curated gene sets defining each experiment with specific foods and bioactive compound were defined and stored in a MySQL database. The web application interface allows performing exploratory analysis of those data through interactive visualizations. An analysis module allows connecting external gene signatures with food compounds using a gene pattern-matching algorithm.
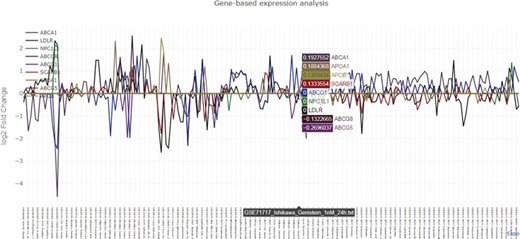
Graphical output of the nutrigenomics gene expression exploratory module. The query is composed of 12 key genes involved in cholesterol metabolism (ABCA1, ABCG1, ABCG5, ABCG8, NPC1L1, APOB, APOA1, LDLR, NPC1L1, APOA1, NR1H1, SCARB1). The obtained line plot is interactive and allows visual identification of co-expression patterns. In this example, treatment of Ishikawa cells with 100 nM of genistein for 24 h triggers the upregulation of LDLR and SCARB1 and the downregulation of ABCA1 and ABCG5.
Exploring nutrigenomics gene expression
The exploratory module requires at least one human gene symbol as input. NutriGenomeDB outputs an interactive data table which includes gene differential expression information, such as the calculated log2 fold change together with statistical data, and summary information about the source experiment, such as the tested food compound and additional experimental design data. Each experiment is linked to the source data through their GEO’s ID. The data table is sortable and can be filtered by searching specific food compounds/nutrients, GEO’s ID or any other experimental data. The presented results only show the experiments where the queried genes appear in the gene set defining the analyzed nutrigenomics experiments. An interactive line plot can be generated using the queried genes and can be downloaded as a PNG image (Figure 2). As nutrigenomics gene sets were defined by the top 10% differentially expressed genes sorted by their level of differential expression, genes that are not included in all the nutrigenomics gene sets show a log2 fold change value of 0 in those where they are absent.
Connecting external gene signatures with food compounds
This module is aimed at identifying connections between nutrigenomics experiments and introduced gene expression signatures characterizing specific phenotypes. The idea behind this approach is that food compounds and nutrients may exert their potential health benefits by acting on the same molecular targets that drugs used for treating diseases do. The introduced data must contain gene symbols and quantitative log2 fold change expression information. It is compared against the gene sets included in NutriGenomeDB by gene pattern-matching. Results are presented as a data table informing about matched nutrigenomics experiments, the number of overlapping genes between the introduced query and experiments hosted in the database, and information about whether those overlapping genes are mostly up- or downregulated [normalized enrichment score (NES) column]. In order to get insights into the molecular mechanisms underlying the identified connections, a molecular function enrichment analysis of those genes connecting both experiments can be launched from the user interface.
To illustrate the utility of this analysis module, we decided to use a gene signature triggered by amlodipine, a drug used to treat high blood pressure. An experiment testing the effect of amlodipine on the gene expression of human umbilical vein endothelial cells (HUVECs) was found and downloaded for analysis (GEO ID: GSE42808). From the list of differentially expressed genes sorted by statistical significance, the first 1000 features were used to query the NutriGenomeDB analysis tool.
The results table highlights connections between the query gene signature and nutrigenomics experiments performed with compounds such as englerin A, a rosemary extract, and trans-10,cis-12 conjugated linoleic acid. The table was sorted by the strongest negative connection level (NES score), in order to obtain connections with compounds mostly leading to downregulation of genes similar to the amlodipine drug profile (Figure 3).
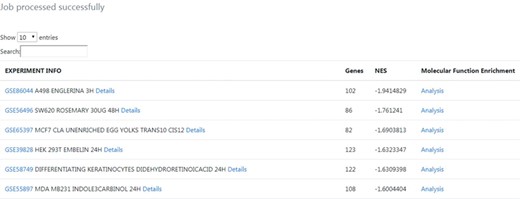
Output results from the phenotype-centred analysis module. A list of nutrigenomics experiments connected with the introduced gene signature is obtained. It included information about the number of overlapping genes (Genes), the NES and experimental information directly linked to the source data. For each connection, details about the expression level and statistics of the overlapping genes between gene signatures can be inspected by clicking on the ‘Details’ link. A molecular function enrichment analysis of the overlapping genes can be launched by clicking on the ‘Analysis’ link.
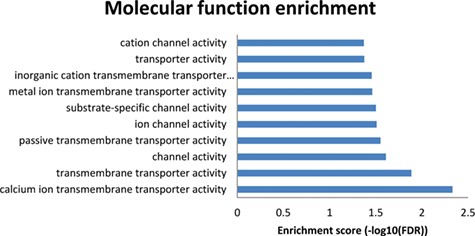
Results from the enriched molecular functions obtained from the NutriGenomeDB phenotype-centred analysis module. The presented bar chart includes the overrepresented molecular functions with statistical significance (FDR < 0.05).
To get further insights into the molecular mechanisms explaining these results, a molecular function enrichment analysis was performed from the results page (‘Analysis’ button on the right of each row). Thus, the overlapping genes between the introduced gene expression profile and the nutrigenomics gene sets were used as input data. Even though the first experiment on the results list (GSE86044 englerin A treatment for 3 h on A498 cells) did not show any overrepresented molecular function with statistical significance, the results from the 86 overlapping genes of the second experiment (GSE56496) performed with a rosemary extract were promising (Figure 4). The enriched molecular functions showing statistical significance are tightly related to transmembrane transporter activities of calcium ions. Indeed, these results are in good agreement with the molecular mechanism of amlodipine drug, which acts as a calcium channel blocker (https://pubchem.ncbi.nlm.nih.gov/compound/Amlodipine).
This analysis module also allows users to inspect the gene expression profile of genes connecting the experiments by clicking on the ‘Details’ link. As expected, among the genes related to transmembrane-transported activities as molecular functions, some of them were downregulated together in the amlodipine gene signature and the Rosemary extract gene set (Table 1).
Genes commonly downregulated between the query gene signature and connected nutrigenomics experiment (GSE56496)
| Gene symbol | log2FC amlodipine | log2FC GSE56496 rosemary 30 μg 48 h | Description |
|---|---|---|---|
| TRPV2 | −1.327098208 | −0.674827345 | Transient receptor potential cation channel subfamily V member 2 |
| ATP2C2 | −1.413693464 | −1.119488698 | ATPase secretory pathway Ca2+ transporting 2 |
| GRIK2 | −1.329016735 | −1.027980433 | Glutamate ionotropic receptor kainate type subunit 2 |
| SORCS3 | −2.566320697 | −3.12378339 | Sortilin-related VPS10 domain containing receptor 3 |
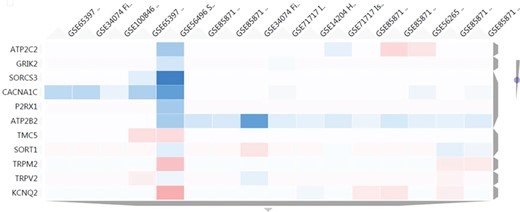
Heatmap results using as input a set of 11 genes related to transmembrane transporter activities. The figure shows a cluster of 16 nutrigenomics experiments based on the expression level of those genes (blue colour represents underexpression, vice versa for red colour). ATP2B2 shows a consistent downregulation among 11 of the clustered experiments.
With the aim of finding in NutriGenomeDB additional food compounds able to modulate the identified genes related to transmembrane transporter activities, the heatmap tool from the gene exploratory module was used. We used as input a list of 11 genes identified with such a molecular function. Thus, we were able to identify a cluster comprising 16 different experiments which modulated at least one of those genes. Interestingly, the ATPase secretory pathway Ca2+ transporting 2 gene (ATP2B2) was consistently downregulated in 11 out of the 16 clustered experiments, with an important downregulation in the experiment GSE34074, corresponding to a treatment using 100 μM of genistein in fibroblasts for 24 h (Figure 5). Interestingly, several animal model studies support genistein’s potential as an anti-hypertensive agent (14–16). However, clinical trials for genistein are very limited, and those for soy isoflavones do not support their contribution to the lowering of blood pressure in humans (17, 18).
Discussion
Since the first introduction of the CMap principle and methodology (3), there have been numerous applications of this approach by many research groups. However, the focus has been mostly limited to drug discovery and repurposing issues. Also, existing tools that automatically compute gene signatures from the GEO database in a high-throughput manner (19, 20) have demonstrated to be error-prone because of the automatic assignment of control and perturbation samples, together with automatic signature generation and annotation. Thus, a database with manually curated gene signatures extracted from nutrigenomics experiments appears to be reliable and highly valuable for the research community.
We have demonstrated, through a benchmark analysis of the gene signature caused by the amlodipine drug on human cells, that our application can capture the main molecular mechanisms responsible for the drug mode of action and to further link these data with food compounds able to trigger those molecular mechanisms. By comparing both gene signatures, we found that an experiment performed using a Rosemary extract obtained from the GEO database (GSE56496) is closely related to the molecular effect of amlodipine. Indeed, there are numerous references in the scientific literature about the benefits of rosemary for the treatment of hypertension (21–23). Interestingly, following a heatmap analysis of the connecting genes that are involved in transmembrane transporter activities, we found a cluster comprising food compounds such as genistein, which has demonstrated strong hypotensive effects (24). Therefore, the newly defined and manually curated nutrigenomics gene sets are able to capture similarities in the compound mode of action rather than similarities of the experimental settings. Thus, we believe that the NutriGenomeDB tool can be helpful to generate a new research hypothesis with the aim of contributing to the field of precision nutrition, improving future functional food formulations, and further investigate the molecular mechanisms that confer healthy properties to specific dietary components.
The biological effects of nutrients and food bioactives derived from diet depend on physiological processes such as absorption, transportation, binding to the cell’s nuclear receptors and excretion. Therefore, the comprehensive identification of bioactive compounds from food components that are responsible for the observed health benefits, through analytical techniques, is a critical step in order to improve the bioavailability of molecules and thus to benefit from their healthy properties. NutriGenomeDB hosts experiments that might not seem obvious from a nutritional point of view, such as the study GSE74212, which investigates the effect of the ascidian natural product eusynstyelamide B, a novel topoisomerase II poison that induces DNA damage and growth arrest in prostate and breast cancer cells. However, at appropriate concentrations, such a natural product could have potential applications for functional foods with protective effects. Indeed, sea squirts are eaten by humans in many parts of the world, including Japan, Korea, Chile and Europe.
The aim of NutriGenomeDB is to become a central hub of nutrigenomics data and to remain on constant development, continuously adding newly generated datasets and features to increase the connectivity power.
Previous studies on drug repositioning using computational approaches have revolutionized the discovery of new uses for existing drugs (25). This has led to the development of several computational tools (26, 27), some of which uses transcriptomic data (28) or even adverse reaction database (29), among others. However, the use of computational approaches for food bioactive, nutritional or nutrigenomics studies is scarce. Perhaps one of the aspects that prevent comparative analysis of food bioactive transcriptomic effects is the lack of standardization of nutrigenomics data in a meaningful way to be reusable. This highlights the need for using minimum information about a bioactive entity (30) as those now used by the pharmaceutical industry. As diet is a major player for maintaining health and preventing disease, the use of system biology approaches not only will open up new opportunities to decipher the health-promoting properties of foods but also may provide new opportunities towards personalization of nutrition (31). Indeed, in a recent study using publicly available gene expression profiles for foods, disease and drugs, Zheng and colleagues provided a diet–disease association using system-level interactomics analysis and network-based inference to provide dietary recommendations.
The lack of similar nutritional systems biology approach in the context of food bioactive compounds prompted us to develop this manually curated database resource. Previous studies by our group described the analysis of a large amount of transcriptomic data and its curation (6), which is the basis for this web application. To the best of our knowledge, this is the first of its kind in the field of nutritional genomics, but because of the relevance of system biology in nutritional sciences (10), we envision the development of other applications.
Concluding Remarks
Diet is a major player of health and disease, and their cellular response at transcriptomic levels may provide important clues for understanding their molecular mode of action. The increasing number of large-scale public gene expression data (transcriptomic) and experiments on dietary food bioactive compounds provide a unique opportunity to interrogate molecules with a similar biological response at the gene expression level. In this context, NutriGenomeDB, a manually curated web-based application of nutrigenomics experiments, provides a unique tool to the nutritional field for identifying mechanistic similarities in the mode of action of food bioactive compounds and other bioactive molecules. The essence of NutriGenomeDB is to quantify the similarity of gene expression signatures between an external gene signature (users query) and those of food bioactive components available in the literature (GEO). This database could be useful for both the nutrition and pharmaceutical industry to search for molecules that share the same molecular effects at the gene level. NutriGenomeDB can be easily extended to include various organisms and incorporate novel GEO transcriptomic data. Understanding the biological effects at gene expression levels of food bioactive components not only provides a platform for searching bioactive molecules with similar biological effects but also may provide novel predictive tools for the development of functional foods and personalization of diet.
Author Contributions
R.M.-H. and A.D. designed the study. R.M.-H. performed the study and analyzed the data. R.M.-H. and A.D. wrote the main manuscript text. All authors reviewed the manuscript.
Funding
Fundación Ramón Areces (CIVP18A3888 to A.D. and R.M.-H.); Spanish Agencia Estatal de Investigación and the Fondo Europeo de Desarrollo Regional (AGL2016-78922-R to A.D. and R.M.-H.); US Department of Agriculture (under agreement no. 8050-51000-098-00D to J.M.O).
Conflict of interest. None declared.
Database URL:http://nutrigenomedb.org.
