


Abstract
Tripal is an open-source, resource-efficient toolkit for construction of genomic, genetic and breeding databases. It facilitates development of biological websites by providing tools to integrate and display biological data using the generic database schema, Chado, together with Drupal, a popular website creation and content management system. Tripal MapViewer is a new interactive tool for visualizing genetic map data. Developed as a Tripal replacement for Comparative Map Viewer (CMap), it enables visualization of entire maps or linkage groups and features such as molecular markers, quantitative trait loci (QTLs) and heritable phenotypic markers. It also provides graphical comparison of maps sharing the same markers as well as dot plot and correspondence matrices. MapViewer integrates directly with the Tripal application programming interface framework, improving data searching capability and providing a more seamless experience for site visitors. The Tripal MapViewer interface can be integrated in any Tripal map page and linked from any Tripal page for markers, QTLs, heritable morphological markers or genes. Configuration of the display is available through a control panel and the administration interface. The administration interface also allows configuration of the custom database query for building materialized views, providing better performance and flexibility in the way data is stored in the Chado database schema. MapViewer is implemented with the D3.js technology and is currently being used at the Genome Database for Rosaceae (https://www.rosaceae.org), CottonGen (https://www.cottongen.org), Citrus Genome Database (https://citrusgenomedb.org), Vaccinium Genome Database (https://www.vaccinium.org) and Cool Season Food Legume Database (https://www.coolseasonfoodlegume.org). It is also currently in development on the Hardwood Genomics Web (https://hardwoodgenomics.org) and TreeGenes (https://treegenesdb.org).
Database URL: https://gitlab.com/mainlabwsu/tripal_map.
Introduction
Methods to reliably and rapidly select desirable lines are highly valuable to plant breeders. In conventional breeding, selection is based on phenotypic observations but for complex agronomic traits such as fruit quality and yield, phenotypic selection is difficult, unpredictable and challenging (6). Genomic locations of numerous genes or quantitative trait loci (QTLs) associated with agronomically important traits have been determined in several crop plants using linkage or association mapping approaches. In linkage mapping approach, members of a population are genotyped with a set of molecular markers and they are often phenotyped for traits of interest. The resulting linkage map shows order of markers along with positions of QTLs within linkage groups, representative of chromosomes. Once the marker-trait association is correctly established, the gene or QTL linked markers can be used to select plants carrying desirable traits in a process referred to as marker-assisted selection. A visualization interface to view and compare genetic maps and associated features that are well integrated with other data in crop databases can play an important role in facilitating further development of QTL-linked markers.
The escalating volume of large-scale data generated for non-model species has increased demand for online community databases where these data can be stored, integrated, visualized and made available for further analyses. Initiated in 2011, Tripal (1, 2) is an open-source toolkit for construction of online biological databases. Using the Drupal (https://www.drupal.org/), content management system and Chado database schema (3, 13), Tripal provides a suite of Drupal modules for both back-end biological data stored in the Chado database and front-end display. Adoption of Tripal is increasing as it provides many tools and features that facilitate creation, maintenance and display of biological data in a cohesive ready-to-use package (5). Drupal provides security, performance and account management and is extensible via an application programming interface that allows site developers to create new PHP modules. Drupal has one of the largest open-source communities in the world and maintains a repository of thousands of user-contributed modules and themes.
The Chado database schema employed by Tripal is a member of GMOD, the Generic Model Organism Database project (www.gmod.org). GMOD represents a collection of open source software tools for managing, visualizing and storing genetic, genomic and breeding data. The Chado database schema is open source, community derived and designed to work with PostgreSQL. It was developed to be generic, modular and ontology-driven for use as a common data store for databases and tools that need to store data for various organisms. Chado is used to construct diverse genomic, genetic and breeding databases, 17 listed here (https://fairsharing.org/collection/Tripal), with specific examples such as the Genome Database for Rosaceae (GDR) (https://www.rosaceae.org) (16), CottonGen (https://www.cottongen.org) (7), Legume Information System (https://www.legumeinfo.org) (11), PeanutBase (https://www.peanutbase.org), TreeGenes (https://treegenesdb.org) (17), i5K NAL (https://www.i5knal.org) (18) and Knowpulse (https://www.knowpulse.org) (14).
The ontology-driven design of Chado allows database developers to store data for new biological concepts and new experimental techniques without constantly changing the schema. The adoption of Chado, however, involves a steep learning curve due to this design. Best practices for storing data are documented on the GMOD website (http://gmod.org/wiki/Chado_Best_Practices) as well as in the Chado manuscript (4) from FlyBase, but it mostly focuses on genomic data. Chado does have a capability to store markers, QTLs and genetic maps and a documentation is available in a recent publication, which describes case studies from GDR and CottonGen for storing genomic, genetic and breeding data (13). The Comparative Map Viewer (CMap), developed in 2003, was an early contribution from the GMOD team that operates in a schema independent of Chado (15). This package is no longer supported and the code base dependencies cannot be further updated. Even though CMap provides versatile functionality, the interfaces are not seamlessly integrated with hosting databases and often the same data needs to be stored twice. There are several other map viewers but they are either proprietary or they do not use Chado to store the data. The details on the map viewers are described in supplementary table (Table S1). The Tripal MapViewer addresses this problem by providing functionality to visualize genetic map data directly stored in Chado, enhancing the functionality of Tripal.
The MapViewer module has been implemented in GDR (rosaceae.org) (8), CottonGen (cottongen.org) (7), Citrus Genome Database (citrusgenomedb.org) (12), Genome Database for Vaccinium (vaccinium.org) and the Cool Season Food Legume Database (coolseasonfoodlegume.org) (10) and is currently being implemented on the Hardwood Genomics Database (hardwoodgenomics.org) (9). This MapViewer Tripal extension module can be found along with the user documentation in the MainLab organization’s GitLab repository https://gitlab.com/mainlabwsu and can also be accessed from https://tripal.info/extensions/modules/tripalmap.
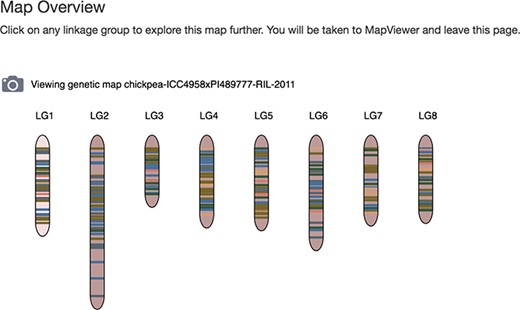
Map Overview page of the Tripal MapViewer user interface. Site visitors can view the linkage group glyphs for a map and by clicking on one, open the main MapViewer page.
Description
Tripal MapViewer is an open source Drupal module for the Tripal platform made freely available under the GNU General Public License 2. The MapViewer module generates a user interface for site visitors and an administration interface for site developers. The user interface provides site visitors with tools to view and compare genetic and physical maps and associated data. For site developers, the administration interface provides configuration options for tutorials, sample maps, map overview, display of organisms and custom controlled vocabulary terms used in Chado. The MapViewer module utilizes materialized views to enable better performance as well as flexibility of data modeling in Chado, allowing existing Tripal databases with different metadata types to use the module. Materialized views can be configured from the Tripal Chado schema administration page. Data for Tripal Map Viewer include species, map, linkage group, marker, QTL, Mendelian Trait Loci (MTL), map and their associated metadata such as genus, species, common name for species, map name, map type for map, marker type and map position for marker and trait name and map position for QTL. Metadata collection and storage varies among community databases and the MapViewer module provides a framework that can be modified for a variety of applications.
To provide more comprehensive integration with Tripal, MapViewer utilizes several Drupal templates provided by the Chado Data Display module (5) to create the Map Positions table in the marker, QTL or MTL pages and high level graphical display of a map in the Map Overview page. By default, Tripal provides template files for various data type pages. However, the template files provided by the Mainlab Tripal Chado Data Display module supply new or improved displays for some of the existing data types. For example, it provides templates for building more informative pages for map, marker, QTL and MTL with distinct metadata, which are linked from the MapViewer.
In the following sections, we will describe the details of each interface: Map Overview, MapViewer Main Page, Marker Map Position page, Dot Plot, Correspondence Matrix, MapViewer Quick Start page and Administration page.
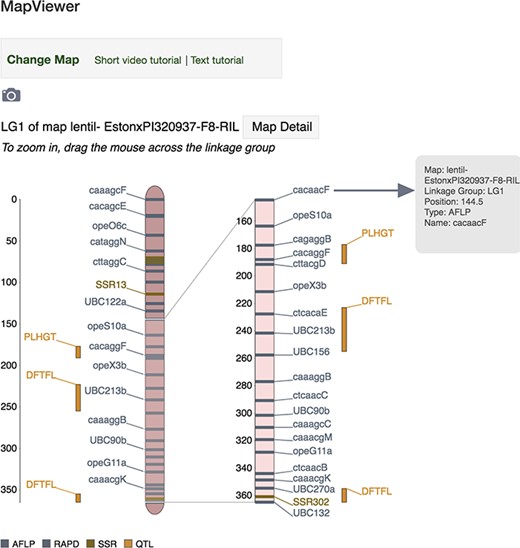
MapViewer main page displaying interactive linkage group interface. Hover above a locus (genetic marker, MTL or QTL) or its label on the zoomed view and a tooltip dialog will appear showing more detailed information about the locus such as map, linkage group, position, type and name. Click on a locus or its label to launch the associated corresponding genetic marker, MTL or QTL Tripal page.
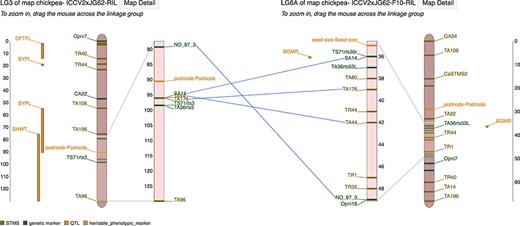
Marker correspondences on the MapViewer main interface page showing lines drawn between linkage groups connecting markers that are shared between the reference and comparison linkage group.
Map Overview
User interface and overview of functionality
The Map Overview is a graphical feature of the MapViewer module, providing high level summary display of the linkage groups that are present in each map (Figure 1). Each linkage group is displayed with a glyph, with lines on the glyph representing markers and QTLs in lanes to the side, depicting the distribution and location of marker and QTLs present. Selecting a glyph launches the MapViewer main page to provide a more detailed view of the linkage group. The Map Overview graphic can be exported to a file by selecting the camera icon by the map name. A graphical representation of the Map Overview feature will be generated in PNG format that can be downloaded.
Tripal integration
The Map Overview page will have links to the MapViewer main page when the Chado Data Display module is enabled for Tripal v2.0 or when the Chado Data Display legacy module template for the feature map is enabled for Tripal v3.0. These include links from each linkage group in the high level summary view and a link to the MapViewer on the left table of contents pane. In Tripal v3.0, another option to make the Map Overview display available, independent of the use of Chado Data Display module legacy templates, is with the marker Map Overview field. The marker Map Overview field is provided by the MapViewer module and can be added to any Tripal content type that provides/supports the feature map data type.
MapViewer main page
User interface and overview of functionality
The MapViewer main page provides an interactive interface for viewing and exploring linkage groups of maps with features and comparing maps with shared markers. The top of the MapViewer main page (Figure 2) shows navigational links to the control panel and to the text and video tutorials. A camera icon below allows the full view of the linkage groups, their markers, marker correspondences between the linkage groups and the marker legend. This can be captured as a PNG image file and exported for download. The Map Detail button links to the Tripal map page associated with the map of the linkage group displayed. The linkage group display consists of a reference linkage group graphic on the left and, if specified, a linkage group on the right. Each linkage group has the following elements: a ruler, full linkage group with sparse marker labels and a zoomed display beside it. Scrolling across the full linkage group will show a dynamically updated zoomed view to the side, displaying details of the scrollable region selected on the full linkage group.
Genetic markers and MTLs are drawn on the main rectangular region of the linkage group, meanwhile QTLs are displayed beside the rectangle in vertical columns. When the comparison map is enabled, scrolling the zoomed section on each linkage group will expose and focus on various areas of each linkage group, simultaneously adjusting the orientation of the correspondence marker lines in real time (Figure 3). At the bottom of the linkage group display, there is a legend, automatically populated with the marker types and their corresponding colors belonging to the linkage group(s) drawn above.
In the control panel (Figure 4), the reference map can be selected using the list selector toolbars for species, map name and linkage group (Figure 4A) and a similar toolbar exists to select the comparison map (Figure 4B). This specifies the comparison linkage group the reference linkage group will be compared against. To give further perspective over existing marker correspondences, the link to view the correspondence matrix (Figure 4C) opens a page providing a grid-like view of marker correspondences displaying the number of markers in common between the reference and comparison map.
The display settings panel provides configuration of marker color, pre-populated with all marker types belonging to the linkage groups displayed, along with statically allocated color options (Figure 4D). The new color choices can be submitted, or reset to original default values. The marker visibility can also be configured, toggling between Show or Hide. This can be particularly useful in the case of isolating and drawing of only specific marker types of interest. They can also make the display more compact, for example in the case where many vertical columns for QTLs are consuming too much horizontal space, the display of QTLs can be hidden. Resetting the marker type visibility setting will default to displaying markers of all types. Marker position and ruler visibility can also be set here. On the top right, there is a link (Figure 4E) to the Dot plot utility which displays as a graph the position of each marker that the two linkage groups drawn above have in common.
In sites that have currently adopted the MapViewer, the MapViewer main page is accessible from the ‘Species’ or ‘Organism Overview’ page and the Tools item in the top menu bar, which is configurable from the Drupal admin structure menus page. These open the ‘MapViewer Quick Start’ page which has a link to the MapViewer main page via the sample map.
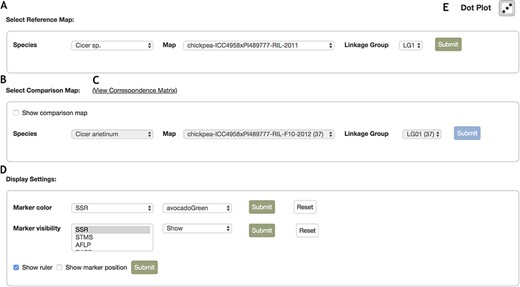
Control Panel interface for the MapViewer main page. The control panel provides configuration options for the display of linkage groups, markers and rulers. A. The reference map can be configured with the drop list selector toolbar. After selecting a species, the options for maps belonging to the species are automatically updated and similarly, selecting a map automatically updates the linkage group field with all relevant linkage group display options. B. Interface where the comparison linkage group is specified. When the map or linkage group in the reference toolbar is modified, the comparison map toolbar is automatically updated with maps and linkage groups that contain correspondences to the reference map and linkage group. Additionally, map and linkage group fields provide the number of marker correspondences in parentheses beside the items in the map and linkage group fields to provide better informed browsing choices. C. Links to the Correspondence Matrix page launching graphical display of correspondences for the reference and comparison map. D. Marker color and visibility controls for the reference and comparison linkage groups. E. Launches Dot plot display for markers in common between reference and comparison linkage groups.
Data
The MapViewer module uses materialized views to improve the performance of queries. Materialized views are database tables used for aggregating data that would otherwise be too slow to query from Chado’s highly normalized tables. A materialized view thus improves the search performance, but also allows the site developer to use the MapViewer module when data is stored in different ways in Chado. When the site developer needs to modify the query that populates the materialized view, the customization of materialized views is performed using an existing Tripal interface. Instructions on how to do this can be found in the README document that accompanies the module. This MapViewer module and user documentation are available for download at the Mainlab Gitlab site: https://gitlab.com/mainlabwsu/tripal_map.
To make data available to MapViewer, one option of loading new data into Chado is through the Mainlab Chado Loader module (MCL), included in the suite of Mainlab Tripal Chado Data extension modules (5). The MCL offers data collection templates that provide a structure from which to populate the data. Then data curators can upload the data from the front-end forms in the web interface, using the data loaders to upload the data into Chado, thus streamlining data entry.
Technical design
Part of what enables the MapViewer linkage group display to be adaptable to many different marker data types and QTLs in different orientations is the modularized approach to drawing the data display elements. Implemented as Javascript classes, the main ‘Chromosome Frame’ (Figure 5A) provides a container for the ‘Chromosome View’ (Figure 5B) and ‘Zoomed View’ (Figure 5C) it is responsible for drawing. In turn, each Javascript class view element draws its contained elements, such as rulers, QTLs, markers, as well as basic D3.js data types. After the ‘Chromosome Frame’ is drawn for the reference linkage group, if the comparison linkage group is visible, the ‘Chromosome Frame’ is also drawn for the comparison linkage group. Any correspondence lines are then constructed using the marker or QTL coordinate positions provided by the scalable vector graphics canvas. These lines are updated by the change in marker element position when the zoomed region is scrolled on the main chromosome rectangle, using the D3.js brush construct, resulting in the Zoomed View displaying a restricted range of selected markers.
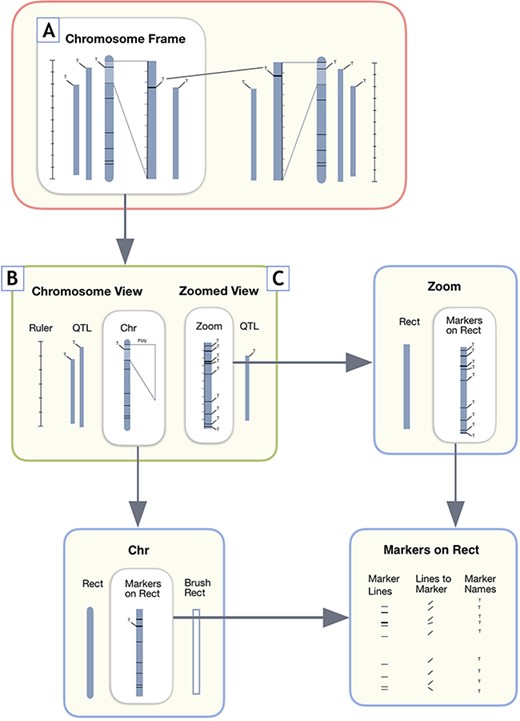
User interface design components for MapViewer linkage group display. A. The Chromosome Frame, which acts as a container for the other drawing elements. B. Chromosome View is a child element of the Chromosome Frame parent. C. The Zoomed View child element draws the zoomed in region to the side of the full linkage group.
Map Position table in marker, QTL and MTL page
In the case of marker features, the Tripal v2.0 core module has only one data template for displaying all types of entries in the feature table of Chado. MapViewer builds upon the additional templates provided by Chado Data Display module for markers, QTLs and MTLs by adding an additional reference to the MapViewer in the Map Positions table in the marker, QTL and MTL pages.
The Map Positions table in these pages displays detailed information for the locus including the map name, the linkage group, locus name and the position in the linkage group where the locus occurs and a link to display the locus in the MapViewer (Figure 6). The ‘Map Positions table is available on the feature page on the Map Positions tab in Tripal v2.0 provided by the Chado ‘Data Display’ module through its templates for genetic markers, QTLs and MTLs. In Tripal v3.0, the Map Positions tab is available through the Chado Data Display module with the legacy module templates for marker feature, heritable phenotypic marker or QTL enabled or by adding the marker Map Positions field to a Tripal content type that supports the feature data type.
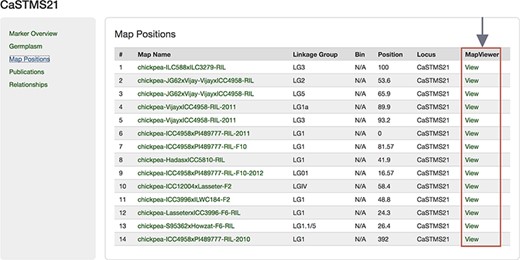
Map Positions table of a Marker page showing the link to MapViewer.
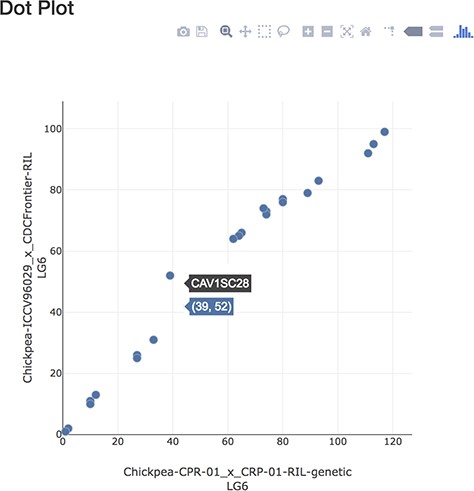
Dot plot page displaying markers in common between linkage groups.
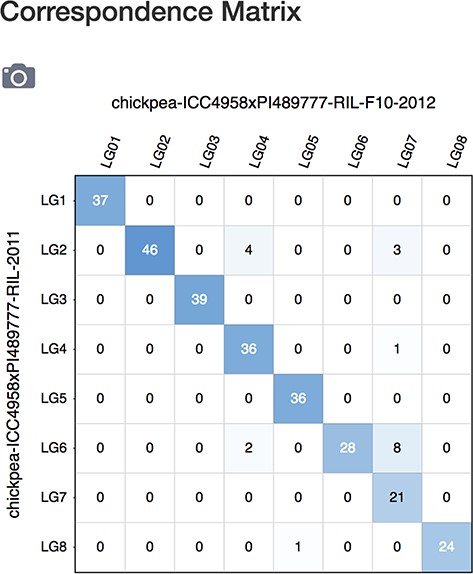
Correspondence matrix page showing number of correspondences between maps in a grid display.
Dot plot
The Dot Plot displays a plot of points where each point represents a marker that is common between the linkage groups specified on the plot axis (Figure 7). Hovering directly over a point will display a tooltip showing the marker name. Hovering to the side of the point displays the marker position on each linkage group. Clicking on the point opens the corresponding Tripal feature marker page, which corresponds to an entity associated with the marker feature type in Tripal v3.0, and in Tripal v2.0, corresponds to the node for that marker feature page, which has additional display elements including the marker Map Position tab. The Map Position tab is provided by the Chado Data Display module and is enhanced by the Tripal MapViewer module to display a link showing the marker in the MapViewer main page. This plot uses the plot.ly Javascript library to draw the marker dot elements and provide the menu bar with options to download the plot as PNG, zoom, pan, select regions, scale, reset the axis and other options. The Dot plot utility is accessible from the Dot plot icon located on the MapViewer below the interactive linkage group display section and also from the MapViewer Quick Start landing page.
Correspondence Matrix
The ‘Correspondence Matrix’ displays a grid of marker correspondence numbers for markers in common between the maps listed on the axis, specified for all linkage groups that the maps contain (Figure 8). Selecting the camera icon on the top left will generate a PNG representation of the correspondence matrix grid that can be exported for download. The axis shows the map name, which links back to the MapViewer main page showing that map and the grid labels show the linkage group names. The grid element background of the correspondence numbers is shaded with a color intensity gradient that acts as a quick visual aid, reflecting the number of correspondences. A very dark background color reflects a high number of correspondences exist, a pale color implies very few correspondences while a white background indicates zero correspondences. Clicking on a number in a grid element will launch the MapViewer main page displaying the specific map and linkage group combination associated with position. The Correspondence matrix is available from the MapViewer main page as well as from the MapViewer Quick Start landing page through the example link.
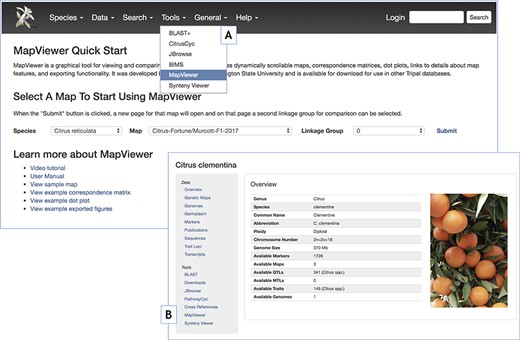
MapViewer Quick Start landing page introducing MapViewer functionality and providing usage instructions and examples. A. Tools menu reference to the MapViewer landing page. B. Reference to the MapViewer landing page through the table of contents side panel in the Tripal Organism or Species pages.
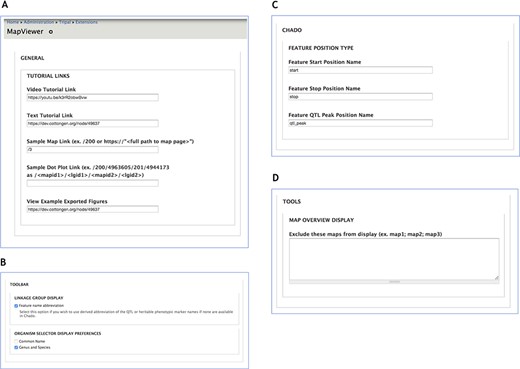
Administration page providing configuration options for MapViewer displays. A. The General section interface to configure links for tutorials and usage examples. B. Toolbar settings to specify feature name format. C. The Chado section provides way to customize Chado terminology for feature position names. D. Maps to be excluded from display by the MapViewer can be listed in the Tools section.
MapViewer Quick Start page
The MapViewer Quick Start page (Figure 9) can be used to optionally direct site visitors to tutorials and showcase a range of examples of Tripal MapViewer related tools and utilities. The MapViewer Quick Start page includes video and textual user manuals, a toolbar to specify a map to lauch in the MapViewer main page, sample maps and examples of Correspondence matrix, Dot plot and PNG export figures. Many of the links presented on this page can be customized to the site adopting MapViewer by editing the configuration options in the MapViewer Admin page. In sites with Tripal MapViewer module, the MapViewer Quick Start page can be accessed through the Tools menu (Figure 9A) in the top header bar and through the Organism/Species page (Figure 9B).
Administration page
The Tripal MapViewer Administration page supports configuration of various settings and aspects of Tripal MapViewer (Figure 10). The Administration page is accessible from the Tripal menu by selecting the ‘extensions’ option and visiting the MapViewer link. In the General section, (Figure 10A) the Tutorial Links specify the link values at the top of the MapViewer main page in the tutorial links section and in the MapViewer Quick Start page. Changes in the video and text tutorial fields will be dynamically reflected in these pages. In the Toolbar section (Figure 10B) there are two settings, the Linkage Group Display and the Organism Selector Display Preferences. The Linkage Group Display section controls the setting for whether or not feature names for QTL and MTL, stored in Chado as a heritable phenotypic marker, are abbreviated. The abbreviated names appear beside the linkage group and the full name appears on the marker label tooltip. The Organism Selector Display Preference specifies whether the common name, the genus and species name or both will be used to refer to the Organisms shown in the toolbar selector list.
In the Chado section (Figure 10C), the ‘feature position’ names for start, stop and QTL peak position can be customized here if a different terminology is used in the Chado database. The names in these fields are accessed dynamically to determine the positioning of markers on the linkage groups. The Tools section (Figure 10D) also allows the site developers to specify maps they wish to exclude from display by the MapViewer. Specifically on the feature map page, the Map Overview will omit high level graphical display of any maps specified in this list and this applies to both the Tripal v2.0 version using Chado Data Display templates, as well as Tripal the v3.0 field. In Tripal v2.0, MapViewer will also be omitted from display in the table of contents side panel.
Conclusion and Future Direction
Taking advantage of the Tripal infrastructure and the data schema provided by Chado, the Tripal MapViewer module provides significant additional functionality to Tripal. Future efforts will include functionality to display genome data stored in the sequence module of Chado so that site visitors can compare genomes and genetic maps via shared markers. When the markers stored in Chado have location information both in the genome and the genetic map, the genome and the genetic map will be linked by shared markers. Users will be able to go from the genetic map to the genome in Tripal MapViewer and to JBrowse to view more data such as transcriptome data aligned to the genome.
Acknowledgements
We acknowledge with thanks the Tripal and GMOD developer communities; the Rosaceae, cotton, citrus, cool season food legume, Vaccinium, hardwood and forest tree genomics research communities; and our federal, industry and university funding sources; the entire Tripal software development community, particularly Lacey-Anne Sanderson (University of Saskatchewan), for contributing to and providing the Tripal infrastructure that the MapViewer extension module is built on.
Funding
National Science Foundation Plant Genome Research Program Award (#444573); USDA NIFA National Research Support Project 10 (NRSP10); Washington State University; University of Tennessee and University of Connecticut.
Conflict of interest. None declared.
References
Author notes
Co-first authors.
